

A contact angle observed for a liquid–solid system is not necessarily a unique value, and a few contact angles need to be considered carefully in relation to liquid spreading, adhesion and phase separation. Understanding of the significance of different contact angles has improved in the last few years through direct measurements of interactive forces between droplets/bubbles and solids together with the simultaneous visualization of the changes in their shapes. A microelectronic balance system is employed to measure the force of spreading after either liquid droplet or gas bubble attachment to a substrate surface and the droplet/bubble–substrate adhesion forces after droplet/bubble compression, retraction and detachment. Equipped with a camera in flank and data-acquisition software, the instrument measures directly the forces, monitors droplet/bubble–surface separation with respect to distances over which the droplet/bubble stretches and collects optical images simultaneously. The images are used to analyze capillary pressure and surface tension forces based on the measured droplet/bubble dimensions, shapes of surfaces and values of contact angles. These measurements allow researchers to correlate the advancing, receding and most stable contact angles with liquid–solid interactive forces and analyze their scientific meaning. This review summarizes the very recent literature reports on measurements and interpretation of liquid droplet/gas bubble interactive forces and associated contact angles.
Notation
- A
droplet base area
- C
numerical factor (Equation 10)
- d
pillar size
- E
Young’s modulus
- F
force; the subscripts ‘S’, ‘max’, ‘off’, ‘T’, ‘L’ and ‘LA’ refer to spreading, maximum adhesion, pull-off, surface tension, Laplace pressure and lateral adhesion, respectively
- ff
frictional force per unit length of the contact line
- G
Gibbs energy; the subscripts ‘after’ and ‘before’ refer to terminated spreading and before spreading, respectively
- L
length of a beam
- l
contact line length on a single pillar
- li
length of contact line segments with a local contact angle of θi
- n
number of contact line segments
- R
radius of a spherical droplet that has not attached a substrate
- R1, R2
principal radii of the droplet surface
- RL
principal radius of a spherical-cap droplet on a substrate
- RS
solid surface radius of curvature
- r
apparent droplet base radius; the subscripts ‘i’ and ‘E’ refer to local and effective, respectively
- T
thickness of the beam
- V
droplet/bubble volume
- W
width of the beam
- β
angle between the solid–liquid interface and the horizontal plane
- ΔP
Laplace pressure
- Δx
beam deflection
- δ
ratio of the actual contact line length to the apparent contact line length
- θ
contact angle; the subscripts ‘S’, ‘ms’, ‘off’, ‘i’, ‘a’, ‘aT’, ‘S_a’, ‘A’, ‘R’, ‘min’ and ‘max’ refer to spreading, most stable, pull-off, local contact angle at location i, advancing, advancing on a textured surface, the angle between the liquid–vapor interface and the horizontal plane for spherical substrate, advancing as measured with goniometry, receding as measured with goniometry, minimum and maximum, respectively
- λ
center-to-center pitch of pillar patterns
- σ
surface/interfacial tension or surface free energy per unit area; the subscripts ‘LV’, ‘SV’ and ‘SL’ refer to liquid–vapor, solid–vapor and solid–liquid, respectively
- Φ
ratio of the solid–liquid interface to the projected droplet base area
1 Introduction
Over the last two centuries, liquid spreading and adhesion have been typically analyzed through measurements of contact angles.1,2 However, significant drawbacks of contact angle measurements include arbitrary selection of the stages of liquid spreading and wetting at which the contact angles are measured3 and, more importantly, liquid-supporting phase adhesion is estimated based only on either ill-defined theoretical equations or experimental contact angle values.2 With the advent of sensitive microbalances, similar to what is typically used in Wilhelmy-type tensiometers,4 together with the development of a hydrophobic loop to hold a liquid drop or a gas bubble, the droplet (or bubble) spreading after attachment and then its adhesion with a solid surface of varying shapes, surface functionalities and topographies are measured directly, without a need for additional calculations.5–9 Other methods such as centrifugal adhesion balance,10,11 which uses the centrifugal force to drive the droplet, can also quantify the droplet–substrate adhesion but will not be detailed in this review. This is because the microbalance–camera system simultaneously allows the recording of the changes in droplet (bubble) dimensions, shapes and contact angles together with the interactive forces during spreading, adhesion and detachment. As a result, force barriers in transitions from spontaneous spreading to maximum adhesion and then pull-off can be quantified directly. Monitoring contact angles in tandem with recorded droplet (or bubble)–solid interactive forces is a significant advantage over the past approaches limited to contact angle measurements.
This review is aimed at introducing the new forces and contact angles measured by the microbalance–camera system and providing their in-depth interpretations in association with surface properties, such as wettability, macroscopic shape (curvature) and texture geometric dimensions. The use of sensitive microbalances in recording forces at both spreading and detachment stages is not well exploited in surface chemistry and materials science laboratories. Nevertheless, several impactful reports were published in the literature in the last decade. Here, the authors review the experimental data and their interpretations, highlight possible misconceptions and controversial interpretations and provide suggestions for future research directions.
The review starts with an introduction of the microbalance–camera system and an explanation of the interactive force curve with key force points. Then, three consecutive sections review droplet spreading, maximum adhesion and pull-off forces on flat, curved, micro-patterned surfaces and surfaces with random roughness and heterogeneity. Emphasis is given to interpretation and justification of contact angles measured at these three stages of spreading, adhesion and separation. In the final section, the limitations of the current instruments and potential directions of improvement are briefly discussed.
2 Measurements of forces and contact angles with a microbalance–camera system
2.1 System and measurements
Figure 1(a) shows a high-sensitivity microelectronic mechanical balance that is equipped with a charge-coupled device (CCD) camera, commonly used in studies of fluid droplet/bubble spreading and adhesion, together with its schematic diagram (Figure 1(b)) and optical images of a water droplet and a gas bubble (Figure 1(c)). An about 3–4 μl volume liquid droplet or gas bubble is typically suspended with a microsyringe on a stationary hydrophobic ring connected to a microbalance. The sample (solid or liquid) is placed under the droplet/bubble on a vertically movable table, whose position and movement speed are controlled by a programmed motor. Typical recordings for the attachment, spreading, adhesion and pull-off forces of a liquid droplet and an air bubble are shown in Figure 2. The force-against-distance loop (the vertical position of the movable table) comprises five distinctive steps: (a) the sample is placed nearer a droplet/bubble without any recordable interactions (from point A to B); (b) the process of attachment between the droplet/bubble and the sample surface causes spontaneous spreading (point C); (c) the attached droplet/bubble undergoes mechanical compression (from point C to D); (d) the droplet/bubble stretches (from point D to E); and (e) the ring-hosted droplet/bubble separates from the substrate surface (point F). Concurrently, a CCD camera is used to record the sequence of attachment and detachment processes. The individual CCD frames are used to analyze the droplet shape and dimensions and measure the contact angle at various stages of liquid droplet/gas bubble spreading and retreat.
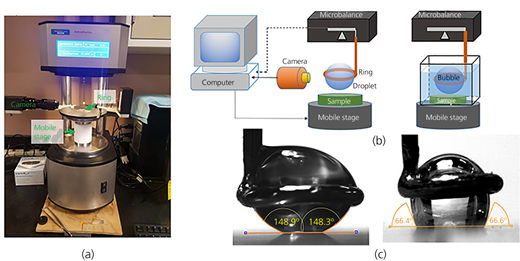
Experimental set-up used in adhesion force measurements: (a) Microbalance (DCAT 21, DataPhysics, Germany) and experimental set-up used in adhesion force measurements; (b) schematic diagram of microbalance with a liquid droplet (left) and a gas bubble (right); (c) optical images of a water droplet (left) in contact with a hydrophobic pattern and a gas bubble (right), both with marked contact angles
Experimental set-up used in adhesion force measurements: (a) Microbalance (DCAT 21, DataPhysics, Germany) and experimental set-up used in adhesion force measurements; (b) schematic diagram of microbalance with a liquid droplet (left) and a gas bubble (right); (c) optical images of a water droplet (left) in contact with a hydrophobic pattern and a gas bubble (right), both with marked contact angles
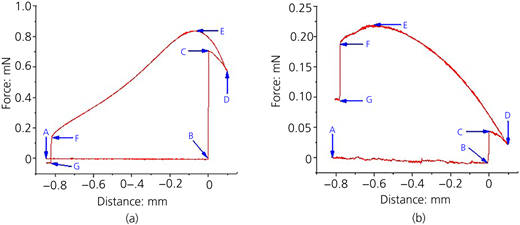
Examples of force curves for (a) a water droplet and (b) an air bubble in interactions with a magnesite surface.12 Reused with permission from Elsevier
Examples of force curves for (a) a water droplet and (b) an air bubble in interactions with a magnesite surface.12 Reused with permission from Elsevier
The measurement starts with the droplet/bubble approaching the specimen surface (force = 0, point A to B). When the droplet/bubble touches the substrate surface at point B, contact is established and the droplet/bubble spreads spontaneously until point C. The force measured at point C is named the spreading force (F S) and the contact angle measured when the spontaneous spreading terminates is termed ‘spreading contact angle’ (θ S). The authors would like to add here that the spreading force is sometimes called snap-in force. The term ‘snap-in’ was adopted from colloidal force measurements with surface force instruments such as the atomic force microscope,13 to describe the jump of a cantilever caused by a long-distance force that brings the tip into mechanical contact with a substrate. In the case of force measurements for fluid droplets/bubbles, the force measured at point C is the result of both the droplet/bubble–substrate attachment force and orders of magnitude stronger capillary pressure force that drives the spontaneous spreading of fluid.
Between points C and D, the droplet/bubble is typically pushed against the solid to increase mechanically the contact area of the droplet/bubble with the sample. This step can be avoided, particularly if the spontaneous spreading (point C) is sufficient to establish a large area of liquid droplet/solid contact area. From point D, retraction takes place and the droplet/bubble is stretched. The maximum force measured during stretching is at point E and is referred to as the maximum adhesion force (F max). Because this point reflects the highest stability in droplet/bubble–substrate adhesion, the contact angle measured at point E is termed the ‘most stable contact angle’ (θ ms). Because the three-phase contact line either retreats (de-wets) or advances (wets) during measurements with the liquid droplet and gas bubble, respectively, the most stable contact angle can differ between these two (reversed) systems.
Further stretching of the attached droplet/bubble reduces the liquid/gas–solid contact area until point F. When the pull-off force (F off) exceeds the adhesion or cohesion force, the droplet/bubble is either detached from the solid entirely or broken into smaller drops/bubbles, one remaining in the holding ring and one attached to the solid surface. The droplet/bubble contact angle corresponding to the pull-off force is termed ‘pull-off contact angle’ (θ off). A split of the droplet/bubble into two happens when the forces of adhesion exceed the cohesive force of the liquid, and therefore, the measured value for such a case has very limited meaning.
2.2 Examples of force and contact angle results
There are several publications reporting measurements of interactive forces with a microbalance using either liquid droplets5–7,14–20 or gas bubbles.21 However, reporting of spreading and adhesion forces in reversed systems, for both droplets and bubbles, are rare.12 As an example, Table 1 summarizes experimental data from force measurements for water droplets and air bubbles with three solid specimens with different affinities to water – namely, magnesite, hematite and polydimethylsiloxane (PDMS). The data in Table 1 include three forces (F S, F max and F off) and three contact angles (θ S, θ ms and θ off) measured at the three key stages of spontaneous spreading, maximum adhesion and separation of either the droplet or bubble from the solid. Additionally, the last column presents the contact angle hysteresis,22 calculated as the difference between θ S and θ off, as it has been reported that the spreading contact angle is close to the advancing contact angle and the pull-off contact angle is close to the receding contact angle.7 As shown by the average values and standard deviations, all experimental values are highly reproducible. In general, as these few data indicate, the water–solid adhesion force increases with increasing hydrophilicity of solid, reflected in decreasing water contact angles. The air bubble spreading and adhesion forces overpower those of the water droplet in the case of hydrophobic substrates such as PDMS. This is expected since decreased hydrophilicity resists water wetting and at the same time drives spreading of the gas bubble. Further, the contact angles in Table 1 suggest a close overlap between θ S measured for droplets with θ off measured for bubbles, and the reverse (θ S measured for bubbles with θ off measured for droplets) – that is, when contact angles are measured for the triple line that either advanced or retreated.
Comparison of forces and contact angles from water droplet/specimen and air bubble/specimen measurements
| Test | Spreading (point C) | Maximum adhesion (point E) | Pull-off (point F) | Contact angle hysteresis | |||
|---|---|---|---|---|---|---|---|
| F S: μN | θ S: ° | F max: μN | θ ms: ° | F off: μN | θ off: ° | Δθ: ° | |
| Magnesite | |||||||
| Droplet12 | 510 ± 2 | 51 ± 2 | 650 ± 3 | 27 ± 2 | (98 ± 4) | 24 ± 2 | 27 ± 3 |
| Bubble12 | 85 ± 11 | 15 ± 1 | 185 ± 15 | 35 ± 3 | 172 ± 8 | 41 ± 2 | 26 ± 3 |
| Hematite | |||||||
| Dropleta | 102 ± 7 | 82 ± 5 | 502 ± 8 | 47 ± 5 | (100 ± 4) | 37 ± 4 | 45 ± 7 |
| Bubble21 | 40 ± 3 | 43 ± 2 | 242 ± 6 | 87 ± 2 | 196 ± 7 | 89 ± 2 | 46 ± 3 |
| PDMS | |||||||
| Droplet7 | 97 ± 1 | 118 ± 3 | 216 ± 3 | 91 ± 2 | 75 ± 1 | 88 ± 3 | 30 ± 4 |
| Bubblea | >200 | 84 ± 8 | 344 ± 15 | 107 ± 3 | 189 ± 10 | 112 ± 2 | 28 ± 8 |
Unpublished data recorded by Donghui Wang
The value of pull-off force in parentheses indicates that the water droplet broke in final stages of detachment. The spreading force for PDMS was not determined precisely due to relocation of the air bubble in the ring during the bubble jump into contact with PDMS
There are significant differences between the most stable contact angles measured with water droplets and air bubbles (Table 1), clearly confirming that a triple line prefers a different shape and location when advancing through a ‘dry’ area than during retreating from an already wet area (note that the possibility of different pre-wetting/adsorption states of the liquid on the solid surface in front or behind the triple line cannot be ruled out). In other words, the energy consumptions during wetting and de-wetting are different.
2.3 Components of recorded forces
The interactive force between the droplet/bubble and a sample surface consists of surface tension (F T) and capillary pressure (F L) components. The surface tension force is the vertical component of the liquid–vapor interfacial tension force acting along the droplet perimeter. The capillary pressure force is caused by the curvature of the liquid bridge. Combination of these two force components is presented in the following equation:7
where σ LV is the liquid–vapor interfacial tension, l i is the length of contact line segments with the local contact angle θ i and A is the droplet base area (A ≅ πr 2, where r is the apparent droplet base radius). By considering the contact line density (δ) that describes the ratio of the actual length of the triple contact line to the apparent one (2πr) due to its contortion and assuming that the local contact angles along the droplet perimeter are uniform (there is only one value of θ i), Equation 1 reduces to7
Regarding δ, on an ideally flat surface, the contact line is expected to be not distorted and hence the effective length of contact line equals the droplet perimeter, δ = 1. ΔP is the Laplace pressure, which can be approximated by the principal radii (R 1 and R 2) of the droplet/bubble, as ΔP = σ LV(1/R 1 + 1/R 2) for a convex droplet/bubble shape and ΔP = σ LV(1/R 1 − 1/R 2) for a concave shape. Both the spreading and adhesion forces were calculated with Equation 2, using all geometric parameters from recorded optical images, confirming the validity of this theoretical equation in describing the droplet–solid interactive forces.7,17,18 In fact, the parameters shown in Equation 2 are all geometric parameters, and hence, F can be numerically calculated by solving the Young–Laplace equation with the knowledge of the droplet volume.23–25
3 Spreading force and spreading contact angle
3.1 Flat surface
When a droplet/bubble contacts a solid surface, the droplet/bubble spontaneously and instantly spreads to the shape of a spherical cap with a contact angle denoted as spreading contact angle (θ S). The inertia and capillarity govern the instant spreading process, while the final droplet shape at which the spontaneous spreading terminates is governed by capillarity.26–29 The spreading process is accompanied by lowering/rising of the droplet/bubble center of mass, which pulls the sensor, and hence, a sudden spreading force (F S) can be measured.
Various studies reported that the spreading force decreases monotonically with the droplet advancing contact angle and the measured spreading contact angles are close to the advancing contact angles measured with the goniometry.6–8 In fact, the spreading contact angle is supposed to be equal to the advancing contact angle, as it represents a quasi-equilibrium stage following the concept of Gibbs free energy minimization. Specifically, as shown in Figure 3(a), the Gibbs energy of a droplet that completes spreading (with a contact angle of θ S) on a flat surface is given as
where the first term on the right-hand side is the energy of the liquid–vapor interface, the second term represents the energy of the newly formed liquid–solid interface (σ SL), the third term represents the energy gained by destroying the solid–vapor interface (σ SV) and the fourth term represents the energy dissipation by the frictional force per unit length of the contact line (f f) that resists the advancing motion ().8 For a droplet with a volume V and a contact angle θ S, the droplet base radius is
as the droplet is geometrically a spherical cap.30 The frictional force per unit length of a contact line (f f) works together with the solid–liquid interfacial tension σ SL to resist the advancing motion (wetting) of the contact line.31 Therefore, when a droplet is at the edge of advancing with an advancing contact angle θ a, the force balance along the three-phase contact line is
Inserting Equation 5 into Equation 3 and normalizing G after by the surface energy of a spherical water droplet with a volume of before contacting the solid surface (G before = 4πR 2 σ LV, where R = (3V/4π)1/3), the normalized Gibbs free energy of the droplet that completes spontaneous spreading is scaled as
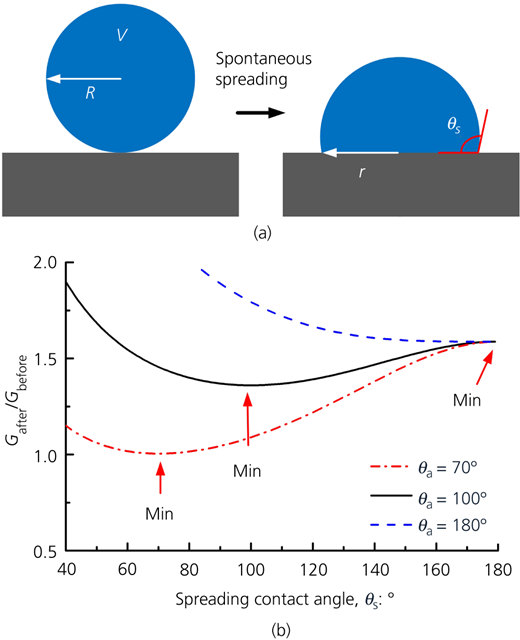
(a) Schematic diagram of the spontaneous spreading of a droplet. (b) For fixed droplet volumes at ∼3 μl, the normalized Gibbs free energy (G after/G before) of droplets on surfaces with different intrinsic advancing contact angles (θ a) is plotted against the spreading contact angle (θ S)
(a) Schematic diagram of the spontaneous spreading of a droplet. (b) For fixed droplet volumes at ∼3 μl, the normalized Gibbs free energy (G after/G before) of droplets on surfaces with different intrinsic advancing contact angles (θ a) is plotted against the spreading contact angle (θ S)
It should be noted that Equation 6 also applies to textured surfaces by replacing θ S with θ aT (advancing contact angle on a textured surface).8,30 By plotting G after/G before with respect to θ S, which is set to vary from 1 to 179°, Figure 3(b) shows that there exists a minimum value of G after/G before when θ S equals θ a. Therefore, based on the concept of energy minimization, it is corroborated that the spreading contact angle, which is measured when the spontaneous spreading terminates, should be close to the advancing contact angle. Nevertheless, viscous dissipation and other factors are not considered in Equation 6, and hence, a deviation of the measured θ S from θ a is expected.
3.2 Curved surface
On spherical surfaces, the surface radii of curvature (R S) significantly affect the droplet spreading characteristics – for example, droplet shape profile, apparent spreading contact angle and spreading force. As shown in Figure 4(a) and reported by Zhu et al.,17 when water and ethylene glycol droplets are allowed to spread spontaneously on spherical polyethylene terephthalate (PET) surfaces with R S of 2, 4, 6 and 8 mm, the apparent spreading contact angle (θ S_a, the angle between the liquid–vapor interface and the horizontal plane) decreases and the spreading force increases with the increase in surface radii of curvature (R S), while a flat surface (R S approaches infinity) corresponds to the largest F S and smallest θ S_a. To explain this trend in a quantitative manner, the droplet volume in a spherical-cap shape on a curved surface can be expressed as
where β denotes the angle between the solid–liquid interface and the horizontal plane, and hence, the actual spreading contact angle is θ S = θ S_a − β – that is, the angle between the solid–liquid interface and the liquid–vapor interface. As shown in Figure 4(b), there is a geometrical relationship r = R S sin β = R L sin θ S_a, where R L is the principal radius of the apparent droplet. For a droplet with a volume V and a surface with a curvature radius R S, there exist infinite droplet shape profiles and hence infinite combinations of β and θ S_a. Different droplet shape profiles correspond to various Gibbs free energy values as
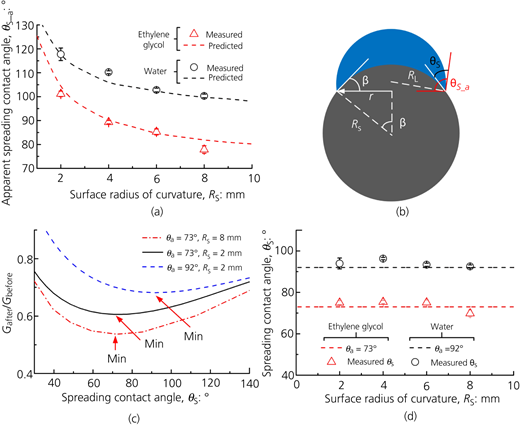
(a) For fixed droplet volumes at ∼3 μl, apparent spreading contact angles (θ S_a) of water and ethylene glycol droplets on spherical surfaces with varying radii of curvature (R S), where the symbols are measured values and the lines are predictions (Equation 7). (b) Schematic diagram of a droplet on a spherical surface. (c) For fixed droplet volumes at ∼3 μl, normalized Gibbs free energy (G after/G before) of droplets on surfaces with different R S values and intrinsic advancing contact angles (θ a) plotted against spreading contact angle (θ S). (d) Measured θ S on spherical surfaces with different R S values
(a) For fixed droplet volumes at ∼3 μl, apparent spreading contact angles (θ S_a) of water and ethylene glycol droplets on spherical surfaces with varying radii of curvature (R S), where the symbols are measured values and the lines are predictions (Equation 7). (b) Schematic diagram of a droplet on a spherical surface. (c) For fixed droplet volumes at ∼3 μl, normalized Gibbs free energy (G after/G before) of droplets on surfaces with different R S values and intrinsic advancing contact angles (θ a) plotted against spreading contact angle (θ S). (d) Measured θ S on spherical surfaces with different R S values
Equation 8 is fundamentally identical to Equation 3 but the area of the liquid–vapor interface has been changed to and the area of the solid–liquid/solid–vapor (the area being slid by the advancing contact line) interface has been changed to . Normalizing G after by G before, the following is obtained:
For fixed V and R S, by plotting G after/G before with respect to θ S (θ S_a − β), which is set to vary from 1 to 179°, Figure 4(c) shows that there exists a minimum value of G after/G before when θ S equals θ a. Indeed, Zhu et al.17 reported that the measured θ S was close to θ a despite the variance in radii of curvature from 2 to 8 mm (Figure 4(d)). The results corroborate that the spreading contact angle should be close to the advancing contact angle regardless of the surface geometry (flat or curved) or liquids being used (water and organic liquids, e.g. ethylene glycol).
Moreover, Equation 7 allows the prediction of the apparent spreading contact angle (θ S_a) on spherical surfaces, which was reported to decrease with the increase in R S, with the knowledge of R S and droplet volume (V). Specifically, adopting the condition that θ S = θ S_a − β = θ a, Equation 7 can be numerically solved to generate θ S_a, which is plotted in Figure 4(a) using dashed lines. Indeed, the measured θ S_a values of water and ethylene glycol droplets on spherical PET surfaces with varying R S are well predicted.
3.3 Micro-patterned surface
The preceding sections describe the fundamental definition of spreading contact angle on flat and spherical surfaces. Surface micro-textures also affect droplet spreading, particularly when dealing with droplets in the Cassie–Baxter state.32 In general, patterned surfaces with homogeneous textures, on which droplets behave identically in all directions, can be categorized into two groups: pillared and pored surfaces, as shown in Figure 5(a). The former involves a discontinuous three-phase contact line, because the droplet contacts only the pillar tops, and the liquid–solid interfaces (wetted surface) are isolated. In contrast, the latter is associated with a continuous contact line, where the liquid–vapor interfaces (under which air is trapped) are isolated and the solid–liquid interfaces are connected. Although the solid fraction (Φ, the ratio of the solid–liquid interface to the projected droplet base area) of pillared and pored surfaces can be identical, the droplet–solid interactions are vastly different, particularly the spreading phenomena.8
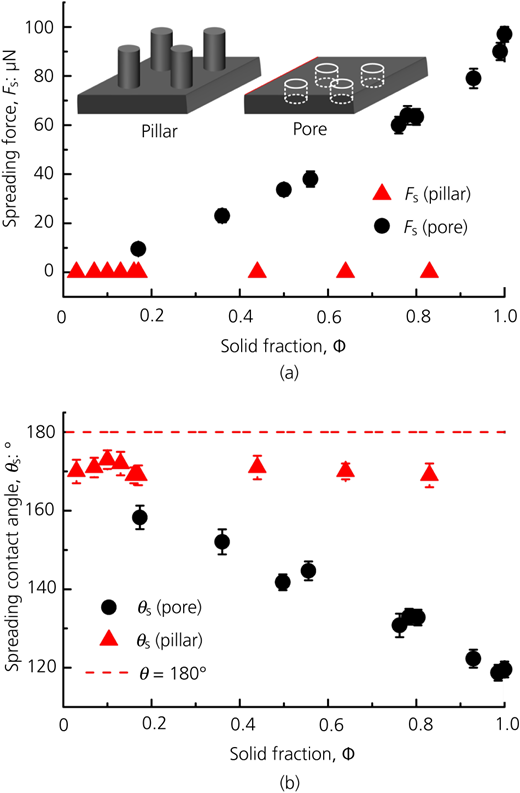
(a) Measured spreading forces and (b) spreading contact angles plotted with respect to the solid fraction of the surface substrate (reproduced from the paper by Jiang et al.8 with permission)
(a) Measured spreading forces and (b) spreading contact angles plotted with respect to the solid fraction of the surface substrate (reproduced from the paper by Jiang et al.8 with permission)
Jiang et al.8 measured the spreading force and spreading contact angle on pillared and pored surfaces, as shown in Figures 5(a) and 5(b). The results showed that the spreading forces increase with the increase in solid fraction for pored surfaces, whereas the spreading forces on pillared surfaces remain zero despite a large disparity in solid fraction. Correspondingly, the spreading contact angles decrease with the increase in solid fraction for pored surfaces but remain constant at around 165° for pillared surfaces. For pored surfaces, the trend makes sense, as water spreads over the continuous solid surface between holes. In contrast, for pillared surfaces, spontaneous spreading is forbidden by the air gaps between pillars, as water cannot spread on air. In fact, the spreading phenomena can be also well described by Equation 6. Since the droplet advancing (forced wetting) motion on pillared surfaces requires a descent of the liquid–vapor interface, the actual advancing contact angle would be 180°. In practice, a contact angle of between 160 and 170° is typically measured.33,34 Inserting a θ a of 180° into Equation 6 and plotting G after/G before with respect to θ S (varying from 1 to 179°), Figure 3(b) shows that the minimal value of G after/G before occurs at 179° (a θ S of 180° cannot apply to Equation 6). This indicates that the failure of droplet spontaneous spreading on pillared surface is energetically favored.
To sum up, Equations 3 and 5–9 indicate that the spreading contact angle is a physical parameter that precisely describes surface wettability (similar to the advancing contact angle). The method that allows a droplet to spread spontaneously on a solid surface can serve as a reliable tool for characterizing surface wettability regardless of surface geometry (flat, spherical and patterned) or liquid properties (water, ethylene glycol and, the authors believe, many other liquids).
3.4 Surfaces with random roughness and heterogeneity
Samuel et al.6 reported a nearly linear effect of the advancing (water) contact angle (θ A), as determined independently with a goniometer, on the spreading force (F S) for 20 different surfaces. (Note that concurrent measurements of the spreading contact angle (θ S) and spreading force (F S) are more appropriate in view, as mentioned earlier, of differences in values measured with two different set-ups.)
The experimental results for 14 flat and smooth surfaces reported by Samuel et al.6 are reproduced in Figure 6 under the label ‘Hydrophobic samples’, which comprise molded plastic sheets, solution-coated polymer films, chemical vapor deposition polymerized polymer films and self-assembled monolayers on silicon wafers. As shown in Figure 6, with exception of values for perfluoroacrylate, the experimental points follow a (dashed) line. Although the authors did not report the quality of surfaces prepared, it is reasonable to assume that the majority of samples used were quite smooth and homogeneous specimens (note that the data for micro-patterned hydrophobized silicon wafer and natural rose petal are not included in Figure 6). Figure 6 also includes five spreading force against spreading contact angle data points for smooth films of nylon, ethylene vinyl acetate (EVA), PET and PDMS and micro-patterned PDMS under the label ‘Polymers’, reported by Sun et al.7 The data are close to the linear correlation for advancing contact angles reported by Samuel et al.,6 with the result for PET being much outside of the dashed line range.
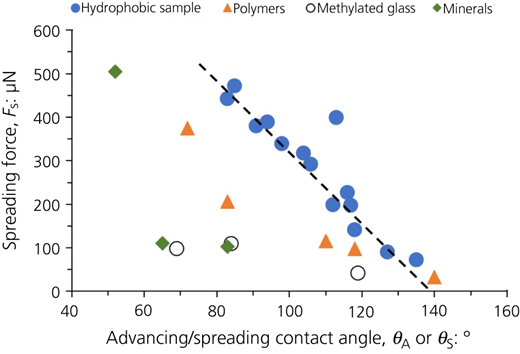
Spreading force as a function of the spreading contact angle. ‘Hydrophobic samples’ refer to molded plastic sheets, solution-coated polymer films, chemical vapor deposition polymerized polymer films and self-assembled monolayers on silicon wafers reported by Samuel et al.;6 ‘polymers’ include films of nylon, EVA, PET and PDMS reported by Sun et al.;7 ‘methylated glass’ refers to glass slides modified with trimethylchlorosilane;15 and ‘minerals’ include magnesite,35 hematite (unpublished) and alumina (unpublished). Broken lines are for guiding the eye
Spreading force as a function of the spreading contact angle. ‘Hydrophobic samples’ refer to molded plastic sheets, solution-coated polymer films, chemical vapor deposition polymerized polymer films and self-assembled monolayers on silicon wafers reported by Samuel et al.;6 ‘polymers’ include films of nylon, EVA, PET and PDMS reported by Sun et al.;7 ‘methylated glass’ refers to glass slides modified with trimethylchlorosilane;15 and ‘minerals’ include magnesite,35 hematite (unpublished) and alumina (unpublished). Broken lines are for guiding the eye
Further, Figure 6 also includes the data for heterogeneous ‘methylated glass’, which refers to glass partially methylated with trimethylchlorosilane,15 and inhomogeneous/polished ‘minerals’ of magnesite,35 hematite (unpublished) and alumina (unpublished). It is obvious from Figure 6 that the data for these imperfect surfaces are not even close to the linear correlation of Samuel et al.,6 suggesting that any random imperfections of the surface might inhibit droplet spreading. However, it was also shown that the random nano-roughness of minerals facilitates the spreading of water and magnitude of spreading force (in the case of bubbles, the effect is reversed), although this effect is not substantial.12,21
4 Maximum solid–liquid adhesion and most stable contact angle
During droplet/bubble stretching, the detected adhesion forces first increase, and after a maximum value is detected, the forces decrease until the droplet/bubble separates from the surface. The maximum value is referred to as the maximum adhesion force (Fmax) and the corresponding droplet contact angle is the most stable contact angle (θms), both of which are unique physical parameters that reflect surface wettability. In the following subsections, the droplet characteristics at the maximum adhesion and the most stable contact angle are introduced and discussed for flat, curved, micro-patterned and randomly rough surfaces.
4.1 Flat surface
On an ideally flat surface, the droplet base should remain a circular shape in both spreading and retraction in the spirit of energy minimization. However, on heterogeneous surfaces – for example, surfaces textured with grooves, where the droplet–solid interactions are different in directions perpendicular and parallel to the grooves, the droplet does not necessarily remain a circular shape. Specifically, Cwickel et al.36 reported that the droplet base adopts a non-circular shape (the diameter parallel to the grooves is larger) upon deposition onto a groove-patterned surface. After vibration of the sample, which is a well-accepted way of achieving the equilibrium (most stable) state of a droplet, the droplet changed its shape to a circular base. Therefore, a conclusion was made that a circular droplet base and uniform contact angles along the droplet perimeter is a necessary indicator of the most stable state of a droplet.
Sun et al.14 measured the adhesion force of a droplet in the Cassie–Baxter state on a groove-patterned surface using a microbalance. The results showed that when the maximum adhesion force is detected, the droplet base changes its shape from an ellipse to a circle. Because of the occurrence of a circular droplet base at the maximum adhesion, the authors claimed that the droplet at the maximum adhesion is in the most stable state and the corresponding contact angle is the most stable contact angle.14
4.2 Curved surface
The aforementioned studies were conducted on two-dimensional (2D) surfaces on the millimetric scale. To examine the effects of millimetric surface geometry (3D surface) on the most stable state, Zhu et al.16 measured the maximum adhesion force on curved surfaces (the side of a cylindrical surface), where a droplet behaves differently in the axial (along the cylinder ridge, observed from the side view) and azimuthal (along the perimeter of the cylinder cross-section) directions. At the maximum adhesion, the contact angles were found to be uniform along the droplet perimeter regardless of the cylinder diameter (radii of curvature, R S). This is because the contact angle reflects only the molecule-level interaction between the liquids and solids, which cannot be affected by the millimetric geometry of the cylinder. However, the droplet base is not circular at the maximum adhesion, partially opposing the prior statement that the most stable state of a droplet must be associated with an axisymmetric (circular) droplet base.36
On the other hand, the authors found the droplet base radius multiplying the sine of apparent contact angle (the angle between the liquid–vapor interface and the horizontal plane), r i sin θ i_a (i represents any location), are identical along the droplet perimeter. Then, the authors proposed a more generic definition of the most stable state of a droplet – that is, the vertical components of the surface tension force acting along the droplet perimeter are identical. This updated definition applies to both 2D and 3D surfaces.
To sum up, by studying the droplet adhesion on surfaces with heterogeneous microstructures (groove patterns) and asymmetric millimetric geometry (the sides of cylinders), the authors found an experimental link between the point at which the maximum adhesion force is detected and the most stable state of a droplet.14,36 Then, a generic definition of the most stable state of a droplet (or a bubble) using the adhesion measurement is proposed.
4.3 Micro-patterned surface
Since the maximum adhesion force corresponds to the most stable state of a droplet, it becomes a useful and reliable parameter that can be used to examine many fundamental questions – for example, the correlation between surface structure geometry and the effective length of the contact line.
The effective length of the contact line represents the contact line that effectively contributes to droplet adhesion. As mentioned previously, the effective length of the contact line (nl i) equals the droplet perimeter (2πr), with δ being 1 on an ideally flat surface. On textured surfaces, as the contact line exists only on solid surfaces (e.g. pillar tips) and deforms its shape depending on texture geometry, the effective length of the contact line can be either greater or less than the droplet base perimeter (δ can be larger or smaller than 1). However, the mechanism of how δ correlates with surface texture geometry remains unclear, leaving the prediction or control of droplet adhesion force challenging, as δ is an important parameter in Equation 2.
Motivated by this question, Jiang et al.37 measured the maximum adhesion force (F max) of droplets on pillared and pored surfaces with varying dimensions. Since F max, θ ms, ΔP and r are all measurable, δ can be calculated using Equation 2. On pored surfaces, the results showed that δ remains 1 (Figure 7). This indicates that pore textures, on which the contact line is continuous, do not affect the contact line shape or dynamics. On pillared surfaces, in contrast, the results showed that the ratio of the contact line length on a single pillar (l) to the pillar size (d) is roughly equal to π and 1 on sparsely (small size-to-pitch ratio, d/λ, where λ is the pitch) and densely (large size-to-pitch ratio) packed pillars, respectively (insert in Figure 7). l/d decreases with d/λ in between the two extremes. This indicates that pillar textures, on which the contact line is discontinuous, largely affect the shape of the contact line and its interaction with solid textures.
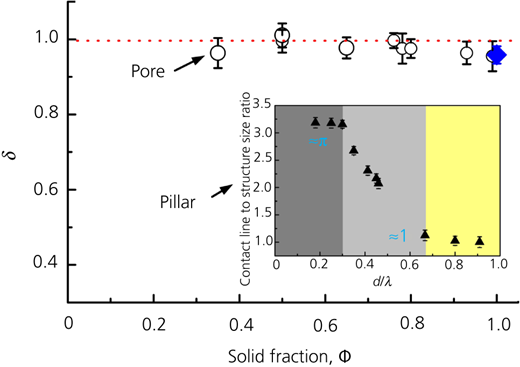
The measured ratio of the effective contact length to the apparent droplet perimeter (δ) is plotted with respect to the solid fraction of pored surfaces. Inset: the ratio of the contact line length to the pillar size is plotted against the size-to-pitch ratio (d/λ) of pillared surfaces (reproduced from the paper by Jiang et al.34 with permission)
The measured ratio of the effective contact length to the apparent droplet perimeter (δ) is plotted with respect to the solid fraction of pored surfaces. Inset: the ratio of the contact line length to the pillar size is plotted against the size-to-pitch ratio (d/λ) of pillared surfaces (reproduced from the paper by Jiang et al.34 with permission)
Benefiting from the precisely measured maximum adhesion force using the microbalance system, this study experimentally proved that the effective length of the contact line is affected by texture geometrical types (pillars against pores) and dimensions (sparsely against densely packed), paving the way for the prediction and control of droplet adhesion force using surface textures.
4.4 Surfaces with random roughness and heterogeneity
Figure 8 shows the maximum adhesion force as a function of the most stable contact angle. The experimental values were reported by Sun et al.7 for polymers, Sun et al.15 for methylated glass and three minerals (magnesite,35 hematite (unpublished) and alumina (unpublished)). Unfortunately, Samuel et al.6 did not include the data on maximum adhesion forces in their report, even if, in the authors’ opinion, the maximum adhesion forces and most stable contact angles are among the most important outcomes of force measurements with a microbalance. As can be concluded from Figure 8, the maximum adhesion forces are highly reproducible and they correlate with contact angles extremely well.
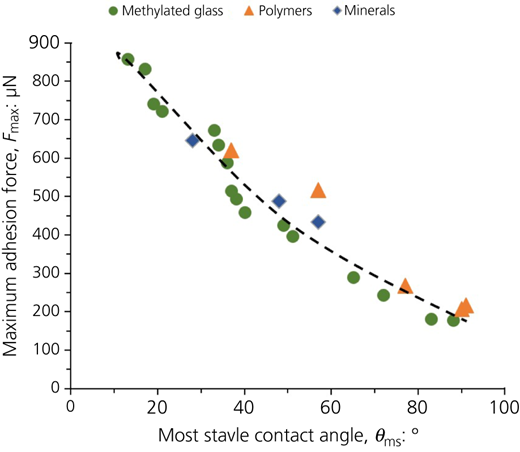
Maximum adhesion force as a function of the most stable contact angle. ‘Polymers’ include films of nylon, EVA, PET and PDMS reported by Sun et al.;7 ‘methylated glass’ refer to glass slides modified with trimethylchlorosilane;15 and ‘minerals’ include magnesite,35 hematite (unpublished) and alumina (unpublished). Broken lines are for guiding the eye
Maximum adhesion force as a function of the most stable contact angle. ‘Polymers’ include films of nylon, EVA, PET and PDMS reported by Sun et al.;7 ‘methylated glass’ refer to glass slides modified with trimethylchlorosilane;15 and ‘minerals’ include magnesite,35 hematite (unpublished) and alumina (unpublished). Broken lines are for guiding the eye
5 Pull-off force and pull-off contact angle
The forces and contact angles measured at the pull-off point are typically the least reproducible values in examination of adhesion of liquid droplets (gas bubbles) using a microbalance. As shown in Figure 2, after passing the point of maximum adhesion (E), further stretching of the attached droplet/bubble causes a continuation of the drop/bubble base pinning (although by using forces weaker than Fmax) and produces a decrease in the droplet/bubble base contact area. The distance between points E and F reflects whether the droplet/bubble separates from the substrate surface entirely (usually a very short E–F distance) or the droplet/bubble–substrate adhesion exceeds the droplet/bubble cohesion and the droplet/bubble first necks and then breaks, leaving a smaller droplet/bubble on the surface (always a long E–F distance). As a result, it can only be said that adhesion forces are bigger than cohesion forces but the value of the adhesion force cannot be even estimated. It happens quite often for water droplets in contact with hydrophilic surfaces, droplets in the Wenzel state and air bubbles with hydrophobic surfaces. Samuel et al.6 noticed the same effects in their measurements of pull-off forces. Despite this experimental problem, the authors concluded that there are good correlations between pull-off forces and both receding contact angle (θR; as measured independently) and its cosine function (1 + cos θR) (Figure 9). Since many results are of a questionable quality due to incomplete water droplet separation, additional systematic research is needed to confirm the correlations presented by Samuel et al.6Figure 9 also includes all data points for PDMS and its patterns published earlier.7,14 Additionally, an analysis of the pull-off forces for polymers, methylated glass and minerals studied in the authors’ laboratory would not confirm the correlations presented by Samuel et al.6 (not shown). In conclusion, the understanding of pull-off forces will require more studies with carefully selected solids having a limited affinity to probing liquids.
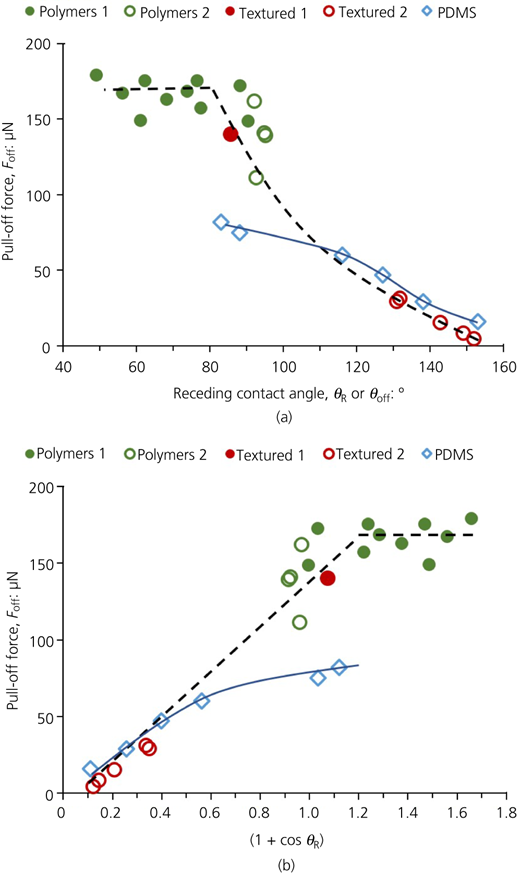
Pull-off force (a) as a function of the receding contact angle and (b) against (1 + cos θR). ‘Polymers 1’ and ‘polymers 2’ refer to molded plastic sheets, solution-coated polymer films, chemical vapor deposition polymerized polymer films and self-assembled monolayers on silicon wafers reported by Samuel et al.6 ‘Textured 1’ and ‘textured 2’ refer to patterned silicon pillars with hydrophobized surfaces as reported by Samuel et al.6 ‘PDMS’ is data for PDMS and its micro-patterned pores and pillars reported by Sun et al.7,14 Empty markers indicate clean separation of the water droplet from the solid surface, and filled markers are for experiments with imperfect separation. Lines are for guiding the eye over the data of Samuel et al.6 (broken) and Sun et al.7,14 (solid)
Pull-off force (a) as a function of the receding contact angle and (b) against (1 + cos θR). ‘Polymers 1’ and ‘polymers 2’ refer to molded plastic sheets, solution-coated polymer films, chemical vapor deposition polymerized polymer films and self-assembled monolayers on silicon wafers reported by Samuel et al.6 ‘Textured 1’ and ‘textured 2’ refer to patterned silicon pillars with hydrophobized surfaces as reported by Samuel et al.6 ‘PDMS’ is data for PDMS and its micro-patterned pores and pillars reported by Sun et al.7,14 Empty markers indicate clean separation of the water droplet from the solid surface, and filled markers are for experiments with imperfect separation. Lines are for guiding the eye over the data of Samuel et al.6 (broken) and Sun et al.7,14 (solid)
6 Constraints of the current set-up/instrument
The progress on measurements and interpretation of spreading, adhesion and pull-off forces could accelerate if the constraints of the current microbalance–camera system are addressed and improved. The following are suggestions that the authors would like to propose.
6.1 Loop holding droplet/bubble
The majority of research carried out in the past involved water droplets and air bubbles in water. The authors also used ethylene glycol,16–18 sodium chloride (NaCl) solutions (unpublished, σ LV is greater than that for water) and low-content ethanol solutions (unpublished, σ LV is less than that for water). The current fluid holder cannot grasp liquids with a surface tension below the surface tension of ethylene glycol (<46.5 mN/m) because these liquids tend to spread and climb on the holding ring. Design and manufacturing of holders with a hygrophobic ring surface could extend the research to a broader spectrum of liquids.
6.2 Extra optical view and recording
The measurements in systems involving two immiscible or partially miscible liquids, including oil-impregnated surfaces, could open new research opportunities with microbalance–camera systems. As briefly introduced in a previous review1 and supported by a few original results, using liquid substrates instead of solids eliminates concerns regarding surface quality such as roughness and inhomogeneity. A limitation of the current set-up is that the installed camera is incapable of viewing and recording the details of the liquid–liquid interface and liquid–liquid–vapor intersection from which contact angles can be measured, so important for interpretation of experimental data. The authors believe that installation of additional camera(s) with well-designed lighting would provide images of interfaces and junctions and provide much needed results on spreading and adhesion of liquid droplets over nearly ideal smooth and homogeneous liquid surfaces.
Besides the oil-impregnated surfaces, the solid substrate can be flexible, and the liquid surface tension force may cause the deflection of surface micro-textures, which would in return affect the adhesion force and the associated contact angles.38 However, the current optical system, which is designed to visualize the shape profile of an entire droplet (∼1 mm), cannot visualize the deflection of a small structure (from 10 to 100 μm) in a short time. Therefore, another camera focusing on the droplet boundary with a good spatial and temporal resolution is recommended.
6.3 Sensitivity to force values
It is believed for at least 30–40 years that Gibbs energy against apparent contact angle curves have multiple minima for a liquid on a heterogeneous and/or rough solid surface (Figure 10), in contrast to the curve for a smooth and homogeneous solid surface with only a single minimum. The liquid can be trapped in one of the metastable or stable states, and each energy minimum defines a stable geometry of the liquid, with a unique equilibrium contact angle that can be measured experimentally. For example, experimental advancing and receding contact angles are the highest and lowest metastable equilibrium contact angles, respectively. The transitions from advancing to the most stable and then receding contact angles must go through local energy barriers. There is very little experimentation that confirms the presence of the energy barriers and almost no experimental evidence for the point of the lowest Gibbs energy. The authors attempted to record the local minima and the energy barriers between advancing and receding most stable states (as defined conceptually by Figure 10) on a number of different micro-patterns, particularly on concentric ring-textured surfaces,18 but without any success. Fluctuations in force against position curves such as in Figure 2 were recorded, but the frequency and amplitude of the force curve suggest that they are nothing but results of mechanical vibrations of the system. Recording the presence and magnitude of energy barriers in transitions from advancing to receding contact angles could open a new chapter in studies of contact angles but might be possible only with more sensitive and stable microbalances.
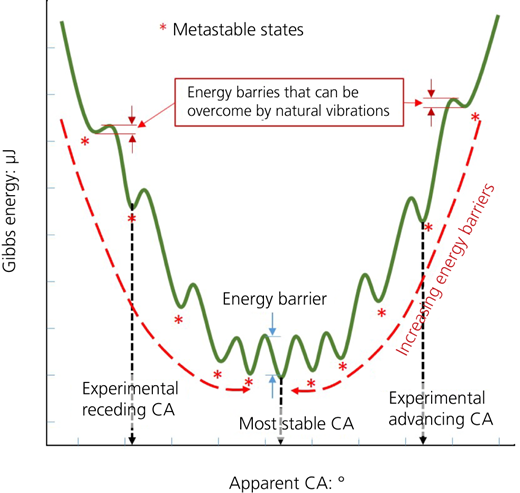
Gibbs energy for a liquid on a heterogeneous and/or rough solid surface in relation to apparent contact angle. CA, contact angle. Reused from the paper by Drelich1 with permission
Gibbs energy for a liquid on a heterogeneous and/or rough solid surface in relation to apparent contact angle. CA, contact angle. Reused from the paper by Drelich1 with permission
6.4 Vertical against lateral adhesion force
It should be noted that the droplet–surface interactive forces measured by the microbalance system introduced in prior sections are limited only to the vertical adhesion force. The vertical adhesion force represents the force required to detach a droplet vertically from a substrate, which contains the surface tension force acting along the three-phase contact line and the capillary pressure force acting on the entire droplet base (Equations 1 and 2). On the other hand, the lateral adhesion force (sometimes referred to as retention force) represents the force required to laterally move or de-pin a droplet, which contains only the surface tension force acting along the three-phase contact line, given as39
Here, the subscript ‘LA’ stands for lateral adhesion; r E represents the effective radius of the droplet perimeter, as the droplet base right before its lateral motion is typically not a circle;39 C is a numerical factor that depends on the shape of the droplet base and the distribution of contact angles along the contact line, which has been reported to be in the range from 1 to π;40 and θ min (close but not equal to the receding contact angle) and θ max (close but not equal to the advancing contact angle) stand for the contact angle at the droplet rear and front side, respectively. A more in-depth discussion regarding the variation of C can be found in a paper published by Tadmor.41
For applications that need to lateral move droplets rather than vertically detach droplets, – for example, droplet directional manipulation – measuring and understanding the lateral adhesion force is important. Although the configuration of the microbalance system introduced in Figure 1(a) cannot measure the lateral adhesion force, another microbalance system that utilizes the deflection of a beam with known mechanical properties can achieve this goal, as shown in Figure 11(a). The lateral adhesion forces on flat, textured and chemically heterogeneous surfaces have been measured as42–45
where E is the Young’s modulus of the beam material; W, T and L represent the width, thickness and length of the beam, respectively; and Δx is the measured beam deflection.
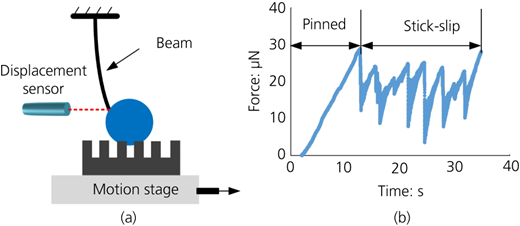
(a) Schematic diagram of a microbalance system that measures lateral adhesion force; (b) representative measured lateral adhesion forces on a pillared surface
(a) Schematic diagram of a microbalance system that measures lateral adhesion force; (b) representative measured lateral adhesion forces on a pillared surface
The two microbalance systems have their own unique advantages and disadvantages. Specifically, the vertically placed microbalance system can detect three meaningful apparent force values: spontaneous spreading force (F S), maximum adhesion force (F max) and pull-off force (F off). However, the vertical microbalance cannot reflect the microscopic effects of a specific defect/structure/pattern – for example, the jump of a contact line on a previously pinned pillar to another pillar. This is because the vertical adhesion force contains the capillary pressure force term (see Equation 2), which contains an apparent length scale of the droplet base area (πr 2). In contrast, the laterally placed microbalance system can detect the detailed dynamics of a contact line near a microstructure. For example, Pilat et al.43 and Feldmann and Pinchasik44 reported periodic fluctuation of the lateral adhesion forces, which corresponds to the periodic pinning and de-pinning stages of the microscopic contact line (namely, stick-slip behavior), as shown in Figure 11(b) (unpublished work). Nevertheless, the lateral adhesion force can provide only one apparent force value – the force required to move the droplet. In fact, this force may have two values;45 one can be interpreted as the static friction force and the other is the dynamic friction force.
Since the vertical and lateral adhesion forces are complementary to each other and their fundamental correlations and distinctions have not yet been fully understood, the authors encourage future works to examine the effects of surface properties on both the vertical and lateral adhesion forces and compare their difference.
7 Concluding remarks
The force curves generated by the microbalance–camera system during droplet (or bubble) attachment to a substrate, its spreading and detachment include three key pairs of force and contact angle values: (a) the spontaneous spreading force and spreading contact angle, (b) the maximum adhesion force and the most stable contact angle and (c) the pull-off force and the pull-off contact angle. Recording of force curves for both liquid droplets and gas bubbles on the same solid surface is rare but could provide better understanding of fluid spreading and adhesion under ‘dry’ and pre-wet conditions and for solid surfaces of varying geometry, micro-pattern, roughness and heterogeneity. Since the contact angles can be measured at well-defined states of fluid–substrate adhesive interactions, the values should be highly reproducible as compared with the values measured in traditional goniometry studies.
In this review, the authors discussed the scientific meanings of all three forces and their corresponding contact angles, particularly their fundamental correlation with surface properties. Specifically, models were derived to show that the spontaneous spreading phenomenon corresponds to the minimization of the Gibbs free energy of a droplet–substrate system. Therefore, the spreading force and spreading contact angle can serve as reliable parameters that quantify the surface properties regardless of surface geometry or liquids being used. The authors then explained how the droplet contact angle, when the maximum adhesion force is detected, is interpreted as the most stable contact angle. Most importantly, it was shown that a successful elaboration of the correlation between the texture geometry and contact line dynamics has been achieved by measuring the maximum adhesion force and the droplet shape profile simultaneously.
At last, the authors discussed the constraints of the current microbalance–camera system and possible directions of improvement, including the ring that holds a large variety of liquids, the spatial and temporal resolution of the optical system, the force sensitivity and the lateral adhesion force. The authors hope that this review provides a comprehensive explanation of the forces and contact angles measured by the microbalance–camera system and will stimulate further research with similar experimental set-ups.


Acknowledgements
Dr Jaroslaw Drelich would like to express appreciation to former visiting scholars from China including Dr Yujin Sun, Dr Donghui Wang and Dr Zhanglei Zhu and former undergraduate researcher Benjamin Gregory, for carrying all experimental work and contributing to the interpretation of the experimental results. His appreciation also goes to Prof. Chang-Hwan Choi from the Stevens Institute of Technology for fruitful collaboration on fabrication of micro-textured PDMS patterns that allowed to progress the science of wetting and adhesion beyond commonly available films of polymers and mineral specimens. Dr Youhua Jiang would like to thank the support provided by Basic and Applied Basic Research Foundation of Guangdong Province (China) Numbers 2021A1515110184, 2021B0301030005 and 2022A1515011214.

