

Studying the chemistry and morphology of metal surfaces of construction materials is important for quality control of products manufactured for the rocket and space industry, evaluation of their wear and tear and deciding whether to recycle or reuse them. Mass spectrometry imaging makes it possible to obtain information about the surface that is not available by other methods. Imaging of metal samples was carried out on a matrix-assisted laser desorption ionization with a time-of-flight mass spectrometry instrument. The samples were fixed in the recesses carved inside standard Bruker targets. Organic compounds on the metal surfaces of construction materials used in the rocket industry were studied by mass spectrometry imaging for the first time. The method allows control of the presence of components of various process fluids used in the manufacture and operation of rockets, including joint treatment with several substances. Mass spectrometry imaging showed the effectiveness of using washing agents to remove 1,1-dimethylhydrazine (rocket fuel component) and its transformation products from the surfaces. It is shown that mass spectrometry imaging is applicable to the study of organic substances on metal surfaces. Further development will allow greater control of the process of manufacturing and use of materials for the rocket industry.
1 Introduction
Construction materials for the rocket industry are important objects of study in modern materials science. Due to contact with the components of rocket fuel and substances used in material production (corrosion inhibitors, scaling inhibiting compounds etc.), the chemistry and morphology of the surface of construction materials undergo changes. The substances adsorb on the surface and undergo transformations. Mapping them is an important task, and mass spectrometry (MS) is an indispensable method in studies of this kind.1
Gas chromatography (GC)–MS is used to monitor the state of the International Space Station’s (ISS) surface and its degree of contamination with fuel and its transformation products. To study the interactions of construction materials with fuel components under space conditions, experiments were conducted in which the ISS was equipped with plates with model samples of the materials used.2 Similar experiments were conducted at the Russian orbital station Mir.3,4 In both cases, a large amount of nitrogen-containing compounds, including 1,1-dimethylhydrazine (unsymmetrical dimethylhydrazine (UDMH), a component of rocket fuel) transformation products, were detected in the extracts from the surfaces of exposed materials by GC–MS.
A limitation of GC–MS is that only volatile compounds can be analyzed. Desorption variants of MS, as well as high-performance liquid chromatography (HPLC)–MS, are used to identify non-volatile substances. Matrix-assisted laser desorption ionization (MALDI)–MS is used to study the surface chemistry of rocket fuel compartments.5,6 The surface is treated with silver halides (marker substances), after which a conclusion about the corrosion damage of the surface is made by the formation of clusters.
Mass spectrometry imaging (MSI) is a research method that makes it possible to obtain information about the distribution of substances over the surface. It combines the capabilities of determining the molecular composition of the surface and visualization of the objects being studied. Since the first MSI experiment was described,7 the method has become widely used, and several reviews of the features of its application have been published.8–10 Thin sections of biological tissues are generally the objects in studies involving MSI. The method makes it possible to study the distribution of drugs, peptides and proteins in tissues.11,12 Metal surfaces were also examined by MSI (in the laser desorption ionization (LDI) and secondary-ion MS (SIMS) variants), and metal ion distribution was studied.13,14 Along with profiling of the elemental composition (which can be done with an electron microprobe, without MS), the distribution of organic substances on metal surfaces must also be visualized, and this can be accomplished only with the use of MS. This is important, for example, in assessing the uniformity of protective coatings on metal product surfaces, as well as identifying the causes of their corrosive damage.5,6 However, the authors could not find any publications in which organic substances on the surface of metal alloys were studied using MSI. MSI can be performed using SIMS and LDI. SIMS provides better resolution, but ionization itself is not soft: labile compounds undergo considerable fragmentation.9 The use of LDI, particularly in the case of MALDI, allows imaging of a broad range of substances, including labile ones.
This work is devoted to the capabilities of MSI for studying the distribution of organic substances on metal surfaces and represents the first experience of using LDI–MS to solve this problem. Some construction materials used in rocket engineering were the research objects.
2 Experimental
2.1 Materials
Samples of aluminum (Al) alloys with 6% magnesium (Mg) by weight were used, as well as a rocket fuel sample – UDMH (Sigma, USA) – subjected to oxidative transformation in air for a long time (characterized by Karnaeva et al. 15). Etidronic acid – 1-hydroxyethane 1,1-diphosphonic acid (HEDP) (Sigma, USA) – and the morpholine salt of m-nitrobenzoic acid (corrosion inhibitor G-2M, KhimProm, Russia) were used as test compounds. These substances are used as washing agents and corrosion inhibitors in the process of manufacturing and operation of construction materials. It should be noted that many scientific groups in Russia and the Commonwealth of Independent States countries have conducted research on UDMH.16–19
All experiments were performed using a Bruker Ultraflex MALDI mass spectrometer (Bruker Daltonics, Germany), equipped with a nitrogen gas (N2) laser (λ = 337 nm, frequency = 200 Hz, spot diameter = 100 μm), a time-of-flight (Tof) mass analyzer and a reflectron. Plates made of AMg6 alloy (94% aluminum, 6% magnesium by weight) were used as samples of construction materials. The first extraction potential was held at 20 kV, and the second was 17 kV; the lens potential was held at 8 kV. Negative (in the study of acids) and positive (in the study of UDMH transformation products and morpholine) ions were detected in the range of 20–1000 Da. Self-developed software (Generator and MALDI2D programs) was used to collect mass spectra automatically by scanning the surface being studied and to process them in order to obtain visualization figures. Signal intensity normalization with respect to the total ion current was performed prior to drawing the MSI figures. The size of one pixel on MSI figures was 200 by 200 μm2, and the corresponding resolution was 130 dots per inch (DPI).
2.2 Characterization
Model samples were obtained by processing the plates with 0·5% solutions by weight of the corrosion inhibitors being investigated. A morpholine salt of m-nitrobenzoic acid (corrosion inhibitor G-2M) was used to wash the model sample that contacted with the oxidized UDMH.
To perform MSI, fragments no more than 1 cm2 in size were cut from the samples. These fragments were fixed in the recesses carved inside an MTP 384 steel target (Bruker Daltonics, Germany). The first extraction potential was held at 20 kV, and the second was 17 kV; the lens potential was held at 8 kV. Negative (in the study of acids) and positive (in the study of UDMH transformation products and morpholine) ions were detected in the range of 20–1000 Da. Self-developed software (Generator and MALDI2D programs) was used to collect mass spectra automatically by scanning the surface being studied and to process them in order to obtain visualization figures. Signal intensity normalization with respect to the total ion current was performed prior to drawing the MSI figures. The size of one pixel on MSI figures was 200 by 200 μm2, and the corresponding resolution was 130 DPI.
3 Results and discussion
For the LDI and MALDI–MS analysis, polished steel targets prepared in a special way were used, ensuring reproducibility of ionization, no noise and so on. The authors investigated the possibility of detecting organic compounds on the surface of real metal alloys – that is, non-model alloys that are used in any area. In the case of this study, these were alloys used to build fuel tanks for Russian launch vehicles and to contact rocket fuel components. Methodological features of carrying out ionization from oxidized metal alloys (decrease in sensitivity and resolution, a shift of the m/z scale) are described in the work.20 In the present work, two organic acids most commonly used as reagents for washing rust and rocket fuel transformation products from the surfaces of rocket fuel storage tanks – HEDP and m-nitrobenzoic acids (in the form of a morpholine salt, corrosion inhibitor G-2M) – acted as test compounds.
Signals with m/z 166 and 122 (referring to deprotonated [M–H]− and decarboxylated [M–COOH]− molecular ions of m-nitrobenzoic acid) were found in the mass spectra obtained in the study of standard G-2M solutions (negative ion detection). A deprotonated molecular ion with m/z 205 [M–H]− was detected in the mass spectrum of the standard HEDP solution. In both cases, ionization successfully proceeded in the absence of a matrix, since organic acids are generally prone to carboxyl group proton loss. When ionizing from a steel target, the detection limit of HEDP and G-2M was 10−8 M (about 10−12 mol/mm2) for both compounds. When ionizing from the real alloys, it appeared to be 100 times less, 10−6 M (about 10−10 mol/mm2).
To carry out MSI, two drops of G-2M solution (0·5%) were applied to a section of the alloy; a drop of HEDP solution (0·5% by weight) was also added to one of these drops. Concentrations of the solutions corresponded to those used in practice.21 An optical photograph of the test sample after drying is shown in Figure 1(a). Two spots with a diameter of about 2 mm, remaining from the described processing, can be seen. An MSI experiment was performed in order to demonstrate the ability of MSI to determine which spot corresponds to which compound. The results are shown in Figure 1.
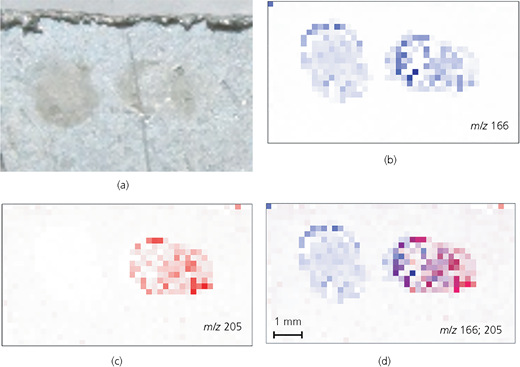
(a) Optical photograph of the section of the alloy treated with G-2M (both spots) and HEDP (the right spot) and the results of MSI: (b) distribution of the ion with m/z 166 (corresponds to the deprotonated ion of m-nitrobenzoic acid, [M–H]−); (c) ion with m/z 205 (corresponds to the deprotonated ion of HEDP, [M–H]−); (d) blue dots correspond to areas containing only the ion with m/z 166; the red ones, only the ion with m/z 205; and the violet ones, to areas containing both the ions. The intensity of the color is greater at points where the signal intensity in the mass spectra is higher
(a) Optical photograph of the section of the alloy treated with G-2M (both spots) and HEDP (the right spot) and the results of MSI: (b) distribution of the ion with m/z 166 (corresponds to the deprotonated ion of m-nitrobenzoic acid, [M–H]−); (c) ion with m/z 205 (corresponds to the deprotonated ion of HEDP, [M–H]−); (d) blue dots correspond to areas containing only the ion with m/z 166; the red ones, only the ion with m/z 205; and the violet ones, to areas containing both the ions. The intensity of the color is greater at points where the signal intensity in the mass spectra is higher
The distribution of the ion with m/z 166 (Figure 1(b)) coincides with the contours of both spots, which means that the m-nitrobenzoate ion (the component of G-2M) is contained in both spots. However, the ion with m/z 205 distribution (Figure 1(c), deprotonated HEDP ion) repeats the contours of only one of the spots (the right one). Figure 1(d) allows visualizing the distribution of G-2M and HEDP over the surface. The blue dots correspond to areas containing the ion with m/z 166 only; the red ones to areas containing the ion with m/z 205 only; and the violet ones to areas containing both ions. In this case, the spots with a higher signal intensity in the mass spectra have a higher color intensity. Thus, MSI makes it possible to detect reliably the facts of surface treatment by these compounds, including when they are used together. Using the proposed approach makes it possible to control the uniformity of application of these substances to the manufactured products, as well as the stability of the layer during operation (when they are used as corrosion inhibitors).
The experimentally established limit of detection for m-nitrobenzoic acid and HEDP is 10−6 M, while informative distribution patterns can be obtained for surfaces treated with 10−5 M solutions. This concentration is 2500-times lower than that used in the treatment of real surfaces (0·5% solutions by weight are used, which correspond to 0·025 and 0·03 M for HEDP and m-nitrobenzoic acids, respectively).
In this work, the authors investigated model surfaces of alloys that contacted with oxidized rocket fuel (UDMH). This rocket fuel was drained from the fuel tank and left in the air, as a result of which it was oxidized. Samples of the alloys were fully held in UDMH subjected to oxidative transformation. It should be noted that a region on which the stain of contamination was clearly visible was chosen for the study. This localization is apparently connected with poor-quality washing of the tank. Weak spots could be seen in some other parts of the tank. These parts were used for the experiments. The spots darkened when exposed to UDMH, which is apparently associated with local oxidation. The sample was dried in air. Then, the sample was introduced into the device without additional preparation. After that, metal samples were studied. Locally contaminated areas were sawed out, and MSI was performed on them. Figure 2(a) shows an optical photograph of one of the fragments studied. The brown border on it delineates the spot of contamination. MSI was performed, and the ion with m/z 130 distribution is shown in Figure 2(b). This ion corresponds to the protonated ion of dimethylhydrazono-dimethylamino acetaldehyde, one of UDMH transformation products.21 The contours of the obtained distribution repeat the contour of the contamination spot in the optical photograph, which confirms that the spot being investigated is actually formed by the UDMH transformation products. Some other ions have a similar distribution pattern over the surface, including an intense ion with m/z 74 (corresponding to dimethylformamide – another UDMH transformation product).22 At the same time, for a number of intense ions, the distribution differs significantly from that seen in optical photography. This means that these ions correspond to compounds that have appeared on the surface not due to contamination.
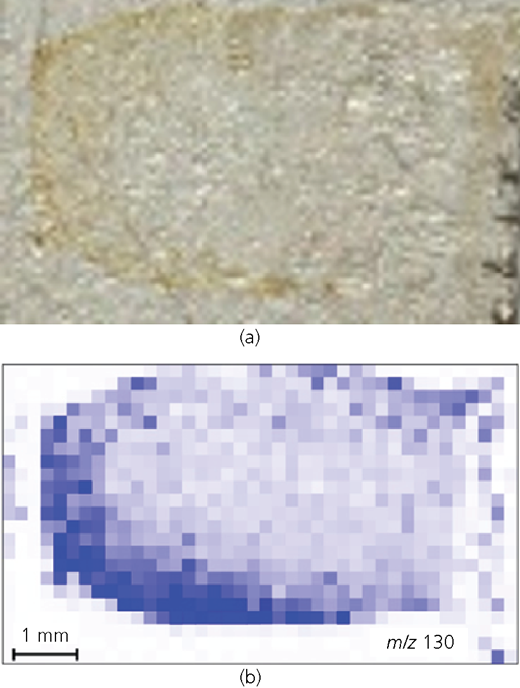
(a) Optical photograph of the model sample of the alloy in contact with rocket fuel subjected to oxidative transformation and (b) the result of MSI, the ion with m/z 130 distribution pattern (positive ion, corresponds to the protonated ion of dimethylhydrazono-dimethylamino acetaldehyde, the UDMH transformation product)
(a) Optical photograph of the model sample of the alloy in contact with rocket fuel subjected to oxidative transformation and (b) the result of MSI, the ion with m/z 130 distribution pattern (positive ion, corresponds to the protonated ion of dimethylhydrazono-dimethylamino acetaldehyde, the UDMH transformation product)
Comparison of the substance distribution patterns makes it possible to obtain one more criterion for increasing the reliability of identifying compounds on contaminated surfaces. A common approach to the study of such objects is to wash off the contamination with an organic solvent, followed by extract analysis by HPLC–MS.23 In this case, the total content of substances on the entire washed surface is determined, and some of the detected substances may be incorrectly assigned to components of the spot being investigated. The use of MSI prevents this mistake: a substance distributed differently from the main contamination cannot be a component of this pollution and is apparently brought to the surface in some other way.
The composition G-2M, the main component of which is the morpholine salt of m-nitrobenzoic acid, is used to wash UDMH and its transformation products from the surfaces of tanks in which rocket fuel is stored.21 However, to confirm the effectiveness of this procedure, thermal desorption MS is used,24 which evaluates only the overall decrease in the content of UDMH and its transformation products over the whole surface. At the same time, it is of interest to estimate the efficiency of this washing from the areas of surfaces damaged mechanically or due to corrosion.
An experiment was performed to assess the effectiveness of the applied technology: the right part of the fragment of the tank shown in Figure 2(a) was treated with 0·5% by weight solution of G-2M, while the left part was kept unchanged for monitoring. Visually, it was observed that the color of the spot in the right, processed part of the investigated fragment became less intense, which indicates that some of the contamination components were actually washed off the surface. However, it is impossible to determine visually whether the UDMH transformation products were washed off. MSI was carried out for this purpose. For this experiment, another fragment of the same fuel tank with a similar spot was used. The distribution of the main UDMH transformation product with m/z 130 is shown in Figure 3(a); distribution of the ion with m/z 74 is the same. It can be seen that their content in the right, processed part of the fragment is much less. This confirms that G-2M actually allows removal of UDMH transformation products from the surfaces of contaminated reservoirs. The distribution of G-2M was monitored by the presence of a positive morpholinate ion with m/z 88. An anion of m-nitrobenzoic acid was not used, because this would require two consecutive scans of the sample (first for positive ions, then for negative ones), which is undesirable: the layer of the investigated alloys is partially destroyed during scanning, which may decrease the reliability of the information obtained. The distribution of morpholinate ion with m/z 88 is shown in Figure 3(b); it is predominantly distributed in the right part of the sample treated with G-2M. It can be concluded that the washing composition removed the UDMH transformation products from the surface, leaving a protective film of m-nitrobenzoic acid morpholinate (which is implied by the method of using G-2M). The mutual distribution of ions with m/z 130 and 88 over the surface is shown in Figure 3(c). The blue dots correspond to the areas containing only an ion with m/z 130; the red ones to areas containing only an ion with m/z 88; and the violet ones to areas containing both the ions. The untreated section has not undergone any changes, while the right, treated section is cleaned of UDMH transformation products and coated with a film of m-nitrobenzoic acid morpholinate. At the same time, the right edge of the sample was cleaned the least (a large number of blue and violet dots can be seen in Figure 3(c)). This is because the sample was sawn along this edge, and its surface has the largest number of structure defects. Due to the more developed surface morphology, this area requires a longer processing time to clean the UDMH transformation products from it than the neighboring smooth ones. Thus, MSI makes it possible to study the specific features of the process of washing metal surfaces and to evaluate the effect of surface morphology on the completeness of washing.
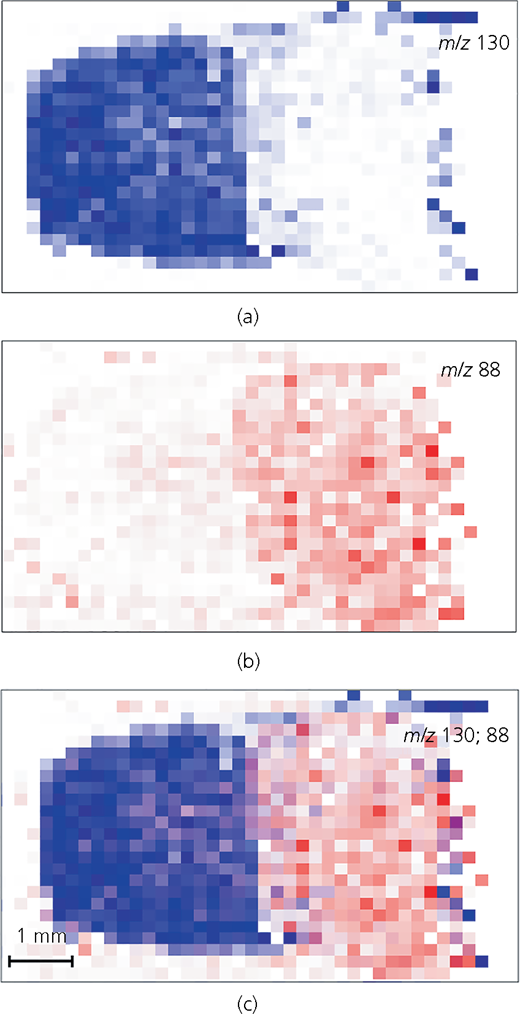
MSI of the model sample of the alloy in contact with rocket fuel subjected to oxidative transformation after washing its right side with G-2M: (a) Ion with m/z 130 distribution (corresponds to the UDMH transformation product); (b) ion with m/z 88 (corresponds to protonated morpholine ion, a component of G-2M); (c) blue dots correspond to areas containing only the ion with m/z 130; the red ones to areas containing only the ion with m/z 88; and the violet ones to areas containing both the ions
MSI of the model sample of the alloy in contact with rocket fuel subjected to oxidative transformation after washing its right side with G-2M: (a) Ion with m/z 130 distribution (corresponds to the UDMH transformation product); (b) ion with m/z 88 (corresponds to protonated morpholine ion, a component of G-2M); (c) blue dots correspond to areas containing only the ion with m/z 130; the red ones to areas containing only the ion with m/z 88; and the violet ones to areas containing both the ions
4 Conclusions
The authors have developed a method for controlling surface contamination on the fuel tanks of Russian launch vehicles. The method will be useful for controlling the processes of decomposition of the fuel system after draining the tanks and monitoring the environmental situation around the spaceport. Organic substances on the metal surfaces of construction materials were studied for the first time using MSI. It should be noted that the technology makes it possible to study such samples without any specific and complex sample preparation. The method allows controlling the presence of components of various process fluids used in the manufacture and operation of rockets, including joint treatment with several substances. In addition, the prospects of using MSI to study the technological features of using agents for washing the remains of rocket fuel and its transformation products from the surfaces of construction materials are shown. The authors are confident that the proposed method can be used to study other metal materials used in production.
Acknowledgements
This work was performed on the equipment of the Center for Collective Use of the Institute of Physical Chemistry of the Russian Academy of Sciences, with the financial support of Program 1.8 RAS. The authors would like to thank Alexey Starichenkov for help in photographing the samples.

