The purpose of this paper is to use SERVQUAL to measure Generation Y’s (Gen Y) perceived service quality and its effects on their satisfaction toward the Malaysian hotel industry.
The required data were collected through questionnaire, distributed to 200 respondents in four areas of Klang Valley. The collected data were put through multiple regression to identify the effect of SERVQUAL dimensions on service quality.
The results reveal that all the elements of SERVQUAL, except tangibility, had a significant and positive relationship with customer satisfaction.
It is a niche area research which is done on a small population in a specified geographical area within Malaysia, though its research implications are significant and add significantly to the tourism literature with respect to Gen Y.
This research holds importance in the growing service tourism and hoteling industry in Malaysia, where Gen Y holds a key economic position and is predicted to grow even further in the near future.
It is a niche area research done on very specific consumers in Malaysia. It, therefore, adds to the emerging field of tourism in relation to Gen Y.
Introduction
Global market trend has been changing remarkably in favor of services sector, with businesses striving to provide their best service quality to satisfy their customers. This is highly evident in the hotel industry (Rao and Sahu, 2013). Malaysia aims to become a developed nation by 2020 and tourism is one of its key economic factors to achieve this aim (Roslan et al., 2015). In such a tourism-oriented country, the hotel industry should naturally be one of the most rapidly growing service industries (Huijun et al., 2015). Evidently, travel and tourism have been contributing greatly to Malaysia’s economy with a direct contribution of RM 61bn (5.7 percent of GDP) in 2014, and is forecasted to increase until 2025 (Huijun et al., 2015; Turner, 2015). In this regard, the domestic travelers within Malaysia are also found to be the key economic drivers in this sector (Rao and Sahu, 2013).
Generation Y (Gen Y) is a cohort born after Generation X (San et al., 2015) roughly between 1980 and 2000 (Cavagnaro et al., 2018); some put the period between 1978 and 1994 (Kelan and Lehnert, 2009; San et al., 2015; Skinner et al., 2018) or even 1980 and 1994 (Thambiah et al., 2015; Monaco, 2018). They are also referred to the millennials (Kelan and Lehnert, 2009; Monaco, 2018), dot.com generation, echo boomers and millionaires (San et al., 2015). By 2030, this generation will comprise 75 percent of the total global workforce (Naim and Lenkla, 2016; Cavagnaro et al., 2018). Thambiah et al. (2015) reported that Gen Y in Malaysia accounts for 35 percent of the total population and is thus considered the largest segment (San et al., 2015). This generation is also taking over the retiring Baby Boomers from the workforce in Malaysia, making it the largest consumer segment in the near future (Madden and Wan Azmi, 2015). It is regarded as a vital consumer segment by the Prime Minister of Malaysia (2013–2018) Datuk Seri Najib Tun Razak (Gasper, 2014). They have high buying power (San et al., 2015), have different societal values (Sa’ari and Koe, 2014), as well as different personalities, attitudes, behaviors and work values (Naim and Lenkla, 2016), and hence should not be ignored in consumer behavior studies (Sa’ari and Koe, 2014).
Gen Y (and Gen Z) are “travelers of the future” which will take approximately 320m international trips by the year 2020 (Monaco, 2018, p. 8; Cavagnaro et al., 2018). It is for this reason that they have an especially dedicated name to them – “youth travelers” (Cavagnaro et al., 2018). Some statistics further this claim: 23 percent of the tourists in 2015 were aged between 16 and 29; one-third of all the hotel guests belonged to millennials; and youth tourism is estimated to reach $400bn by 2020 (Cavagnaro et al., 2018). They are, therefore, also regarded as “natural travelers” (Cavagnaro et al., 2018, p. 33). These generations do not see tourism and leisure time as an appendix to life, but rather an indispensable component of life, says the same source, and seconded by Monaco (2018). They make four to five trips a year and they intend to do so even when they get older (Cavagnaro et al., 2018). This trend is also very evident in Malaysia where Gen Y is the largest chunk of Malaysian population which travel the most (Sia et al., 2017). With greater access to technology, products and services, Gen Y expects more quality in services which has resulted in an increase in targeted services for them (Sahivaara, 2015). Hence, it is highly crucial for the hotel industry to be able to capture the market share of Gen Y (Forozia et al., 2013), who are expected to hold the most purchasing power soon in global scale, in order for the hotels to be competitive and successful in the market in the near future (Cavagnaro et al., 2018).
In a tertiary sector such as the hotel industry, service quality is acknowledged as a crucial factor (Kim-Soon et al., 2014). This is due to assumptions made in many service industries that high service quality leads to high profit (Presbury, 2009). The SERVQUAL model has been developed, tested and adapted in numerous research works in the service industry (Gržinić, 2007) to evaluate customer’s perceptions and identify the relationship between perceived service quality and customer satisfaction (Aleshaiwy, 2015). This study also used the SERVQUAL model to find Gen Y’s perceived service quality of Malaysian hotel industry, with the following research objectives:
To identify the factors that have a significant impact on Gen Y’s customer satisfaction toward the hotel industry in Malaysia.
To evaluate the importance of each factor in SERVQUAL in understanding Gen Y’s customer satisfaction toward the hotel industry in Malaysia.
Literature review
Service quality and the SERVQUAL model
Due to services’ multi-dimensional and subjective nature, measuring its quality is difficult in comparison with tangible product qualities (Giannakos et al., 2012). With rise in services industry, examining service quality has become a necessity. This SERVQUAL model is a multi-dimensional instrument which is known as one of the most successful tools for measuring service quality. Originally proposed by Parasuraman et al. (1985) in ten dimensions of service quality, Parasuraman et al. (1988) simplified the model with only five dimensions: tangibility, reliability, responsiveness, assurance and empathy (Presbury, 2009; Giannakos et al., 2012; Kim-Soon et al., 2014). It finds customer’s perceptions and expectations of the service provided and identifies specific factors that significantly influence the outcome of the service provided (Presbury, 2009). In order to achieve high satisfaction level of customers, service providers are required to reduce the gap between customer’s expectations and the actual service being provided.
SERVQUAL is the most popular model in use for measuring service quality and customer satisfaction in service industries (Roslan et al., 2015; Gencer and Akkucuk, 2017). It is valid, reliable and is widely applicable across organizations in service sector; and much widely used than other competing models (Munusamy et al., 2010; Gencer and Akkucuk, 2017). SERVQUAL is very generously used in studies pertaining to hospitality and tourism sectors (Pizam et al., 2016). It not only tells about the quality of service being offered, but is also helpful in identifying the gap between what the service providers give and what the customers think they receive (Weitz and Wensley, 2002). It is also helpful in estimating the perceptual gap between what customers expect and what they perceive they actually receive (Pikkemaat and Peters, 2006). But SERVQUAL has also been criticized for several reasons: for example, whether it is generally applicable across all service industries, especially when service provided highly depends on who provides it, and when and where it is provided. Moreover, the items in the original SERVQUAL model need to be adapted according to the context (Haghighat, 2017). SERVPERF is the second closest after SERVQUAL to measure service quality (Gencer and Akkucuk, 2017). It uses only the performance component, without matching it with expectations as used in SERVQUAL. It demonstrated better variance, utilized less time in answering the questions as there are lesser questions, but is criticized for unidimensionality (Gencer and Akkucuk, 2017). However, there are opinions advocating using SERVQUAL to measure service quality, since quality is often user defined (Roslan et al., 2015).
SERVQUAL has five dimensions, which are elaborated below:
Tangibility: this is the physical aspect of the service, which includes the physical facilities, service provider personnel, the equipment and the materials used to communicate with customers (Presbury, 2009; Giannakos et al., 2012). Application of tangibility factor differs from one industry to another (Aleshaiwy, 2015). From the perspective of the hotel industry, tangibility factor includes the hotel’s equipment, facilities and employees’ appearance.
Reliability: this refers to the ability to perform the promised service consistently and dependably (Presbury, 2009; Giannakos et al., 2012). On-time fulfillment of promises is recognized as very crucial for the hotel industry. Inability to fulfill promises leads to customers’ negative emotions which potentially creates a negative corporate image for the hotel. This dimension almost always has a very significant influence on customer satisfaction, and is a source of competitive advantage (Aleshaiwy, 2015).
Responsiveness: this refers to service provider’s willingness to assist or help customers through providing a prompt and accurate service (Presbury, 2009; Giannakos et al., 2012). From the hotel industry perspective, it refers to hotel employees and is often recognized as another crucial element of hotel service quality. This is because the hotel employees are expected to respond to guests’ needs and requests in a timely manner (Aleshaiwy, 2015).
Assurance: it refers to the service provider’s understanding and courtesy and also includes service provider’s ability to provide their confidence and trust as they engage with customers and perform service (Presbury, 2009; Giannakos et al., 2012). Hotels are highly required to instill confidence into their guests in order to ensure they feel secure while staying. This dimension also has a significant influence on guests’ satisfaction (Aleshaiwy, 2015).
Empathy: this refers to the service provider’s understanding the needs of each individual customer, as well as performing service with a caring attitude toward the customer (Presbury, 2009; Giannakos et al., 2012). From the hotel industry perspective, this dimension involves high level of communication in order to understand the guest’s needs to be able to provide maximum attention to the guest. Although many hotels may provide guests other facilities, but hotel employees’ inappropriate behavior often dissatisfies the guests (Aleshaiwy, 2015).
For operationalization purposes, these terms are defined in Table I (Roslan et al., 2015, p. 459).
Customer satisfaction
It is stated that Professor Philip Kotler was the pioneer of creating the term customer satisfaction which can be applied in various business and marketing contexts. Kotler et al. (2017) defined customer satisfaction as the customer’s feelings of pleasure or disappointment which are generated after comparison of perceived performance of service and quality of actual service delivered (Forozia et al., 2013; Kim-Soon et al., 2014). It is the evaluation of customer’s experience of the service provided. This evaluation is also based on a comparison of customer’s pre-purchase perceptions and expectations and the actual services delivered (Rao and Sahu, 2013). Therefore, satisfaction is found when services provided fulfill the needs of customers, while dissatisfaction is a result of service provider’s inability to perform the customer’s expected services (Kim-Soon et al., 2014).
Customer satisfaction has been identified as one of the key success factors for service industries. The multi-dimensional service nature has a direct relationship with customer satisfaction (Azmian et al., 2012). In the hotel industry, the service provided involves mixed attributes of tangible products and perishable services – hence customer satisfaction in the hotel industry is formed upon both products and services provided (Forozia et al., 2013). But service quality is surely related to customer satisfaction (Munusamy et al., 2010; Roslan et al., 2015) such that often a direct relationship is found between these two.
Research methodology
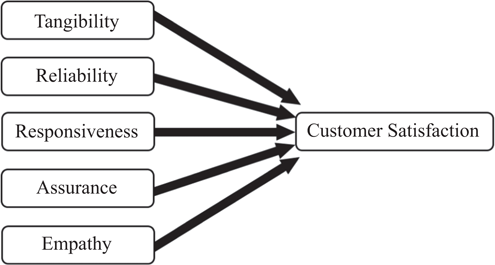
Figure 1 depicts the relationship between the five dimensions of SERVQUAL (the independent variables) and customer satisfaction (the dependent variable).
Hypotheses
The following hypotheses were developed based on the literature cited above:
Service quality significantly influences Gen Y’s satisfaction toward Malaysian hotel industry.
Tangibility of the services significantly influences Gen Y’s satisfaction toward Malaysian hotel industry.
Reliability of the services significantly influences Gen Y’s satisfaction toward Malaysian hotel industry.
Responsiveness of the staff significantly influences Gen Y’s satisfaction toward Malaysian hotel industry.
Assurance of the staff significantly influences Gen Y’s satisfaction toward Malaysian hotel industry.
Empathy of the staff significantly influences Gen Y’s satisfaction toward Malaysian hotel industry.
Research methodology
The type of study and research problem (Tull and Hawkins, 1987) and the research objectives (Cooper and Schindler, 2008) determine the method for data collection. The research in hand is formal, communicative, descriptive, cross-sectional, statistical and involves field research, thus survey method suits data collection, within which a closed-ended, self-administered questionnaire was distributed targeting Gen Y (Bryman, 2016).
The questionnaire developed for this research was adapted from Kim-Soon et al. (2014), with few amendments made in order to suit this research (see Table AI). The modifications were primarily grammatical and sentence structure. Past tense was used in the sentences to match the context since only those customers were contacted who had already had the service experience. At some places the helping examples were changed to better explain the meaning. In all these changes, it was ensured that the meaning of the questions remains the same. The questionnaire consisted of three parts: first contained filter and demographic questions which aimed to accept responses only from the appropriate respondents. The second part sought answers regarding the service quality of the Malaysian hotel industry. This part constituted the five dimensions of SERVQUAL, measured on a five-point Likert scale (Cooper and Schindler, 2008; Sekaran and Bougie, 2010), where 1 represented “strongly disagree” and 5 represented “strongly agree.” The third part of the questionnaire sought responses on customer satisfaction on a five-point Likert scale, where 1 represented “very poor” and 5 represented “excellent.” This part was also modified to suit the context in hand (see Table AII). Similar care was taken not to change the meaning of the statements while such modifications were done.
Sampling method and frame
Non-probability, judgmental sampling (also known as purposive sampling) was adopted which requires the researcher to approach specific targeted respondents who are judged appropriate to provide the necessary information (Malhotra, 2007; Bryman, 2016). Geographic areas were specified to distribute the questionnaire. Klang Valley was chosen due to its strategic location and population diversity that makes it the cultural, technological and economic hub of Malaysia. Four key areas – Gombak, Klang, Ampang and Petaling Jaya – were selected to represent Klang Valley’s North, South, East and West, respectively, as well as to minimize biasness (Azmian et al., 2012). We distributed 400 questionnaires in the above-mentioned places and aimed to collect a minimum of 200 responses. Such sample size was deemed sufficient to represent Malaysian Gen Y hotel industry population (Sekaran, 2003; Sekaran and Bougie, 2010; Azmian et al., 2012). About 40 percent of the total Malaysian population belongs to Gen Y (San et al., 2015). Saunders and Lewis have also suggested that minimum 200 respondents in business research are adequate. This is further supported by another filter that the authors put which was to ensure that the potential respondents had stayed in a four- or five-star hotel in Malaysia within the past one year. Hence, putting these two conditions together, 200 respondents are deemed adequate. Furthermore, special care was also taken to ensure an equal representation of males and females in the survey. Respondents were contacted primarily in educational institutions and shopping malls. This exercise continued for a period of one week. We confirmed that the respondents were in the age range of 16–35 years old.
Analysis, results and discussion
Missing data are a serious problem in data analysis (Tabachnick and Fidel, 2001; Kline, 2011). Although many of the statistical software do account for ways of solving this problem, yet it becomes problematic. Hence, scholars (see e.g. Roth, 1994; De Vaus, 2001; Schafer and Graham, 2002; Kline, 2011) recommend taking special care in developing, distributing and collecting the questionnaires. Keeping in line with the suggestions, the questionnaire was administered by the researcher, hence there were no rejected or false entries and all the 200 questionnaires were usable. Table II shows the demographics of the respondents.
Majority of the respondents (40.5 percent) fall into the 21–25 years old category, while the 16–20 years old constituted the smallest percentage (15.5 percent).
Reliability
In order to establish the internal consistency among the items of the questionnaire reliability tests are applied (Sekaran, 2003; Ponbamrungwong and Chandsawang, 2009). Reliability coefficient, or Cronbach’s α, values range from 0 to 1, where a value close to 1 means higher internal consistency and close to 0 means lower reliability (Ponbamrungwong and Chandsawang, 2009). Table III shows the reliability coefficients of the constructs used.
All the values fall within the acceptable range of Cronbach’s α, hence the constructs are reliable. The score of tangibility was the lowest (α=0.597), yet it is not dropped as per the suggestions of Ponbamrungwong and Chandsawang (2009) and owing to the importance of this construct.
Correlation test
Pearson’s correlation is the coefficient used to measure the association of the independent variables with the dependent variable (Sekaran, 2003; Pallant, 2007; Ponbamrungwong and Chandsawang, 2009). The coefficient values range from 0 to 1, where values near to 1 indicate a strong correlation, while those near to 0 indicate a week correlation (Ponbamrungwong and Chandsawang, 2009). The correlation values are depicted in Table IV.
As shown, all the independent variables in the questionnaire have a positive and strong correlation with the dependent variable (customer satisfaction). Assurance has the highest correlation (r=0.714), followed by reliability (r=0.706), tangibility (r=0.672), empathy (r=0.636) and responsiveness (r=0.607).
Multiple linear regression
After establishing the reliability of the items and confirming a correlation between the independent and the dependent variables, the next step was to establish whether or not, and by how much, are the independent variables predictive of the dependent variable. This was done through multiple linear regression (Ponbamrungwong and Chandsawang, 2009), which allows researchers to quantify the impact of various simultaneous influences upon a single dependent variable (Pallant, 2007).
As Table V shows, the overall p-value for the model is below the cut-off value for significance, hence confirming the model fit. This model is able to explain 63.2 percent of the variance which is satisfactorily high. In individual dependent variable terms, tangibility had the highest impact (p=0.000; b=0.267), followed by assurance (p=0.001; b=0.193), reliability (p=0.024; b=0.131) and empathy (p=0.004; b=0.107). Responsiveness (p=0.975; b=0.002) could not surpass the significance test as its p-value was beyond the minimum cut-off point.
Discussion
As the overall p-value for the model is significant (see Table V), hence it is safe to conclude that this model has a predictive validity in finding the influence of service quality on Gen Y’s satisfaction toward Malaysian hotel industry. Thus, H1 is accepted. This study supports previous empirical findings on the relationship between SERVQUAL and guest satisfaction (Jones et al., 2007; Hu et al., 2009; Li and Krit, 2012; Saghier, 2013). Therefore, it implies that the higher level of service quality can lead to greater satisfaction which ultimately leads to higher success in Malaysian hotel industry as it will increase the chances to generate and maximize sales revenue. At the same time, higher level of satisfaction of Gen Y will help the hotel industry to increase the retention rate of old customers, help to build word of mouth and increase the referral for new customers. Indeed, service quality is crucial and hotel management should put emphasis on it.
This study also found positive and significant relationship between tangibility (p=0.000; b=0.267), reliability (p=0.024; b=0.131), assurance (p=0.001; b=0.193), empathy (p=0.004; b=0.107) of SERVQUAL and Gen Y’s satisfaction toward Malaysian hotel industry, with the exception of responsiveness (p=0.975; b=0.002), which was found insignificant. Responsiveness is related to the timeliness of the services delivered by hotel management. This study captures responsiveness based on the exact time when the service will be provided, the willingness of the hotel staff to provide service and the special care. Our results reveal that Gen Y does not concern much about the timeliness of the services; however, it puts much emphasis on the quality of services provided by the hotel management. This result is context specific and might change in another context. Yet tangibility, reliability, assurance and empathy are more important in Malaysian Gen Y’s satisfaction toward the hotel industry.
Our study also reveals that Gen Y in Malaysia is more concerned about the equipment and the facilities of the hotel. The visual appeal of the hotel increases their level of satisfaction. These results can be generalized in other contexts. Hence, the synergy between the tangible and intangible assets highly improves the satisfaction level of Gen Y in Malaysian context. As long as the employees are well known about the service that the hotel is offering, then the level of service quality will increase and the employee will produce higher level of assurance which positively increases the level of satisfaction. In sum, these practices will also improve the empathy of hotel management, which is very much important to the Gen Y’s satisfaction toward Malaysian hotel industry.
Conclusions and recommendations
This research was conducted to understand and determine the effect of Gen Y’s perceived service quality on their satisfaction toward the Malaysian hotel industry. It can be concluded that this study provided sufficient evidence to use SERVQUAL to understand Gen Y’s satisfaction toward Malaysian hotel industry. It was found that all SERVQUAL dimensions strongly correlate to customer satisfaction, while four of these dimensions (tangibility, reliability, assurance and empathy) have significant influence on customer satisfaction. This study is conducted on multiple locations in Malaysia to get higher generalizability of the results. Although few cultural differences prevail for location differences, therefore, future study could attempt to investigate how the perception of Gen Y differs in terms of location. It will enhance the understanding and create profound insights in the SERVQUAL literature.
Service quality is termed as one of the key determinants to differentiate one hotel from another (Kim-Soon et al., 2014). In a tourism-oriented country with increasing purchasing power of Gen Y, it is crucial to understand the perceived service quality of Gen Y, who is believed to hold the most purchasing power soon. Thus, it is highly crucial for hotel industry to understand the factors and their extent of perceived service quality in order to give them the best available service and to improve it even more. Hence, it is very important to identify which dimension of service quality is to be focused for their guests. This tool also allows hoteliers to objectively decide about their marketing positioning, and assists them in identifying where marketing efforts are lacking.
Limitations and future research
This research was conducted in Malaysia and constituted distribution of questionnaire within selected regions of its Klang Valley. Although this data collection method had been reliably practiced in the past (Azmian et al., 2012), it is always a possibility that the collected sample may not be an accurate reflection of the entire Malaysian Gen Y. This is because few cultural differences prevail for location differences. Moreover, Malaysia is a multiracial country with Malays, Chinese and Indians as the three main races. Our sample was not a true representative of these races. Furthermore, 200, though statistically adequate, is still a small number as per the contemporary research purposes. Hence, it is recommended to replicate this study on a grander scale to get more generalizable results. Therefore, a future study could attempt to investigate deeper how location and racial differences influence Gen Y’s perception of service quality. Another avenue to research is a comparative investigation between Gen X, Gen Y and the emerging Gen Z.
This study only captures data from guests of four- and five-star hotels. Gathering data from multiple category hotels might give results different than ours, especially in terms of generating validity for the tangibility factor. Another aspect of further research is conducting similar study in other tourist-frequent parts of the country such as Langkawi or Perhentian Island where a higher number of foreign tourists are found to reveal other patterns of relationships and possibly different insights. Future research also could consider multiple types of mediating and moderating factors such as money attitude and materialistic behaviors between SERVQUAL and customer satisfaction. Potential future research could also consider factors that negatively affect the satisfaction of hotel guests.