Understanding the impacts of climate on tourism has evolved since the late 20th century, shifting from one-dimensional and partial approaches to more comprehensive and multifaceted ones. To more accurately assess the climatic suitability of destinations for recreational tourism, the Holiday Climate Index (HCI) has been developed in recent years. The HCI's variable rating scale and component weighting system are based on insights into tourists' climatic preferences. Since different types of destinations have distinct climatic requirements, the HCI is designed with specifications for two major tourism segments—urban and beach.
The HCI: Urban focuses on urban tourism, where the city and its attractions serve as the primary destination and point of interest. This study analyzes the HCI: Urban for Sarajevo, the most significant tourism destination in Bosnia and Herzegovina. The monthly probability is calculated by determining the frequency of daily index scores within ideal and unacceptable categories. Ideal climatic conditions for urban tourism are defined as days with scores between 90 and 100, while unacceptable conditions are those with scores below 40.
Of all tourists visiting Bosnia and Herzegovina in 2023, 41% visited the Sarajevo Canton, which makes it a significant case study. This paper analyzes the HCI: Urban index for Sarajevo in relation to tourist visits throughout the year, and the obtained ratings reflect tourists' climatic preferences for urban destinations.
Holiday Climate Index (HCI): Urban was analyzed for the Sarajevo area, the capital of Bosnia and Herzegovina, in order to more accurately assess the climatic suitability of this destination for tourism. The word “holiday” was chosen to better reflect what the index was designed for (i.e. recreational tourism), since tourism is much broader in definition.
This paper analyzes the HCI: Urban index for Sarajevo in relation to tourist visits during the year, and the obtained scores reflect tourists' climate preferences for the city destination.
Considering that tourists in Sarajevo stay only for a short time (average length of stay 2.1 days), determinants that affect tourist satisfaction and elements of the destination that need to be improved in order to increase the length of stay have been identified. Analysis of average daily values of climatic parameters of a particular destination and monitoring their trend plays an important role in the organization of tourist trips.
This research is the first of its kind related to Sarajevo, and understanding local climatic conditions is crucial for developing tourism strategies, planning, and organizing tourism events in the capital of Bosnia and Herzegovina, which is the most visited tourist city in the entire country.
Introduction
Weather and climate influence travel planning, the duration of stay, and the desire for repeat visits to specific destinations, playing a significant role in tourism demand. Although local climatic factors differ from those impacting global tourism zoning and can limit the duration and quality of the tourist season (Scott et al., 2004; Belén Gómez, 2005), Šabić et al. (2012) emphasize that the climate of a given area serves as both an attraction for tourists and a stimulus for potential investments in tourism. The frequency of specific weather conditions determines the most favorable periods for tourist visits to various destinations. Jahić and Mezetović (2014) highlight that these conditions influence tourists' choice of activities, use of facilities, and mobility within a destination. Analyzing and interpreting local climatic conditions is essential for tourism planning, event organization, infrastructure utilization, and ensuring returns on investments (Matzarakis, 2006; Šabić et al., 2012). However, key tourism drivers are not based solely on favorable climate but also on dominant social patterns of tourism demand (Cazes, 1987). Therefore, climate and weather analyses are contextualized within tourists' needs (Joksimović et al., 2013). Climatological research in tourism focuses on identifying specific climate and weather parameters that objectively influence tourist flows toward destinations. The impacts of climate on tourism are based on selected objective climatological data that shape tourists' individual perceptions (Joksimović et al., 2013). Daily weather assessments are crucial for planning tourism arrangements (De Freitas, 2003; Belén Gómez, 2004; Matzarakis, 2007).
Various authors have explored the relationship between climate and tourism demand, often addressing the direct impact of climate change, which is expected to affect both the quality and length of tourist seasons. In the first half of the 20th century, multidisciplinary research emerged to evaluate the climatic suitability of destinations for tourism. Houghten and Yaglou (1923), as well as Bedford (1948), used simple climatic indicators to highlight the relationship between radiation, sunshine, air temperature, humidity, and wind with the temperature, moisture levels, and metabolic processes of the human body. More complex equations modeling the body's energy balance—known as comfort indices—later appeared in the works of Besancenot et al. (1978), Mieczkowski (1985), De Freitas (1990), Belén Gómez (2004), and Matzarakis et al. (2008).
Tourism Climate Indices are widely used today to assess the general climatic suitability of destinations for tourism. These indices facilitate comparisons of climatic conditions across destinations and project the potential impacts of changing climatic factors (Scott et al., 2016; Rutty et al., 2020). Although climate indices have advanced as tools for assessing tourism-related climate resources, there remains a need for comparative analysis between these indices and actual patterns of destination visitation. Tourism Climate Indices highlight favorable periods throughout the year that attract tourists to specific locations (Rutty et al., 2020). One of the most commonly applied methods for quantifying climate resources is the Tourism Climate Index (TCI), introduced by Mieczkowski (1985). This index integrates key climatic variables relevant to tourism into a single numerical value. According to Scott et al. (2016), the TCI provides an objective comparison of destinations through a comprehensive metric that supports holistic interpretation of a destination's climate. In calculating the TCI, Mieczkowski (1985) introduces several sub-indices: the CID index (a combination of maximum daily temperature and minimum daily relative humidity), the CIA index (a combination of mean daily temperature and mean daily relative humidity), precipitation – P (measured in mm), sunshine duration – S (in hours), and wind speed–W (in m/s).
The multipliers used in the equation are arbitrarily chosen and do not reflect visitors' expressed climate preferences or official tourism data (i.e. revealed preferences). This equation is designed for general analysis rather than for specific tourism segments such as beach and urban tourism (Rutty et al., 2020). Although the Tourism Climate Index (TCI) has been widely applied to assess the future climatic suitability of destinations in Europe and globally, it has faced significant criticism (Gomez-Martin, 2005; Moreno, 2010; Scott et al., 2012). The key weaknesses of the TCI include: a subjective rating and weighting system for climatic variables, neglect of potentially significant parameters such as rainfall and wind, the low temporal resolution of climate data (i.e. monthly data), which limits its relevance for tourist decision-making, and the failure to account for the varying climatic needs of different types of tourism destinations (e.g. beach, urban, or winter sports tourism).
To overcome the limitations of the TCI, Tang (2013) developed the Holiday Climate Index (HCI). This index more accurately evaluates the climatic suitability of destinations for tourism, with the term “holiday” emphasizing its focus on recreational tourism. The HCI, along with its variable rating scales and component weighting system, is based on research into tourists' expressed climate preferences at the beginning of the 21st century. The HCI considers the predominant effects of physical variables such as wind and rainfall, uses daily data to assess index scores (including probabilities of preferred and unacceptable conditions), and aligns with the conceptual design outlined by De Freitas et al. (2008). Furthermore, the HCI acknowledges that different types of destinations require distinct climatic conditions, leading to the development of design specifications for two main tourism segments—urban and beach (Scott et al., 2016).
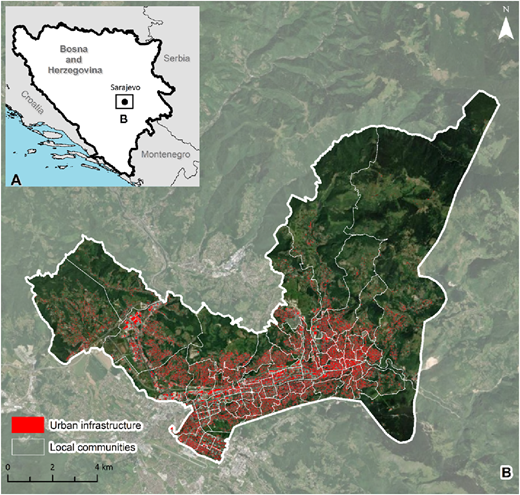
The Holiday Climate Index (HCI): Urban is used to evaluate the climatic suitability of urban tourism destinations. It is calculated based on expressed climatic preferences of tourists engaging in urban tourism, with parameter thresholds defined to reflect comfort levels during movement and activities within a city. Given that this represents a relatively new approach, it is particularly important to conduct case studies across various parts of the world to test the index's validity in diverse climatic and geographical contexts, as well as to enable cross-comparisons between destinations with differing tourism profiles. Such research may also lead to further refinement or diversification of the methodology. So far, studies of this kind have been very limited in Southeastern Europe, although geographically relevant comparisons can be made with research conducted in Mediterranean cities (Demiroglu et al., 2020), urban and rural areas in Romania (Velea et al., 2022), and diverse locations in Slovenia (Pogačar et al., 2025). This study focuses on Sarajevo, the capital and largest city of Bosnia and Herzegovina (Figure 1), aiming to identify the frequency of ideal and unacceptable climatic conditions for urban tourism on a monthly basis, following the HCI: Urban methodology, and to correlate these periods with seasonal tourism trends. Sarajevo's specific climatic characteristics, especially in the context of climate change (Žiberna et al., 2023), are known to affect tourism flows, particularly with respect to seasonal variations throughout the year (Mirić et al., 2017). Despite these variations, Sarajevo is becoming an increasingly popular tourist destination (Čaušević et al., 2020). The city's geographic location and unique topography significantly contribute to its attractiveness, with the surrounding mountains not only shaping its climatic profile but also enhancing its aesthetic and experiential value, making it appealing to visitors across different seasons.
According to Sivac et al. (2023), the tourist destination of Sarajevo is characterized by significant physical-geographical and socio-geographical resources, which hold remarkable scientific, cultural-historical, recreational, and environmental value. The tourist position of the Sarajevo region can be considered favorable, considering and the connection with other European centers through the Sarajevo International Airport. Also, due to its social importance, Sarajevo has over time become a major road junction, which tourists often use as a starting point for exploring other parts of Bosnia and Herzegovina. Given the long period of development of Sarajevo (from its founding in 1,462 to the present day), the cultural and historical heritage of this city is extremely significant and diverse. The architecture of the city represents a combination of the Orient and the West, traditional and modern, and its urban development can be clearly divided into Ottoman, Austro-Hungarian, Yugoslav (predominantly socialist) and modern historical periods (Korjenić et al., 2025).
Today, Sarajevo represents a dynamic and adaptable tourist destination with a wide range of attractions spread across the entire Sarajevo Canton, to which the city of Sarajevo administratively belongs. This is reflected in the increasing number of both international and domestic visitors to the Canton. In 2022, Bosnia and Herzegovina welcomed a total of 1,477,371 tourists, while in 2023, this number rose to 1,733,071 (bhas.gov.ba) (Agency for Statistics of Bosnia and Herzegovina, 2024). Of these, 565,139 tourists visited Sarajevo Canton in 2022, and by 2023, the number increased by approximately 200,000, reaching 716,293 (URL 1 [1]). In the recent period, the share of visitors from neighboring countries Croatia, Serbia and Slovenia has been recording a decreasing trend, while at the same time the number of tourists from other European, Asian and other world emitting centers is rapidly increasing, which speaks of the tendency of Sarajevo's gradual growth into a global tourist destination (Mirić et al., 2017).
Studies focusing on tourist satisfaction with the quality of the destination's supply and overall satisfaction with Sarajevo as a tourist destination highlight the city's growing touristic value (Čaušević et al., 2023; Čaušević and Ahmić, 2020; Čaušević et al., 2020). These analyses have confirmed that visitors express a high level of satisfaction with Sarajevo as a tourist destination. The success of Sarajevo's tourism industry is evident from its substantial achievements, particularly in the 21st century, apart from the period disrupted by the COVID-19 pandemic. With improved organization and development of tourism services, Sarajevo has the potential to establish itself as a popular destination for visitors worldwide (Sivac et al., 2023).
Although tourism in Sarajevo has been on an upward trajectory in the last 20 years, it is crucial to achieve sustainable development of the destination. The problem that this city has, when it comes to tourism development, is reflected, among other things, in the relatively short stay of foreign tourists (the average number of overnight stays per foreign visitor is less than two), and could potentially be solved by additional affirmation of other (non-urban) attractions offered by Sarajevo. Sustainable tourism planning in Bosnia and Herzegovina represents a particular challenge, given the wealth of tourism potential as a whole on the one hand and the socio-political situation and the economic challenges the country faces on the other.
This research can contribute to a better understanding of the climatic conditions in Sarajevo and their relationship with the planning and organization of tourist activities in this part of Europe. This study presents the first application of the Holiday Climate Index (HCI): Urban to Sarajevo, offering a well-known and previously tested approach to evaluating climate suitability for tourism, now applied to one of Southeast Europe's fastest-growing urban destinations for the first time. Given Sarajevo's rapid emergence as an important urban tourism destination in this part of Europe, this research provides valuable insights for tourism planners and local authorities seeking to align seasonal climate conditions with strategic development. The results of this research can be compared with data from other European and global capital cities, enabling the application of best practices in the further development of tourism in Sarajevo, a city whose tourism sector experienced stagnation following the war devastation of the 1990s, but which is now steadily reemerging as a significant urban destination.
Methodology
The Holiday Climate Index (HCI) was developed to tailor climate assessments for major tourism segments and destination types. Specifically, HCI: Urban focuses on evaluating the climatic suitability of urban tourism (Tang, 2013; Scott et al., 2016). The index's variable rating scales and the component weighting system are designed based on research into tourists' climate preferences, providing empirical validation of the index. HCI incorporates three key climate factors relevant for leisure tourism activities:
- (1)
Thermal comfort (TC): A function of the maximum daily temperature (°C) and average relative humidity (%).
- (2)
Aesthetic factor (A): Assessed through the percentage of cloud cover.
- (3)
Physical factor (P): Includes precipitation (mm) and wind speed (km/h).
According to Tang (2013), the combined HCI: Urban score is calculated using the following equation:
Each climate variable is rated on a scale from 0 to 10, with the total HCI: Urban score ranging from 0 (potentially hazardous for tourists) to 100 (ideal for tourism) (Table 1). If all three factors fall within the preferred ranges for most tourists, the rating is considered ideal. Conversely, conditions deemed unacceptable for the majority of tourists correspond to an HCI score below 40.
The HCI does not define any condition as “impossible” for tourism, as some tourists actively seek unfavorable weather conditions (e.g. strong winds for windsurfing, storm watching, etc.). Instead, it defines the lowest category as dangerous for tourists because such low scores require the presence of hazardous thermal conditions (heat/cold stress, very strong winds, or heavy precipitation). These types of conditions rarely last more than one or 2 day at a destination. For calculating the thermal comfort (TC) component of HCI: Urban, the Universal Thermal Climate Index or Humidex was used. Humidex is an index value first introduced in Canada in 1965. It is used to describe how an average person feels in hot and humid weather. This index combines temperature and humidity into a single value that reflects the perceived temperature (URL 2 [2]).
HCI: Urban eliminates the evening temperature (a sub-index in TCI) to reflect the fact that in the 30 years since TCI was developed, air conditioning has become almost universal in tourist accommodations in developed countries and major tourist destinations in developing countries. As such, evening temperatures are much less relevant for sleep comfort. Daytime temperatures instead serve as a reasonable substitute for early evening conditions, with high daily thermal comfort scores reflecting the comfort level during most of the time tourists are engaged in activities.
For the aesthetic aspect (A), HCI: Urban uses the percentage of cloud cover as a variable, with the highest score reflecting tourist preferences, where most tourists consider 11–20% cloud cover “ideal” for the aesthetic experience of urban tourism, rather than a completely clear sky (0% cloud cover) (Table 2). For the lowest scores in the aesthetic aspect, TCI assigns a score of 0 to days with less than one hour of sunshine, but research findings reveal that tourists accept all cloud cover conditions (even 100%). Therefore, the HCI scale does not assign a score of 0 for cloud cover. Regarding precipitation, HCI: Urban accounts for its impact on the holiday experience, using daily precipitation amounts. As shown in Table 2, except for the lowest daily precipitation amount, HCI assigns a score of 9 to daily precipitation below 3 mm. Only when daily precipitation exceeds 12 mm does HCI assign a score of 0.
When evaluating wind, HCI: Urban considers that tourists are more affected by the physical impact of wind (e.g. blowing clothes and hair, disrupting outdoor activities, airborne dust, etc.) than by the wind's impact on their thermal comfort (Scott et al., 2008; Rutty and Scott, 2015). When wind is primarily relevant for thermal comfort (e.g. wind chill), thermal ratings tend to be marginal. Similar to precipitation, disruptive strong winds also have a dominant effect on the HCI score.
The methodology used in this study focuses on analyzing climate and tourism data for the Sarajevo area (geographic, climatological, and tourism databases). Based on the available daily values of the required meteorological parameters (FHMZBIH; URL 3 [3], Federal Hydrometeorological Institute, 2024), the daily values of the HCI: Urban index were calculated monthly for the Bjelave meteorological station (MS) in Sarajevo for the year 2023. Additionally, the percentage-based monthly probability was determined by analyzing the frequency of daily index results within ideal and unacceptable categories.
The average monthly values of the metrological parameters for the year 2023 that were used in the research do not deviate to a large extent from the multi-year monthly and annual average for Sarajevo, and smaller deviations can be explained by global weather conditions. Thus, according to data from POWER|DAV (URL 4 [4]), the average annual temperature for the 30th annual period (1991–2020) in Sarajevo was 8.5 °C and the average annual precipitation was 870 mm. Sarajevo has a temperate continental climate (Cfb), with cold winters and mild summers. The average summer temperature for the summer season was 18.1 °C and a winter average of −1.01 °C for the multi-annual period and in 2023 the temperatures during the summer were on average 18.8 °C and during the winter months 0.7 °C.
Statistical time series were analyzed using dynamic methods to calculate variations in climate and tourism parameters. Correlation statistical methods, specifically linear regression, were used to examine the interdependence between the Holiday Climate Index (HCI) and tourism flows throughout the year in Sarajevo.
Results
The results of the analysis of daily values of the HCI: Urban index indicate seasonal variations in climate conditions for tourism throughout the year in Sarajevo. Under the current climate conditions of a moderately warm and humid climate with warm summers (based on data from the period 1991–2020, nasa.gov), Sarajevo exhibits a well-defined distribution of climatic resources. The analysis of data for the year 2023 revealed that ideal weather conditions occur at the end of the spring season, during the summer months, and extend into the autumn season (Table 3).
The index values have been descriptively assessed, allowing for the conclusion that, for the development of tourism, ideal climatic conditions persist from May to November, while acceptable to very good conditions are represented throughout the entire year. Given that this is urban tourism, there are fewer days considered unacceptable for urban tourism than those with an HCI: Urban index greater than 40. Days with an unacceptable index for tourism development in the city and for outdoor stays are more prevalent during the winter season. January is the most unfavorable month in terms of weather conditions, with around 30% of days in this month falling into unacceptable categories of the HCI: Urban index. In addition to January, the number of such days is also higher in December, February, and November.
The frequency of daily index results in ideal and unacceptable categories has been reduced to their percentage representation on a monthly level (Table 5). It should be noted that this index, despite its significance, does not correspond to all tourist activities, and the intensity and duration of desirable conditions for recreational activities of tourists are significantly influenced by geographical factors of the destination. According to Mansfield (1992), climate is just one of the key determinants of tourist travel decisions, alongside other factors that affect the type of vacation and choice of destination (e.g. motives, desired benefits, attitudes, budget, weather, distance, prior experience).
In exploring the motives for visiting Sarajevo among tourists, Čaušević et al. (2023) observed that relaxation and leisure were the most common responses from about 20% of respondents, followed by visiting friends at 16%, culture at 10%, entertainment, sports, and recreation at 7%, while more than 40% of surveyed tourists indicated multiple reasons for their visit. The pleasant, moderately warm climate with warm summers and evenly distributed precipitation throughout the year is one of the motivating factors preferred by tourists from warmer climates (United Arab Emirates, Saudi Arabia, Kuwait, Oman, etc.). Given that, according to official data from 2022, alongside tourists from Germany, the USA, Slovenia, and Montenegro, the leading number of overnight stays is increasingly accounted for by tourists from Croatia, Turkey, Serbia, as well as from Saudi Arabia and the United Arab Emirates (Sivac et al., 2023), it can be said that the climate, as one of the important motives for visiting Sarajevo, is gaining greater significance.
In Bosnia and Herzegovina, as well as on a global level, tourism has been strongly affected after the outbreak of the COVID-19 virus. According to Postma and Yeoman (2021), three interrelated factors have caused a dramatic decline in international travel: decrease in demand for travel, countries have closed their borders, and mega events have been cancelled. The number of tourist arrivals in Sarajevo recorded steady growth until 2019, after which there was a decline due to COVID-19 in 2020. Since 2020, the number of tourists has been rising again and is higher than the number of tourists before the pandemic. In 2023, international tourists continue to dominate, accounting for about 83% of arrivals (Table 4). Specifically, overnight stays in 2022 increased by more than 70,000 compared to 2018, indicating sustainable demand. These data indicate Sarajevo as a significant tourist destination where the number of tourists is increasing every year. In this way, the importance of tourism planning and organization of the tourist offer in Sarajevo as one of the rapidly growing tourist destinations in this part of Europe is linked.
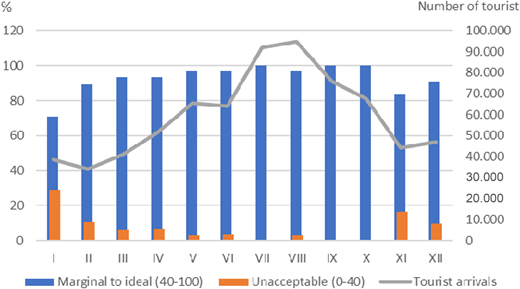
To better understand the relative advantage and significance of the HCI index, the assessment of climate suitability for tourism has been linked to tourist supply, specifically the patterns of tourist visits for the year 2023 in Sarajevo (Figure 2). Monthly data on tourist arrivals were taken from the Statistical Office of the Federation of Bosnia and Herzegovina (URL 1[1]) and were separately analyzed, as well as the HCI by month for 2023. In this way, they were brought into connection and the relationship between tourist arrivals and different weather conditions during the year was shown.
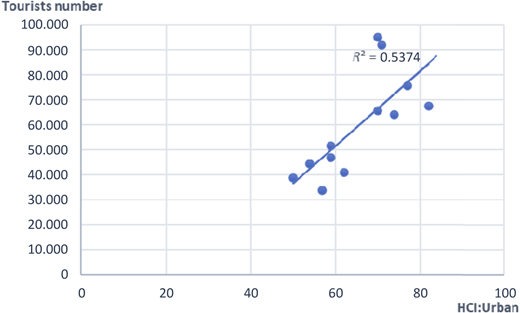
The results of the linear correlation (Figure 3) indicate varying relationships between HCI: Urban and the number of tourists by month. Sarajevo has a correlation coefficient of 0.5374. The correlation coefficient refers to a moderate relationship between the HCI and arrivals to Sarajevo. According to Rutty et al. (2020), the relationship (R2) between monthly mean index scores and total monthly arrivals has a moderate correlation when values are between 0.40 and 0.59.
HCI: Urban records the highest average monthly values in October (82) and September (77), which can be characterized as very good to excellent conditions for tourism development, even though the highest visitor numbers occur in July and August, followed by September and October. This pronounced visitation during this part of the year is typical for many urban, administrative, and cultural centers such as Sarajevo.
There is a clear underutilization of tourism from November to February, when conditions for tourism development according to the HCI: Urban index are rated as acceptable (50–59). January and February particularly show the lowest number of tourists in Sarajevo. During this period, tourists, considering the proximity of the Olympic mountains of Bjelašnica, Jahorina, and Igman, primarily visit the area for winter skiing tourism.
According to the research and the data from Table 3, the monthly average values of the HCI: Urban index indicate that there is no month during the year, in its entirety, with unacceptable conditions for tourism (no month has a completely HCI: Urban <40). This means that during the month there are days that can be used for urban tourism, which in percentage terms amounts to more than 70% of the days for each month (Table 5). Various empirical studies on thermal comfort have shown that people who spend their leisure time outdoors accept thermal conditions that exceed the usual indoor physiological comfort thresholds (Rutty and Scott, 2015; Lin, 2009), and tourists report a broader range of temperature conditions that are acceptable for urban leisure (Guo, 2015).
The results of linear regression were also analyzed and presented in the paper, where the values of the HCI: Urban index and the number of overnight stays per month, which are a very significant indicator of tourist performance, were linked. Monthly values for the year 2023, on overnight stays were taken from the Statistical Office of the Federation of Bosnia and Herzegovina (URL 11).
A simple linear regression was conducted to examine the relationship between the Urban Climate Index (HCI: Urban) and the number of monthly tourist overnights in Sarajevo (Table 6). Simple linear regression was selected due to its suitability for exploring the strength and direction of the relationship between two continuous variables, in this case, climatic suitability (HCI: Urban) and tourism activity (overnight stays). The model was statistically significant (F (1.10) = 5.004, p = 0.049), explaining approximately 33.4% of the variance in arrivals (R2 = 0.334) (Table 7). The regression coefficient for HCI-urban was significant (b = 2,739.51, t (10) = 2.237, p = 0.049), indicating that each one-point increase in HCI: Urban is associated with an average increase of approximately 2,740 overnight stays. The constant was not statistically significant (p = 0.471), and the 95% confidence interval for the slope ranged from 10.80 to 5,468.23. Although the constant was not statistically significant, this does not affect the validity of the model, as the primary interest lies in the significance and effect of the predictor variable (HCI: Urban).
While the model demonstrates a significant relationship between HCI: Urban and monthly tourist overnights, the results should be interpreted with caution, especially when making generalizations, due to the limited sample size (n = 12 months). Future research should aim to include data over multiple years to account for interannual variability and to increase the statistical power of the analysis. Additionally, incorporating other potentially relevant predictors, such as events, holidays, promotional activities, or socioeconomic data, could enhance the explanatory strength of the model. Employing multiple regression techniques with a larger dataset would also allow for more precise modeling and a better understanding of the combined effects of climate and non-climate factors on tourism demand.
Discussion
HCI: Urban was designed to meet the recommended elements of the tourism climate index. It integrates all three aspects of climate that are relevant to tourists' holiday experiences, based on empirical findings regarding tourists' climate preferences (Scott et al., 2016). The recreational climate index, primarily adapted for recreational types of tourism, is significant for climate assessment and can be applied to various tourist destinations. The HCI is simple to calculate, using standard meteorological data available from national climate databases. It is user-friendly and easy to understand, with a scoring system (0–100) and associated descriptions of climatic conditions (impossible–ideal). According to this index, thermal comfort accounts for 40% of the weighting, and the predominant effects of precipitation and wind are also recognized, leading to a decline in overall ratings when adverse physical conditions (e.g. strong winds, high temperatures, etc.) are present.
Climatic characteristics, alongside other natural and anthropogenic features, are significant attractive factors for tourist destinations. Climate is generally recognized as a complementary tourist resource; however, in some destinations, its intensity of impact holds independent value. Many tourists are entirely motivated by the climatic characteristics of the areas they travel to, and even tourists whose travel motivations are not climate-related have an interest in choosing the time of year when the climatic characteristics of their travel destinations are most favorable.
Natural values, numerous cultural and historical contents, a rich gastronomic offer, and a large number of events each year attract an increasing number of tourists in Sarajevo. The impact of geographical factors on the intensity and duration of favorable conditions for tourists' recreational activities is significant. Seasonal variations in monthly arrivals reveal a summer peak, while the HCI: Urban index shows its highest values at the beginning of the autumn season. Winter climatic conditions can also be considered “acceptable” for leisure tourism, as reflected in the HCI: Urban ratings for Sarajevo; therefore, various activities, events, etc., should also be planned during the winter season to attract a significant number of tourists. In this way, besides the winter sports tourism that dominates in the Olympic mountains surrounding Sarajevo, other types of tourism could also be developed, which would influence an increase in the number of tourists during this season. Considering that tourists in Sarajevo stay for only a short period (the average length of stay is 2.1 days), it is necessary to identify the determinants that affect tourist satisfaction and the elements of the destination that need improvement to increase the length of stay. Analyzing the average daily values of climatic parameters for a specific destination and monitoring their trends plays an important role in organizing tourist travels. The development of tourism events and the presentation of cultural and historical landmarks are crucial for mitigating seasonal variations and balancing tourist numbers throughout the year. One of the key challenges across all sectors, including tourism in Sarajevo, is air pollution, particularly prevalent during the colder seasons when thermal temperature inversions occur. Global climate changes, which are evident in this area (URL 5 [5]; Hadžić and Drešković, 2012), increasingly highlight tourism's vulnerability to these changes and the impacts that are becoming more unpredictable. One of the priorities for tourism participants should be to use increasingly available climate information to make decisions that minimize climate risks while maximizing opportunities and operational efficiency.
One of the priorities for tourism stakeholders should be to use increasingly available climate information to make decisions that minimize climate risks while maximizing opportunities and operational efficiency. However, while this study focuses on the role of climate in shaping tourist arrivals in Sarajevo, it is important to note that other factors, such as school holiday periods, cultural and historical attractions, festivals, and various events, also influence visitation patterns. In this sense, climate should be viewed as just one part of the city's broader tourism offer. Future research should incorporate these elements into more advanced models (e.g. multivariable regression or time-series analysis) to better explain seasonal variations in tourist flows. Moreover, comparing Sarajevo with other cities in the region or Europe could provide additional insights into how different factors interact in urban tourism development.
This type of research is particularly relevant in the context of Bosnia and Herzegovina, where studies on the relationship between climate and tourism remain limited. As global tourism trends increasingly shift from traditionally dominant destinations to emerging ones, Bosnia and Herzegovina with its rich cultural heritage and growing appeal, has become an increasingly attractive destination on the European tourism map. Given the country's ongoing transition toward a service-based economy, with tourism playing an expanding role in both GDP growth and employment generation, studies of this kind are essential for guiding development in a more sustainable direction. Integrating climate-informed planning into tourism strategies can support both the diversification and resilience of this rapidly evolving sector.
Conclusion
The assessment of climatic conditions and tourism demand in Sarajevo, conducted using the Holiday Climate Index (HCI: Urban), indicated that optimal weather conditions for urban tourism are observed between May and November, while the winter season favors snow-related and ski tourism. The correlation between the index and tourist arrivals highlights the pronounced seasonality of demand and the decisive role of climate, particularly in summer and autumn. At the same time, the results suggest opportunities to diversify tourism offerings during less favorable periods, as well as the necessity of further research to achieve a more precise alignment of tourism activities with prevailing climate patterns.
The study confirmed that the application of the HCI: Urban index constitutes a valuable tool for the timely planning and development of tourism capacities, albeit with certain limitations stemming from the subjectivity of weighting and level of detail of the data. Future research should focus to expand the scope of analysis to additional destinations and tourism segments, and to develop tailored modules for various types of tourism products, thereby enhancing the relevance and precision of these climate indices in tourism planning and decision-making.
Furthermore, the research established that climatological conditions exert a strong influence on tourism flows in Sarajevo, and that the integration of climatological analyses into tourism strategies will be essential for the sustainable and competitive development of the city as a tourism destination.
The results of the linear regression analysis revealed a statistically significant relationship between HCI: Urban index and the number of tourist overnight stays in Sarajevo. The statistical model (F (1.10) = 5.004, p = 0.049) indicated that the index explains about 33.4% of the variation in overnight stays, thereby confirming the substantial influence of climatic conditions on tourism demand within the urban segment. Specifically, each one-point increase in the HCI: Urban index corresponds to an average increase of approximately 2,740 overnight stays, confirming that favorable climatic conditions directly stimulate tourist arrivals and extend the duration of stays.
These findings emphasize the crucial role of climatological factors in Sarajevo's tourism development strategy, particularly in the context of urban tourism, where climate conditions are decisive in determining the timing of visits. In addition to confirming the importance of systematic monitoring of climatic indicators for the effective management of tourism capacities, the study highlights the need to integrate such insights with other influencing factors and to establish long-term research, providing a comprehensive basis for policies aimed at the sustainable growth of tourism.
The research presented in this paper represents an initial phase in applying and evaluating the HCI: Urban index for Sarajevo and it opens the door for comparative analyses at other tourist destinations and climatically diverse locations across Bosnia and Herzegovina, as well as in the broader regional and global context. Further research is needed to examine how the HCI: Urban scores align with visitation patterns at the level of specific tourist attractions and to explore how the index may relate to indicators of tourism industry performance. Although this study focused on general urban tourism, similar approaches could be adapted to destinations characterized by seasonal or selective forms of tourism, such as winter sports or hiking, allowing for broader applicability of the HCI framework.
This research did not integrate other important tourism-related factors such as school holidays, cultural events, flight schedules, or accommodation pricing, all of which can strongly influence tourist flows. Future analyses could employ multivariate or time-series models that integrate these additional drivers. Furthermore, applying lagged variables could help account for the time gap between weather conditions and tourist decision-making. Expanding the geographic scope to include comparative destinations would also help evaluate the general applicability and adaptability of the HCI: Urban index.
Notes
URL 1: www.fzs.ba (September, 16th 2024).
URL 2: www.canada.ca (September, 16th 2024).
URL 3: fhmzbih (September, 18th 2024).
URL 4: nasa.gov (September, 9th 2024).
URL 5: undp.org (August, 16th 2024).