


The purpose of this paper is to identify and prioritize the positive and negative impacts of tourism on the process of tourism growth at a national scale in Iran, by taking into account the reviews of previous studies, views of experts and structural analysis.
In this investigation, structural analysis technique has been used to identify the correlation between variables by using mix method data analysis. By using cross-impact analysis (N × N integer matrix) in the form of the Micmac method, the economic, sociocultural and environmental factors have been evaluated.
The results of the distribution of factors in the coordinate axes and the graphs between them indicate their features, and for reaching a sustainable system of tourism development, at first, priority should be given to the negative influential factors, especially the environmental fields, and then the focus should be on the decrease of the dual and risk variables as they cannot be anticipated.
For the rapid growth of tourism in many countries, governments ensure that policies have been heeded in designing and preparing general plans of the country to understand how the development trend is moving on. In this respect, arisen impacts of tourism system are one of the important issues during the development path and in the field of tourism future. Because of the complexity and broadness of tourism activities, these impacts have also many interconnected dimensions that should also be considered while studying tourism impacts.
1. Introduction
What will the future of tourism look like? How do we prepare for future situations? To have a competitive role in the current globalized tourism system, it is crucial for any company, institution or country to find good answers to these kinds of questions, as evidenced by the large number of foresight agencies, organizations and departments operating around the world. Nowadays, the need for future studies to make long-term planning and strategies for proper management has become necessary. This necessity has emerged, from the social, cultural, economic, environmental and technological opportunities and threats in most developing countries such as China, Brazil or India (Villacorta et al., 2014). The study of the future of tourism system is necessary for its planning and development. In addition, it is widely understood as a means to help managers to predict the future. Using future methods to help managers and policy makers to stimulate creative thinking to consider a wide variety of coherent descriptions of alternative hypothetical futures in a systematized way in the tourism system. These predictable actions will reflect different perspectives for present and future developments, which can serve as a basis for successive actions in the system (Amer et al., 2013).
The current global growth of tourism results in formulating strategic plans, long-term planning or development trends by governments to increase their contributions such that the tourism growth is benefitted. In this respect, arisen impacts of tourism system are the important issues during the development of the system. The complexity and broadness of tourism system is necessary to study tourism impacts in a specific way (Mason, 2003, p. 42). Generally, impacts related to tourism could be examined in three fields: economic, sociocultural and environmental impacts, thereby affecting the economic, social, cultural and environmental circumstances of the communities (Aref et al., 2010). The concept of sustainable development in tourism tries to make a balance between sociocultural, economic and environmental impacts as much as possible. Hence, understanding the potential of tourism impacts in development process is the basic and logical assumption of sustainable tourism planning. However, lack of sustainability in tourism can cause excessive costs and emergence of various challenges. In most cases, forecasting of the future by using non-professional ways and without trend analysis can cause many problems in carrying out the plans; therefore, a systematic look at the subjects and using expert analysis of future trends can become an appropriate basis for decreasing the negative impacts and improving positive impacts in tourism realm.
Iran has a large number and wide variety of tourism attractions, giving it a strong potential for tourism development. To reach the goal of a successful sustainable tourism development, Iran needs careful planning, systematic implementation of the plans and a continuous and effective management. Today, tourism industry in Iran needs a scientific revolution and specific changes in its structures. In this respect, planning and policymaking in accordance with the national sustainable development of tourism, economic, sociocultural, and environmental situation and trends of the country is necessary.
The objective of tourism development in Iran must be set in a relevant context and should contribute positively to the achievement of the broad economic, social, cultural and environmental objectives of the nation and country. In this regard, Iran’s tourism cannot be planned or managed in isolation. Iran’s tourism, especially dealing with negative impacts of tourism on environment, culture and economy, needs to be viewed professionally by using logical thinking and some more reliable scientific methods in the field of scientific research and investigation for its development.
Generally, various future study methods, based on the nature of the procedures, can be classified into qualitative and quantitative (Amer et al., 2013). In this study, we focus on cross-impact analysis (CIA) as one of the most applied quantitative methods at a national scale (Gordon, 2009). A well-known variant of CIA method proposed by Duperrin and Godet (1973) and Godet (2000) is MICMAC, which has been successfully applied in many fields.
This study aimed to analyze Iran tourism system by considering the positive and negative impacts of economic, sociocultural and environmental aspects to find out the extent of sustainability or unsustainability of the system. Implementation of long-term planning based on these findings seems possible and feasible.
This study has tried to answer the following questions:
What are the most important variables for systematic analysis of tourism impacts?
What is the role of each variable under study in economic, sociocultural and environmental tourism?
The paper is structured in three steps: the first step describes the theoretical framework and foundations and literature relating to the perception of tourism impacts in host communities. The next step describes the methodology of the research. In the last step, both the research process and the results are discussed, and implications and recommendations are highlighted.
2. Theoretical framework
2.1 Study area
Covering a wide area in the Middle East, 1,648,195 km2, and a population of approximately 80m (2015) (Figure 1), it is located between 25° 3∕ and 39° 47∕ N and 44° 5∕ and 63° 18∕ E, bordering Azerbaijan, Armenia and Turkmenistan in the north, the Persian Gulf and Oman Sea in the south, Iraq and Turkey in the west, as well as Afghanistan and Pakistan in the east (Foroutan et al., 2017).
Iran is a country with great history, ancient culture and a varied geography, which give rise to a wealth of substantial tourism potentials encompassing many national and man-made tourist attractions that present many activities for tourists (Ghaderi and Henderson, 2012). Iran’s spirited culture makes it much wealthier than a rich developing economy. However, Iran’s tourism industry has suffered from a wide range of issues over the past three decades, including the overdependency on oil revenues, political instability, the label of a terrorism-struck destination and poor management, making it unfavorable (Khodadadi, 2016). According to the current conditions in Iran, the existing gap between potential and reality tourist attractions leads to some consequences. The most important of these are the lack of infrastructure needed to support and facilitate tourism activities and the absence of a systematic tourism long-term planning and policymaking (Alavi and Yasin, 2000). Iran’s Cultural Heritage, Handicraft, and Tourism Organization (ICHTO) was established in 2004. This organization has the responsibility of tourism industry in Iran (Ghaderi and Henderson, 2012). Tourism, as a part of a systematic growth strategy, has the real and affordable potential to contribute significantly to the environmental, social, cultural and economic aspirations of Iran (Alavi and Yasin, 2000). Attempts to predict and have some perceptions of probabilities of future seem to be essential for all countries, but they are most crucial for Iran’s economy, society and culture. Communities seek to determine their futures whether through prophecy or systematic forms of scientific forecasting.
2.2 Tourism system
Since the present study tries to analyze systematically the impacts of tourism on economic, sociocultural and environmental fields, it is based on system theory (Beni, 2001; Leiper, 1990 cited in Mason, 2003). This theory is a fundamental one with a philosophical framework in long-term planning. From the system theory perspective, every phenomenon (animate or inanimate in world) is an organized collection of specific elements and relations, which is called a system. This system has a specific and meaningful function (Mahdizade, 2007, p. 40). In other words, the system is a complex whole, and its function depends on its components and interaction between them (Jackson, 2003). If we consider tourism as a system, then each one of its elements in reaching the goal is in a reciprocal relation and interaction, having influence/dependency on each other. For example, tourism seems to be an inter-systemic process such that its components have relation with each other. One of the main components is arisen impacts; its impacts are modeled as positive and negative in different sociocultural, economic and environmental dimensions.
As mentioned above, each system consists of subsidiary systems or subsystems; in other words, each system functions as a part of a larger system. The main subsystems are known as structure and larger systems as system environment. These systems are in mutual interaction (Mahdizade, 2007, p. 40). System theory focuses on order and relation between sections and the way they function. Subjects like course of sections’ organization and how they are related to each other define the properties of the system. In other words, in addition to set of sections and relations that define the components of the system, the environmental and external factors of the system are also effective in making the whole system (Chikere and Nwoka, 2015). On the contrary, there is no system in void and obviously each system belongs to external environment and a larger system such as industry, economy and society (Weihrich et al., 2008).
Beni (2001) presented his tourism system as an open system that can influence and be influenced by the other systems with which it interacts. This system is composed of three sets:
Environmental relationships are composed of external settings in tourism system, which include cultural, social, ecological and economic subsystems. Each one of these external settings is influencing internal elements.
The structural organization consists of the superstructure and infrastructure subsystems.
Operational actions contain the dynamics of the tourism system. They include supply, market, demand, production, distribution and consumption subsystems. This holistic approach can be considered in all components and dimensions. Tourism seems to be a dynamic and open system that has effects on supply and demand. From an overview perspective, the tourism market, as well as infrastructure and superstructure are systemically affected by their environment. In other words, the aim of system is to understand the operation of tourism and present the systems that precede it. This system explains each of the elements of tourism from its interrelation with other disciplines and the origin of controlling and dependent subsystems. Tourism System (SISTER) is introduced as a set of procedures, ideas and principles, and ordered logically with the intention of seeing the operation of the tourist activity as a whole.
2.3 Tourism impacts
Tourism is one of the important types of human activities that has important impacts on local community. These impacts on destination societies, where tourists are in touch with living, economic and sociocultural environments of these societies, are conspicuous and visible. Therefore, categorizing tourism impacts in three categories, sociocultural, economic and environmental, is typically an accepted practice (Mason, 2003, p. 29):
Economic impacts of tourism: generally, economic dimension is the most important reason for the positive attitude of local community toward tourism. However, this economic dimension can include the evaluation of positive and negative aspects depending upon the level of development of countries. Some of these impacts are as follows: increase in income (Andereck et al., 2007), generation of employment opportunities (Deery et al., 2012), improvements in community infrastructure and public facilities (Yoon et al., 2001), seasonality (Wu and Chen, 2015) and so on.
Sociocultural impacts of tourism: these impacts are defined as factors influencing customs, habits, social life, beliefs and values of native inhabitants of tourism destinations. Interactions that take place between local people and tourists can result in new social and cultural opportunities for both sides or, on the contrary, can generate feelings of distress, pressure, congestion, etc. (Andereck et al., 2005).
Environmental impacts of tourism: tourism can result in preserving and protecting the resources or can result in destruction or damaging of resources with attractive, yet fragile, settings. These impacts can be in form of pollution increase, improvement of the appearance of host community, etc. However, negative environmental impacts are ignored by local community in favor of tourism advantages (Yoon et al., 2001; Liu and Var, 1986).
In passing, it should be noted that confronted by research in the triple impacts of tourism is the dominance of a quantitative paradigm that has not facilitated a deep and clear understanding of the impacts and how these impacts were formed. The research tries to date and provide lists of impacts, more importantly, a deep understanding of future impact trends in the tourism system and how these could be conducted in the future of the tourism system, if necessary.
2.4 Sustainable development of tourism
Generally, sustainable development is a development that meets the needs of the present without compromising the ability of future generations to meet their own needs (Brundtland, 1987). Another definition of sustainable development given by Co-operation and Development (2001) is about the coordination of economic, social and environmental aspects (Dias et al., 2014; Shaker and Sirodoev, 2016). This also applies to tourism, wherein the basic concepts of general sustainable development have been gradually translated into the concept of sustainable tourism development (Postma and Schmuecker, 2017). From the point of view of WTO[1], the core principles of sustainable tourism development are as follows: to provide high-quality experience for visitors; to maintain the quality of the environment; and to improve the quality of life of the host community, on which both the host community and the visitors depend (Mill and Morrison, 2002). In this respect, local governments should be more careful and responsible to the local people and visitors who may be affected by tourism in all its positive and negative manifestations (Burns and Holden, 1997).
2.5 Importance of future studies
In general, futures studies refer to the scientific study of future developments in the terms of possibility, desirability and probability. There are two different attitudes of the future in developed and developing countries: knowledge-based society and sustainable society. In developing countries, the concept of sustainable development is commonly found according to the need to maintain the fundamentals of existence and production, worldwide and on a long-term basis, and to distribute the profits of natural and scientific technological resources more fairly (Kreibich et al., 2012). In terms of planning the future, forecasting functions are just one approach among many that are essential to develop a good plan. Most of the planners use the future study to help in planning for the future and for policymaking and strategic planning. Future studies cannot always be beneficial and effective. Sometimes, they challenge the current framework and circumstances, and they can also be more disruptive instead of seeking to make strategy more effective (Inayatullah, 2013). Future planning seeks to collect, integrate and link relevant information to provide effective and organized solutions for building strategy and reaching it. Furthermore, using tools for analysis of behavior and forces of social actors and crucial variables in order to develop strategies is the main goal of future studies (Apodaca, 2001; Georghiou et al., 2012). Generally, as claimed by Glenn, future would never been known or anticipated accurately and completely. In this regard, intention to research the future must be explored, created and investigated systematically, and desirable future can be attained by improving policy decisions (Glenn, 2003).
2.6 Cross-impact analysis
There are many future research methods, ranging from qualitative to quantitative or simplistic to complex (Glenn and Gordon, 2003). There are many criteria regarding the choice of the methods of future studies. The choice must be depend on the existence problem, potential resources and the level of progress of planners. There are some important and best-known methods in this field of study, including the Delphi method, scenario writing, simulation and CIA (Schnaars, 1987).
Although the future is a perspective event, caused by the interactions of many dynamic and evolving events over time, producing information only in an isolated way is the fundamental limitation of numerous futurology-based research methods. It means that events and developments are surveyed without considering their possible impact on each other. To examine the behavior of a system in the future, a set of variables, crucial to systematically explain the system and their relationships that will shape the future, needs to be analyzed. These interrelationships between system’s variables are called cross-impact (Asan and Asan, 2007a, b). The cross-impact is the best-known method used to analyze interrelationship between the variables. For systematic description of all potential modes of interaction between a given set of variables and for the assessment of the strength of these interactions, the CIA method is used (Schlange and Jüttner, 1997).
Theodore, Gordon and Olaf Helmer were the first ones who originally developed the cross-impact method (Gordon and Hayward, 1968). Since 1966, several researchers have developed many versions of CIA method (Duperrin and Godet, 1973; Godet, 2000; Gordon, 2009). According to the previous studies, three groups of these versions can be categorized: quantitative, qualitative and mixed method CIA. There is a big difference between quantitative and qualitative versions, that is, mathematical model relating to the variables (quantitative) and experts’ estimates of the relationships − probabilities or impact − among the variables (qualitative) (Duperrin and Godet, 1973). The aim of the CIA is to reduce the complexity of the system and to identify the important and key variables that should be studied. There are some important steps in this classification. The exploration of the key and crucial variables means that any change in key variables will affect the whole system and they will have more importance in the future of the system (Schlange and Jüttner, 1997).
2.6.1 Structural analysis
We can explain the structural analysis as a system that has a set of interrelated variables. In this system, there is a network of the interrelationships between variables, and their analysis is essential to understand the evolution of the system in the future (Chine et al., 2017). From the point of view of the structural analysis functions, we can point out to identify the structure of the relationships between the quantitative and qualitative variables, which characterize the system under study (Chine et al., 2017). Furthermore, we can describe a system by using a interconnect matrix in structural analysis. The important output of structural analysis is the identification of key variables controlling the evolution of the system under study (Chine et al., 2017).
The structural analysis is based on the CIA method. In fact, the structural analysis method is a variant of the original CIA method, taking into account not only the direct relations but also the indirect ones (Cabrera et al., 2002).
2.6.2 Structural analysis with MICMAC method
The MICMAC (cross-impact matrix multiplication applied to classification) is a method for structural analysis and a well-known variant of CIA method proposed by Duperrin and Godet (1973) and Godet (2000). This method is aimed at determining the most important variables within a system among a set of variables, initially specified by an expert committee, and it analyzes the importance of a given set of variables through a matrix. In other words, the experts define the key variables of the system to establish their role in the system (Villacorta et al., 2014). The MICMAC method consists of the following three phases (Arcade et al., 1993):
gathering the inventory of variables;
describing of the relationships between variables; and
the identification of key variables.
To describe the relationship between variables in phase (2), an (n)×(n) integer matrix in a quantitative form must be sounded by an expert panel. This matrix is known as MDI or matrix of direct influence. Each cell of MDIij shows the impact of each “i” variable on “j” variable. The numbers from 0 to 3 give value to these impacts and are described as follows: number 0 shows no relation between variables, number 1 shows weak relation between variables, number 2 shows moderate relation between variables and number 3 shows strong relation between variables.
Identifying the key variables is a very important step that shows the level of variable’s importance through the integer matrix. Outputs show the type of impacts and their relationship to others, and this has a vital role in presenting the best management planning.
There are two procedures to accomplish this: direct and indirect. In accordance to the nature of the data, analysis has been done by using the direct method. The direct method ranks the variables according to their direct influence/dependence on/of the others. In this regard, the elements of MDI matrix in the form of the kth row and kth column have been added by MICMAC to obtain the global direct influence. As said above, we can have following formulas:
and dependence, in the form of:
of the kth variable, respectively.
With this information, an influence ranking NI and a dependence ranking ND are built by sorting the variables decreasingly according to their influence and dependence. Both rankings serve as a first indicator of the importance of each variable in the system (Villacorta et al., 2014; Asan and Asan, 2007a, b).
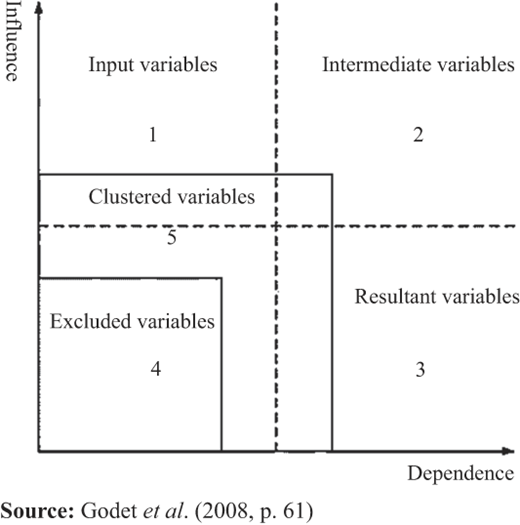
According to analysis and outputs resulted from MICMAC, the chart is a two-dimensional map where the vertical axis represents the degree of influence variables and horizontal axis represents the degree of dependence. The axes divide at four quadrants and five zones; in other words, the variables are located at five zones and are divided in the following five categories (Villacorta et al., 2014; Asan and Asan, 2007a, b; Godet et al., 2008; Saricam et al., 2012):
Input/Influential variables: these variables are inputs, they are located at northwest part of the chart and the most of the system is dependent on them. In fact, the level of influence of these variables on other ones is much higher than the level of their dependency in future. In other words, system is strongly dependent on these variables and they are defined as determinative and key variables of system behavior, and therefore they are called as the main drivers of system.
Intermediate variables: these variables are in the northeast part of chart and can be very influential and very dependent at the same time. Due to their unstable nature, they may have influence on other variables and sometimes even depend on influential variables.
Output/Dependent variables: these are resultants, they are located in southeastern part of the chart and have a low level of influence and high level of dependency. In other words, they are sensitive to influential and intermediate variables’ changes. In addition, they are considered as output variables in the system.
Excluded variables: low level of influence and dependency is considered a characteristic of these variables in the southwestern part of the chart. They are identified as independent variables in the system. These variables seem to be completely out of chart. Basically, they neither can interfere in the system’s function nor use the system. In other words, they have little influence on the system.
Clustered variables: they have been introduced as variables, such that the system cannot make certain decisions about them. In other words, because of their placement in border areas of each four sections, the possibility of these variables joining one of the four sections is high.
3. Methodology
The study period spanned from November 2015 to September 2016. In this work, we focus on perspective structural analysis in the form of CIA (Gordon, 2009). As pointed out previously, the perspective structural analysis is a method that normally developed in three phases: inventory of the variables, describing the relationships between variables and identifying key variable by analyzing the variables and their relationships (Arcade et al., 1993).
3.1 Phase 1: listing the variables
Perspective structural analysis is based on expert’s opinions; thus, identifying people with a good knowledge of each structural analysis was critical. In this regard, a purposive sampling method was used to choose the experts; a purposive sampling is a non-probability sample that is selected on the basis of the characteristics of a population and the objective of the study. This kind of sampling is also as judgmental, selective or subjective sampling. Purposive sampling strategies differ from probability (or random) sampling strategies. Researches must be able to explain the use of purposive sampling in any particular study and discuss the implications for the research results (Devers and Frankel, 2000). The reason for applying a purposive sampling in this paper is selection of a group of experts who have a deep understanding or are information rich in a specific field (Neuman, 2007), and they can provide full insight into the research questions (Devers and Frankel, 2000). Akins et al. (2005) pointed out that panels have been conducted with just about any size. Typical panels seem to fall in the category of 10–100 members and consist of either two or three expert groups, again depending on stakeholder interest (Avella, 2016). Thus, the sampling size of the study consisted of 27 experts as academicians. They were decision-makers, professionals and consultants at the same time, in the fields of tourism, economy, geography and urban and regional planning. These experts were chosen among academic staffs of Tehran University and Science and Culture University (Table AI).
Profile of experts
| Participants | Education | Organizational position |
|---|---|---|
| P1 | PhD in urban planning | Assistant Professor, Faculty of Geography at University of Tehran |
| P2 | PhD student in economic science | PhD Student in Economic Science, Faculty of Economics at University of Tehran |
| P3 | PhD in tourism planning | Assistant Professor, Faculty of Tourism Management at Science and Culture University |
| P4 | PhD in business administration | Associated Professor, Faculty of Tourism Management (marketing orientation) at University of Tehran |
| P5 | PhD in urban planning | Assistant Professor, Faculty of Urban Affairs at University of Tehran |
| P6 | PhD in urbanism and planning offers | Assistant Professor, Faculty of Urban Management at Science and Culture University |
| P7 | PhD in political geography | Assistant Professor, Faculty of Urban Affairs at University of Tehran |
| P8 | PhD in human geography | Assistant Professor, Faculty of Urban Affairs at University of Tehran |
| P9 | PhD in rural geography and planning | Assistant Professor, Faculty of Geography at University of Tehran |
| P10 | PhD in tourism management | Assistant Professor, Faculty of Tourism Management at Science and Culture University |
| P11 | PhD in geography and urban planning | Associate Professor, Faculty of Geography at University of Tehran |
| P12 | PhD in tourism management | Assistant Professor, Faculty of Entrepreneurship at University of Tehran |
| P13 | PhD in tourism management | Assistant Professor, Faculty of Tourism Management at Science and Culture University |
| P14 | PhD in rural geography and planning | Associated Professor, Faculty of Geography at University of Tehran |
| P15 | PhD in tourism management | Assistant Professor, Faculty of Tourism Management at Science and Culture University |
| P16 | PhD in geography and urban planning | Associated Professor, Faculty of Geography at University of Tehran |
| P17 | PhD in tourism management | Assistant Professor, Faculty of Entrepreneurship at University of Tehran |
| P18 | PhD in tourism management | Assistant Professor, Faculty of Tourism Management at Science and Culture University |
| P19 | PhD in tourism management | Assistant Professor, Faculty of Tourism Management at Science and Culture University |
| P20 | PhD in geography and urban planning | Associate Professor, Faculty of Geography at University of Tehran |
| P21 | PhD in tourism management | Associated Professor, Faculty of Entrepreneurship at University of Tehran |
| P22 | PhD in tourism management | Assistant Professor, Faculty of Tourism Management at Science and Culture University |
| P23 | PhD in rural geography and planning | Associated Professor, Faculty of Geography at University of Tehran |
| P24 | PhD in tourism management | Associated Professor, Faculty of Tourism Management at Science and Culture University |
| P25 | PhD in geography and urban planning | Associated Professor, Faculty of Geography at University of Tehran |
| P26 | PhD in tourism management | Associated Professor, Faculty of Entrepreneurship at University of Tehran |
| P27 | PhD in tourism management | Associated Professor, Faculty of Tourism Management at Science and Culture University |
The next step in this phase is compiling a list of the most relevant variables in the system. Generally, list of variables does not exceed 70 or 80 variables (Chine et al., 2017). Then, the final variable list is decided by consensus, and each variable of the research must be clearly defined, characterized and understood by all participants. To achieve the goal of the study, we only need to measure the direct relationships between the indicators; this is achieved through the MICMAC method (Arcade et al., 1993).
3.2 Phase 2: describing the relationships between variables
The data collection tool was a self-developed questionnaire designed in the form of CIA matrix whose variables were determined by the first phase. The variables identified in the first phase were entered in the analysis matrix, and the experts determined the degree of influence/dependency between them. Indexes used in this study cover economic, sociocultural and environmental impacts of tourism. The collected data were categorized on the basis of known factors to understand the level of variables’ impacts on each other and to understand the necessity of systematic analysis in Iran’s long-term planning for tourism. In this phase, strategic variables that contributed to Iran’s tourism development were categorized and analyzed. For this purpose, CIA method using MICMAC method was performed to assess the influences between variables (from 0, no influence, to 3, strong influence) (Dewangan et al., 2015). Figure 2 shows a hypothetical example of analysis matrix for five hypothetical variables, V1–V5; this is an example of an influence interrelation network: Vi → Vj indicates that Vi influences Vj.
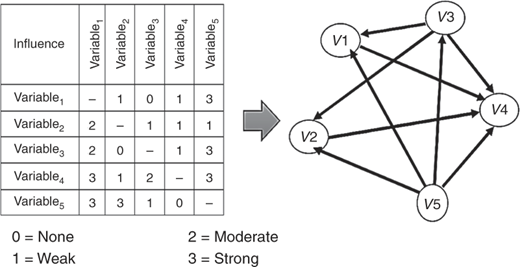
The sign (positive/negative) of each influence is recorded (to be used in the final analysis) but not introduced in the matrix, because this would make the next analysis impossible.
3.3 Phase 3: identifying the roles played by the variables
In this phase of structural analysis, we use the MICMAC software to calculate direct influence and dependence of each variable (the sums of each row and column, respectively). The MDI is then increased to the second, third,…, nth power, until the overall rating of the influence and dependency of the variable remain constant. The outputs of MICMAC show that direct and indirect influence/dependency maps can be plotted, revealing variable clustering. Their positions indicate the different functions played by variables in the system (input/influential variables, intermediate variables, output/dependent variables, excluded variables and clustered variables). These maps show the present and future participants’ understanding of the system and what they perceive as potentialities (variables with high influence and dependence capacity), opportunities (variables with medium influence and dependence capacity) and constraints (variables that cannot be influenced) for change. Structural analysis also identified networks or loops of interrelated variables through the construction of influence graphs (Delgado-Serrano et al., 2016).
4. Finding and discussion
According to Table I, the list of understudied variables for structural analysis (positive and negative tourism impacts on economic, sociocultural and environmental fields) is presented. In other words, in this study, experts initially defined 56 variables to be considered in the analysis, which can be found in Table I; these 56 variables were detected as primary variables and were analyzed by Micmac software. The matrix dimensions for positive economic impacts were (11 × 11), for negative economic impacts were (8 × 8), for positive sociocultural impacts were (10 × 10), for negative sociocultural impacts were (12 × 12), for positive environmental impacts were (6 × 6) and for negative environmental impacts were (9 × 9).
List of variables
| Dimension | Variables | Source |
|---|---|---|
| Economic | V1_Increase in income | Dogru and Bulut (2018), Marzuki (2011) |
| V2_Direct and indirect employment opportunities creation | Deery et al. (2012), Gursoy et al. (2007) | |
| V3_Source of foreign exchange earning | Edwards et al. (2008), Esmaeil Zaei and Esmaeil Zaei (2013) | |
| V4_Investment improvement | Johnson et al. (1994), Liu and Var (1986) | |
| V5_Job diversity and the creation of new business opportunity | Deery et al. (2012) | |
| V6_Helping to boost GDP | Edwards et al. (2008) | |
| V7_Competitiveness | Lee et al. (2003), McGehee and Andereck (2004) | |
| V8_Thriving local market | Edwards et al. (2008) | |
| V9_help in poverty reduction and wealth distribution in better ways | Aref (2011), Goeldner and Ritchie (2012, p. 24) | |
| V10_Infrastructure improvement | Choi and Sirakaya (2006), Marzuki (2011) | |
| V11_Improvement in the quality of life | Marzuki (2011) | |
| V12_increases in the price of real estate and land | Wanwara-Mbugua and Cornwell (2008) | |
| V13_Rise in the cost of living | Easterling (2008), Deery et al. (2012) | |
| V14_Seasonality of tourism and the lack of job security | Wu and Chen (2015), Belisle and Hoy (1980), Sheldon and Var (1984) | |
| V15_Tourism revenue leakage | Tohidy (2011) | |
| V16_Inflation | Lundberg (2016), Wu and Chen (2015), Liu and Var (1986) | |
| V17_Overdependency on tourism without considering other expenses opportunities | Uysal (2015) | |
| V18_Scarcity of some essential commodities in tourist seasons | Wanwara-Mbugua and Cornwell (2008) | |
| V19_Attracting non-local workers for the lack of local’s knowledge and expertise | Uysal (2015) | |
| Sociocultural | V20_Improvement in the quality of educational, recreational, social and health facility | Deery et al. (2012), Zhou (1986) |
| V21_Cultural development and public awareness | Sharpley (1994) | |
| V22_Branding the region | Tosun (2002) | |
| V23_Reduction in migration pressures | Deery et al. (2012) | |
| V24_Identity construction and community attachment | Sharpley (2014), Lin (2001), Drumm et al. (2004) | |
| V25_Exchange and promotion of local culture | Lundberg (2016), Sharma et al. (2008) | |
| V26_Enhancement in the level of safety and security | Hall et al. (2004), Aref (2011), Deery et al. (2012) | |
| V27_Increase in participation and social capital | Jaafar et al. (2017), Williams et al. (1995) | |
| V28_The revival of local values | Burns and Holden (1997) | |
| V29_Creation of desirable image of host community | Chiu et al. (2016), Cui and Ryan (2011), Choi and Sirakaya (2006) | |
| V30_Increasing social gap phenomenon | Goeldner and Ritchie (2012) | |
| V31_High population, density, overcrowding and increase the volume of traffic | Andereck et al. (2007), Goeldner and Ritchi (2012) | |
| V32_ Reducing mental capacity of Iran’s tourist destinations | Dyer et al. (2007) | |
| V33_Increase in social disorders | Deery et al. (2012), Getz (2008) | |
| V34_Changing the demographic composition | Jackson and Inbakaran (2006) | |
| V35_Increase in health problems | Choi and Sirakaya (2006) | |
| V36_Distortion of local values | Wu and Chen (2015) | |
| V37_Increase in problems of local residents to use public services and facilities | Deery et al. (2012); Getz (2008) | |
| V38_Consumerism | Dogan (1989), Wanwara-Mbugua and Cornwell (2008) | |
| V39_Demonstration effects | Cui and Ryan (2011) | |
| V40_Commodification of the culture | Burns and Holden (1997) | |
| V41_Weakening the social philanthropy relationships | Perez and Nadal (2005) | |
| Environmental | V42_Increase in environmental awareness | Chiu et al. (2016) |
| V43_Promotion of green architecture | Holden (2009), Chiu et al. (2016) | |
| V44_Improvement of the quality of the environment | Inskeep (1991) | |
| V45_Increasing the level of green zones such as parks etc. | Deery et al. (2012), Zhou (1986) | |
| V46_Management of waste products | Holden (2009), Vishwanatha and Chandrashekara (2014) | |
| V47_Prohibited area and protected areas to attract more tourists | Holden (2009), Vishwanatha and Chandrashekara (2014) | |
| V48_Increasing air and water pollution | Inskeep (1991), Rizal and Asokan (2014), Zhou (1986) | |
| V49_Noise and visual disturbance (visual pollution) and olfactory pollution | Rizal and Asokan (2014), Zhou (1986) | |
| V50_Destruction of natural and historical resources due to uncontrolled tourism development | Deery et al. (2012), Easterling (2008) | |
| V51_Open spaces reduction due to uncontrolled construction | Choi and Sirakaya (2005), Easterling (2008) | |
| V52_Increase in waste generation | Choi and Sirakaya (2006), Marzuki (2011), Rizal and Asokan (2014) | |
| V53_Soil erosion and landslides density and compactness of the soil surface | Andereck (1995), Getz (2008), Rizal and Asokan (2014) | |
| V54_Reduction of natural resources per capital | Andereck (1995), Easterling (2008) | |
| V55_Reduction of physical capacity of the tourist destinations | Getz (2008) | |
| V56_Ecosystem degradation and vegetation destruction (flora and fauna destruction) | Andereck (1995), Zhou (1986) |
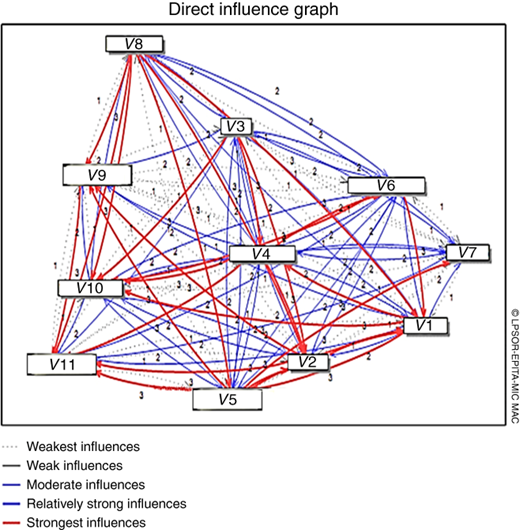
According to the nature of plotted maps (Figure 3) and identified networks or loops of interrelated (influence graphs) (Figure 4), the tourism system and its related variables are given as follows.
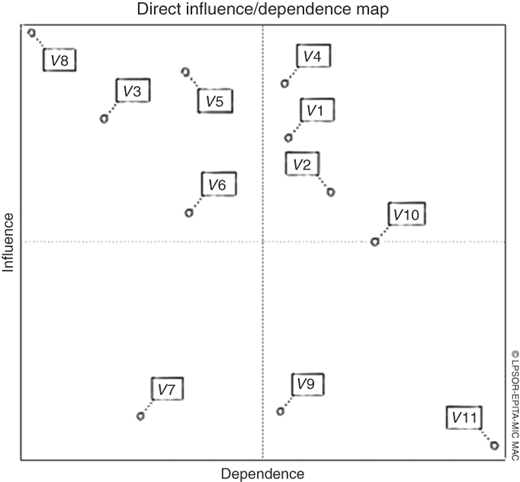
Input variables in northwestern part including source of foreign exchange (V3), earning job diversity and the creation of new business opportunity (V5), helping to boost GDP (V6) and thriving local market (V8) are considered as determinative and influential variables that influenced many other economic variables in the system. On the other side of this table and in its northeastern part of the map, intermediate or strengthening variables including increase in income (V1), direct and indirect employment opportunities creation (V2), investment improvement (V4) and infrastructure improvement (V10) are found. These variables in some cases can have influence even on influential variables. Among this group of variables, improvement of investments and income increase because of their own unstable characteristic and potential to change into variables playing the main role in the system are considered as a potential breakpoint for the system. Due to these characteristics, risk variables are their secondary name. In addition, the creation of job opportunities and infrastructure improvement variables are considered as target variables and from a systematic plan as intended variables. Both of them can be considered crucial factors in the way of sustainable tourism development of the Iran. These variables instead of predetermined goals indicate general goals for the whole system. In southeastern part of the map, assistance in poverty reduction and wealth distribution in better ways (V9) and improvement in the quality of life (V9) can be seen as output variables of the system. These variables have a high level of dependency and low level of influence. In other words, they have a special sensitivity toward the changes occurring in influential and intermediate variables. In southwestern part, there are variables that have least dependence and influence that seem to be out of system and have the least interference in the future of system. Competitiveness (V7) in Iran tourism industry has this characteristic.
According to systematic relations between variables related to positive economic impacts of tourism system, these variables can be shown in an identified network or loop of interrelated (influence graphs) (Figure 4). Based on what is shown in this graph, most of the variables have a mutual relationship with each other. Only in cases such as source of foreign exchange (V3), poverty decrease, wealth distribution (V9), strong and strongest direct influences do not exist, and these variables have weak and weakest direct influences.
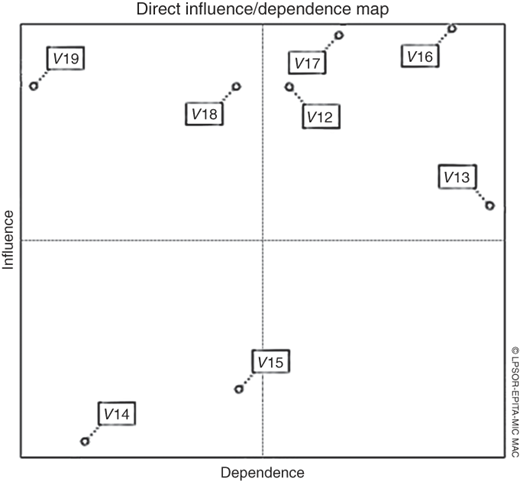
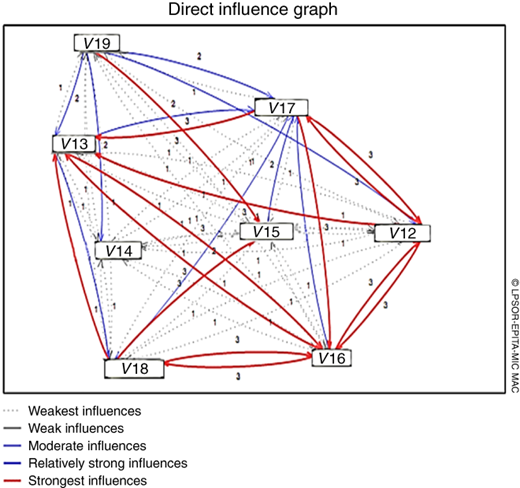
The negative economic status and impact of tourism is show in Figure 5. Input variables in northwestern part of the map including scarcity of some essential commodities in tourist seasons (V18), attracting non-local workers for the lack of local’s knowledge and expertise (V19), represent influential variables. In northeastern part of the map, variables like increases in the price of real estate and land (V12), raising the costs of living (V13), inflation (V16) and overdependency on tourism without considering other expenses opportunities (V17) are considered as intermediate variables. Among these, variables such as overdependency on tourism without considering other expenses opportunities, inflation and increase in land price have a high potential to become main variables and are specified as risk variables. In addition, raising the costs of living is recognized as a target variable. As Figure 5 demonstrates, there is no variable in southwestern part of the map. In other words, no variable can be found that has a special sensitivity toward changes in influential and intermediate variables. In southwestern part, variables with the least influence and the least dependence can be seen. These variables, somehow, have the least interference in the system work. Seasonality of tourism and the lack of job security (V14) and tourism revenue leakage (V15) are present in this area of the system’s map. Figure 6 demonstrates the existing interrelationships between variables in form of a graph, and it represents the intensity of mutual relations between variables.
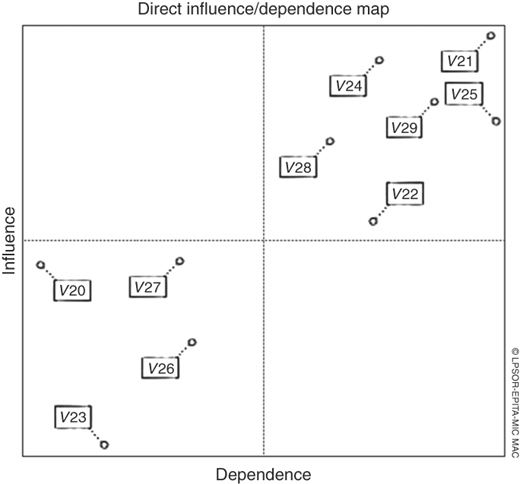
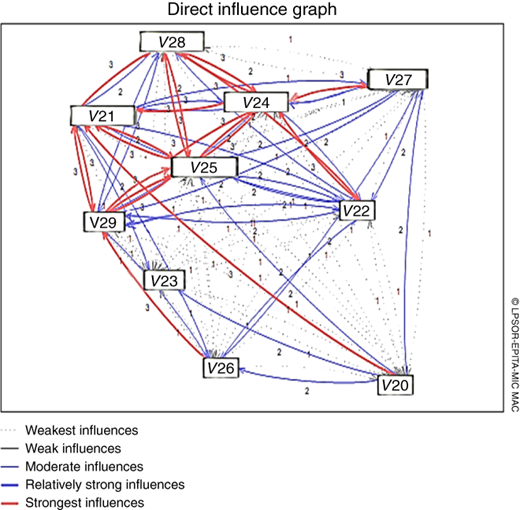
According to outputs (positive sociocultural variables) gained from MICMAC software in Figure 7, there is no influential or dependent variable in northwestern and southeastern of the map. In northeastern part, variables like cultural development and public awareness (V21), branding the region (V22), identity construction and community attachment (V24), exchange and promotion of local culture (V25), the revival of local value (V28) and creation of desirable image of host community (V29) are considered as intermediate variables. In addition, creation of a desirable image of host community is specified as a risk variable and region branding as a target variable. In southwestern part of the map, reduction in emigration pressures (V23) is considered as a negligible variable. From the system stability perspective, the distribution in the risk line of the map shows unstable conditions and unexpectedness of system behavior. Therefore, this manner of distribution and placement can be defined as an unstable system. Also, Figure 8 represents the interrelationships of many variables as having mutual and strongest strong/influence. Among those some variables such as reduction in emigration pressures, enhancement of the level of security and safety, improvement in the quality of educational, recreational, social and health facility have weakest influence on each other and another variables.
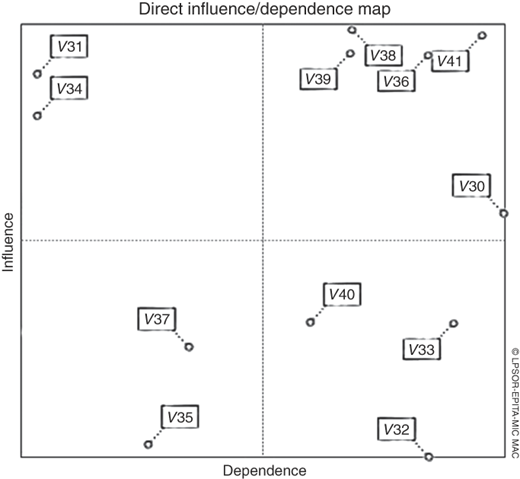
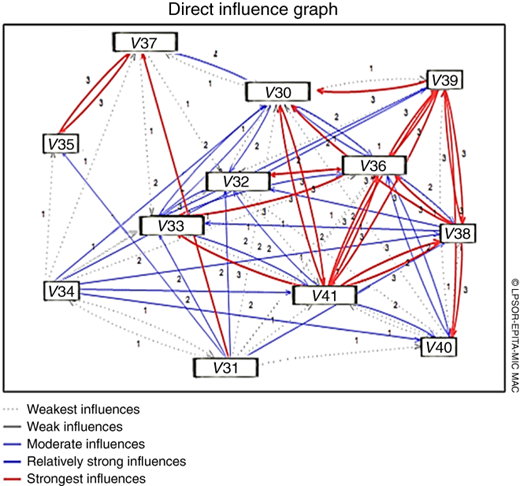
In Figure 9, high population density, overcrowding and increase in the volume of traffic (V31) and change in the demographic composition (V34) are considered as influential variables. Increasing social gap phenomenon (V30), distortion of local values (V36), consumerism (V38), demonstration effects (V39) and weakening of the social philanthropy relationships (V41) are highlighted as intermediate variables. Among them, increasing social gap phenomenon is specified as a target variable. The reduction in the mental capacity of Iran’s tourist destinations (V32), increase in social disorders (V33) and commodification of the culture (V40) are specified as dependence variables of the sociocultural negative impacts system. Furthermore, two variables – increase in health problems (V35) and increase in the problem of local residents to use public services and facilities (V37) – are recognized as negligible variables. Figure 10 demonstrates the interrelationships of the variable of sociocultural negative impacts system. Variables such as high density of population, increase in local community problems, change in population composition and increase in social disorders have strong/strongest influence.
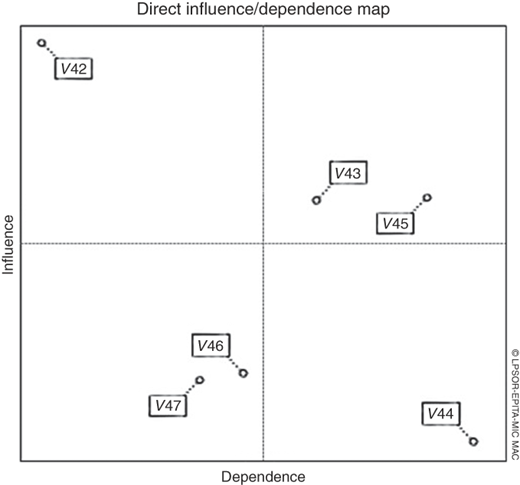
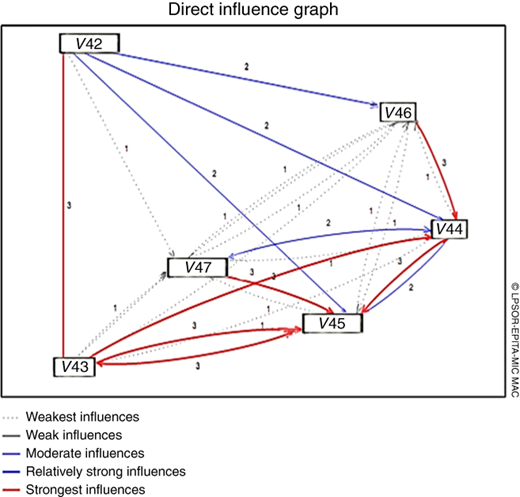
Based on outputs, positive tourism environmental variables are represented in Figure 11. Results showed that the system is partly stable. In other words, increase in environmental awareness (V42) and improvement of the quality of the environment (V44) were introduced as influential and dependent variables, respectively. In addition, promotion of green architecture (V43) is specified as a risk variable. In this system, increasing the level of green zones, such as parks, etc., (V45), is highlighted as a target variable. Furthermore, management of waste products (V46) and creation of hunting prohibited area and protected areas to attract more tourists (V47) were recognized as independent (negligible) variables. Figure 12 states that an increase in environmental awareness, improvement of the quality of the environment, promotion of green architecture and an increase in the level of green zones, such as parks, are the variables that have strong/strongest influence.
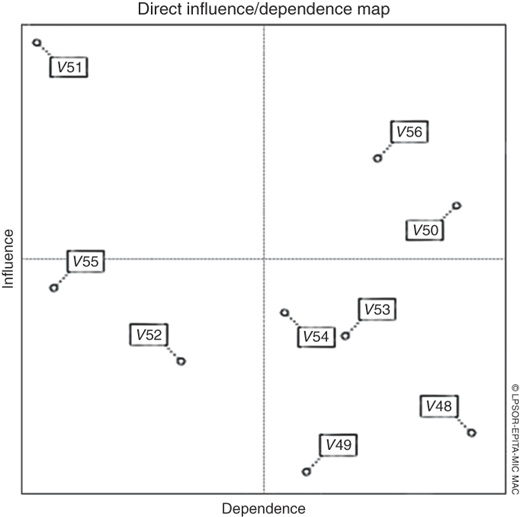
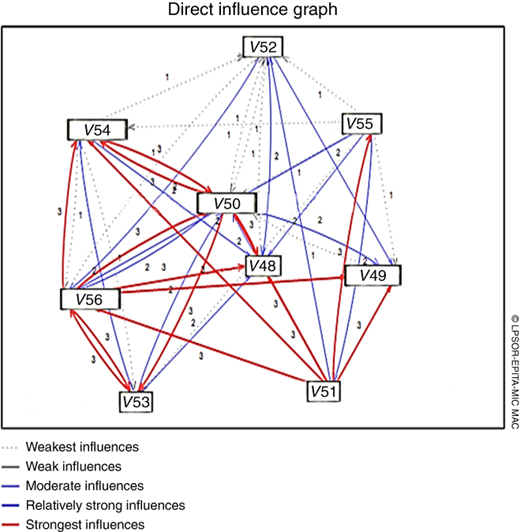
Finally, Figures 13 and 14 explain the negative environmental impacts system in Iran. As shown by spotted map, the open spaces reduction due to uncontrolled construction (V51) is specified as an influential variable. Furthermore, the decrease of national resources per capita and increase of different pollutions were identified as dependent variables. The destruction of natural and historical resources due to uncontrolled tourism development (V50) and ecosystem degradation and vegetation destruction (V56) are specified as intermediate variables (risk variable and target variable, respectively). On the contrary, the decrease in physical tolerance capacity is identified as secondary leverage and soil density and erosion (V53) and also an increase in waste generation (V52) are specified as independent variables. Figure 14 shows that the interrelationships between variables have a strong/strongest influence.
5. Conclusions
In this study, a novel methodology has been presented with a long-term planning in the form of structural analysis. The purpose of structural analysis is to explore the key variables of a system and identify their influence or dependency, thereby playing role in reducing system complexity, and subsequently, it can be helpful to consider the future of evaluating strategic decisions (Benjumea-Arias et al., 2016).
To study the future of tourism system and to set a propitious long-term planning, we should consider the concept of system; system theory is relatively a comprehensive approach to understand and analyze tourism phenomenon and to plan tourism more dynamically. In this approach, sections and factors having influence on tourism like tourists, host communities, relevant companies and organizations, environment, etc., can be examined and analyzed in an appropriate way. In other words, the system approach reflects the reality and nature of tourism as a coherent whole and discusses the connection between components and elements of supply section in tourism. Anyway, looking into Millennium Development Goals in 2000 and Sustainable Development Goals in 2015, the importance of systematic view in tourism development and its impacts can be easily understood. Doubtlessly, tourism and its related activities, besides irrefutable positive impacts, have negative dimensions and impacts. The positive impacts should be maximized and the negative impacts should be minimized with help of planning. However, the following question arises: what Iran pays attention to in its economic dimensions, especially positive impacts of tourism? This is due to weakness in economic system structure, considerable population migration from village to city and even from small cities to big cities, emergence of different challenges like unemployment, crimes, social disorders, traffic, boost in expansion of unauthorized residents, destruction of environmental resources, etc. In this study, what has been put under scrutiny is systematic view − of course not comprehensive − of variables related to both positive and negative aspects of economic, sociocultural, and environmental impacts. Maybe this study has been able to answer the following question: “how can we manage and organize tourism in a way to have the least negative impacts in aforementioned fields?” As it can be seen in Table I, the most important negative and positive impacts (variables) are categorized in three indicated fields. Based on examinations done in the economic field, the most important positive influential impacts include source of foreign exchange earnings, job diversity and the creation of new business opportunity, helping to boost GDP and thriving of local market. Among these variables, local market thriving has higher level of importance, as it is recognized as a discouragement for emigrating inside and outside of tourist destinations. In fact, all aforementioned impacts (variables) have interrelationships with each other and they create the butterfly effect, so that thriving of local market can lead to new employment opportunities, for establishing new small businesses and creation of some new services. The distribution of variables within the graphs represents the stability and instability of every system. Variables shown in (L) form represent a stable system, and this state of system shows stability in influential variables and continuity of their influence on other variables. If the variables are distributed in (diamond) form like the right graph, the system is unstable, and a lack of influential variables threatens the system.
When the positive economic impacts are examined, variables distribution model represents a relative stable system; however, variables like investment improvement, income increase, job creation and infrastructures development are in an unstable state. Concerning negative economic impacts, attracting non-local work force and scarcity of some necessary products were recognized as the key influential factors. Variables distribution showed an unstable system in negative economic impacts of tourism. In this regard, variables like land commodification, rise in inflation and increase in living costs can be mentioned.
In the field of positive sociocultural impacts, cultural development, increase in people’s awareness, identity construction and community attachment, community belonging, and reviving local values were specified as intermediate factors. The distribution of positive sociocultural impacts showed a complete unstable system, and this fact indicated an uncertain influence and a dependency of variables in this field. In the field of negative sociocultural impacts of tourism, high density of population, congestion and crowdedness along with influential change in demographic composition were specified as influential factors. Planning for identified areas can surely eliminate some tourism negative impacts in sociocultural field. The existence of some variables like distortion of local values, consumerism, demonstration effect and social gap increase is strongly in a intermediate state, and this fact has made the system behavior unpredictable.
In the field of positive/negative environmental impacts, a relative stable system can be seen. From the positive impacts’ perspective, the increase in people’s awareness about environment was identified as a positive influential variable. From the negative impacts’ perspective, the destruction of natural and historical resources due to uncontrolled tourism development and open spaces reduction due to uncontrolled construction were identified as negative influential impacts. According to the findings of this research, tourism in Iran from the perspective of sociocultural impacts’ system is strongly unstable. This issue is clearly visible in tourism destinations. The enormous role of long-term planning for the optimization of actions and considering the key variables of the system might improve the future of the sociocultural system.
Finally, we are cautiously optimistic about the future use of the method and its potential contribution to sound sustainable development of tourism in these communities. The bases have been established and the decision-makers have shown their agreement and confidence in the process and the results.
5.1 Implications and limitations
The theoretical and practical limitations of the research are all issues that have been challenged in front of researchers during the research. Based on the research, important and influential limitations of this study are as follows:
The present study is the first study that has tried to forecast the tourism’s impacts in the form of structural analysis. Therefore, the lack of similar research in the field of tourism has prevented the researchers from being aware of the problems of doing such work.
As with any method that is the favored approach of the group, by applying structural analysis, the authors must note that a precise choice of participants is a critical step for employing this technique. Therefore, by dominating competencies within the group, the results can be strongly biased, and in this regard, setting up a multidisciplinary team is necessary. In other words, implementing a structural analysis is a rather big operation necessitating experts’ availability. So finding out experts who have enough knowledge about tourism science and future studies methodology, especially CIA, was the main challenge in front of researchers.
In this analysis, process must be stressed that the group can always make collective mistakes.
5.2 Suggestions
The research suggestions will improve the management and planning of tourism in Iran. Therefore, this research offers suggestions to the ICHTO[2]. Based on the research, we have put forward the following suggestions:
First, the ICHTO must adopt a strategic approach about the tourism. If the decision-makers have deep awareness regarding positive and negative impacts of tourism, they definitely will pay more attention to the programs and policies, because the necessity of attention to the tourism industry is evident in all documents of the organization’s vision and mission.
By attracting the tourism expert labor in ICHTO and relevant organizations, the tourism planning will be done with more expertise and seriousness. Therefore, the adopted programs and policies will have an effective performance.
Cooperation and special partnership of tourism between responsible and operating organizations will result in having fewer challenges in implementation of tourism programs and strategies.
Appendix
Notes
World Tourism Organization.
Iran Cultural Heritage, Handicraft and Tourism Organization.

