Covid-19 pandemic is a unique and extraordinary situation for the globe, which has potentially disrupted almost all aspects of life. In this global crisis, the tourism and hospitality sector has collapsed in almost all parts of the world, and the same is true for India. Therefore, this paper aims to investigate the impact of Covid-19 on the Indian tourism industry.
This study develops an appropriate model to forecast the expected loss of foreign tourist arrivals (FTAs) in India for 10 months. Since the FTAs follow a seasonal trend, seasonal autoregressive integrated moving average (SARIMA) method has been employed to forecast the expected FTAs in India from March 2020 to December 2020. The results of the proposed model are then compared with the ones obtained by Holt-Winter's (H-W) model to check the robustness of the proposed model.
The SARIMA model seeks to manifest the monthly arrival of foreign tourists and also elaborates on the progressing expected loss of foreign tourists arrive for the next three quarters is approximately 2 million, 2.3 million and 3.2 million, respectively. Thus, in the next three quarters, there will be an enormous downfall of FTAs, and there is a need to adopt appropriate measures. The comparison demonstrates that SARIMA is a better model than H-W model.
Several studies have been reported on pandemic-affected tourism sectors using different techniques. The earlier pandemic outbreak was controlled and region-specific, but the Covid-19 eruption is a global threat having potential ramifications and strong spreading power. This work is one of the first attempts to study and analyse the impact of Covid-19 on FTAs in India.
1. Introduction
People lived in a mobile world and assumed that they maintain the status quo in mobility until Covid-19 arrived (Baum and Hai, 2020). With the international spread of severe acute respiratory syndrome coronavirus 2 (SARS-CoV2), inconceivable has happened, and this pandemic is threatening the lives and lifestyles of millions of people. As a consequence, most of the countries have declared lockdowns as a preventive measure for social distancing in order to cater for the spread of Covid-19 (Khan et al., 2021).
The lockdown has shaken the economy by hitting different economic sectors, especially the tourism industry, which has collapsed over the days (Chinazzi et al., 2020; Murray, 2020). As the movements are ceased within and outside India, it has directly impacted the transport sectors such as aviation, railways and other modes of transports; this grinding halt has a profound impact on the hospitality industry (Sheller, 2020). As the travels are restricted, cancellation of sporting events and the prohibition on gathering have occurred. Airlines are grounded, and other modes of land transportations are at standstill; even business meetings and conferences are postponed, cancelled or done through online mode that brings about a huge reduction of activities in all dimensions of the hospitality industry (Higgins-Desbiolles, 2020). All the facets of the tourism industry have catapulted into a collapse of the entire sector (Ellis, 2020).
India's tourism industry is one of the crucial sectors of the Indian economy. India attracts a large number of foreign tourists every year. The percentage of foreign tourist arrivals (FTAs) is increasing since the last decade (Annual Report, 2019–20). India is famous for its warm welcome, hospitality, different lifestyles, cultural heritage and varied geography (Goswami, 2018). The attraction for foreign tourists is heritage buildings; temples and other religious buildings; coastal areas and beaches; yoga, Ayurveda and natural health resorts; and spiritual and religious tourism (Annual Report, 2019–20). As many religious shrines in India are visited regularly; with industrialization and economic growth, domestic tourism sees a rise in sightseeing and adventure sports (Kumar, 2020).
The Indian tourism sector is adversely affected by Covid-19 since March 2020. On 24 March 2020, the government of India imposed a nationwide lockdown. India suspended all tourist visas from 13 March 2020 until 15 April 2020 (The Hindu, 2020). Nevertheless, this timeline is changed from time to time and imposed different restrictions with terms and conditions.
The Indian tourism industry is likely to be affected in terms of FTAs and consequent revenue loss due to the ongoing Covid-19. These extreme circumstances have motivated us to conduct this study and attempt to answer the following research question:
What are the expected losses of the Indian tourism industry in terms of FTAs?
Based on the research question, the following research objectives are formulated:
Develop an appropriate model and predicting the FTAs.
Estimate the anticipated losses of the Indian tourism industry.
Recommendation to the government and industry professionals to reduce the loss.
The rest of the research work is organized as follows: Section 2 provides the background of the study. Section 3 describes the implemented methodology. Section 4 deals with the data analysis. Section 5 presents the discussion and highlights the major findings. Section 6 describes the recommendations for government and industries. Section 7 provides the conclusion, limitations and scope for the future research.
2. Background of the study
Tourism is delicate and seasonal, and it depends on travellers’ personal preferences, motivation and financial conditions. Due to these factors, tourism and their associated activities have experienced several crises before Covid-19, such as the West Africa Ebola in Sierra Leone region impacted severely on tourism arrivals by 50% in 2013–2014 (WTTC, 2018), and a similar case was also reported in Hong Kong due to outbreak of SARS and found 68% loss of visitor arrivals in May 2003 (HKTB, 2002–2003).
In the recent study, panel regression models are used to establish the relationship between Covid-19 effects and arrivals of international tourists in four Asia-Pacific Economic Cooperation economies (Tran et al., 2020). A similar study has been conducted to build a prediction on seasonal ARIMA model for traveller arrivals to China and examined the significant impact of the SARS incident (Chen et al., 2007). Very few researchers studied thoroughly such health-related crises in this hospitality and tourism industry (Oxford Economics, 2020). Therefore, some more studies are required to deal with this multiplex situation.
However, the Covid-19 pandemic is of the highest magnitude in the last 100 years. The outbreak of Covid-19 has been considered a watershed moment for economic activities and industrial sectors. This outbreak severely affected almost all the industrial sectors and seriously affected the tourism and hospitality industry in India. The tourism industry is one of the largest service sectors, including hospitality, transportation, food and beverage and associated tourism products (Franks, 2020). It provides an opportunity to participate in commercial activities to small- and medium-scale entrepreneurs and employ vast numbers of skilled, semi-skilled and unskilled workforce. Due to the shutdown of the tourism industry, some developing and underdeveloped economies are crumbled and face enormous loss in terms of income and employment.
Further, the tourism industry as compared to others industries will take relatively more time to restore its former glory. The World Tourism Organization (WTTC, 2020) claimed “ours has been the sector hardest hit by the crisis and has proposed an agenda for recovery”.
In a short time, Covid-19 has challenged human mobility and has put many people in temporary lockdowns leading to a halt to the global tourism movements. World Travel and Tourism Council (WTTC, 2020) predicted 100.8 million job losses in the tourism sector due to the Covid-19 pandemic, which is 31% of the total jobs in this sector. This industry generated 10.3% of the global economy's GDP, which is expected to reduce by 31% (WTTC, 2020; Benvenuto et al., 2020). The Indian tourism industry is one of the significant contributors to GDP as well as an employment provider (Annual Report 2019-20). In 2019, the tourism industry contributed 6.9% of India's GDP and 8% of its total employment (WTTC, 2020). This industry has healthy growth and is expected to grow at an annual rate of 3.5% (WTTC, 2020).
3. Methodology
The objective of the undertaken study is to assess the impact of the ongoing pandemic on FTAs in India. These types of studies are analysed by using different techniques and the adopted methods depend on different factors, i.e. availability of data sets, context of the forecast, period to be forecast and also time availability for analysis (Chambers et al., 1982). The data sets available in the current work are univariate and seasonal. For such data sets and short-term forecast, seasonal ARIMA and Holt-Winter's (H-W) method are adopted in the current study. As there are no exogenous inputs available in the data sets, nonlinear autoregressive with exogenous inputs cannot be used. If the nonlinear autoregressive (NAR) method is employed in such situations, then the prediction may mislead or overfit due to lack of data sets.
The impact of the ongoing pandemic on FTAs required the past data pattern to find out the future trend in FTAs and is considered a short-term forecast. In the present work, the number of the parameter is only one (i.e. monthly data of FTAs), and by decomposing this data, seasonality and upward trend are found as mentioned in the Data analysis section. For such conditions, seasonal autoregressive integrated moving average (SARIMA), artificial neural network (ANN) and H-W forecasting models can be used. As we have a small size data set, ANN cannot be adopted for such data sets (Heaton, 2008). Further, if the NAR method is employed, then the model remains to overfit and the prediction may mislead due to the lower number of data is available. Therefore, SARIMA and H-W models seem to be a better option for the forecasting of FTAs. Further, the performance of the SARIMA and H-W forecasting model is compared based on mean absolute percentage error (MAPE), mean absolute deviation and root mean square error (RMSE) to predict FTAs in the financial year of 2020–2021 accurately. The steps of the adopted forecast models are discussed in the upcoming section.
3.1 SARIMA
It is an extension of the ARIMA model developed by Box–Jenkins. If the seasonal part is included in the ARIMA model, then it is termed SARIMA. The general notation of seasonal ARIMA is as follows:
An ARIMA (p, d, q) (P, D, Q), (p, d, q) terms depict non-seasonal and (P, D, Q)s is the seasonal part of the model.
where,
p = non-seasonal AR order,
P = seasonal AR order,
d = non-seasonal differencing,
D = seasonal differencing,
q = non-seasonal MA order and
Q = seasonal MA order.
The SARIMA model in generalized form can be written as (Wei, 2006; Box et al., 2008; Cryer and Chan, 2008) follows:
where,
Non-seasonal AR: .
Seasonal AR: .
Non-seasonal MA: .
Seasonal MA: .
B = backward shift operator.
Zt = current time series observed.
at = white noise or random process with zero mean.
For building an ARIMA model, Box–Jenkins suggested three main stages are following (Box et al., 1996):
Identification: It involves plotting time series data; computes autocorrelation function (ACF) and partial autocorrelation function (PACF) and go for stationarity test to find the necessity of difference.
Estimation: It incorporates the estimation of parameters of the model, p-value for AR, MA order suitability and finds the standard error with Akaike information criterion (AIC) or Bayesian information criterion (BIC) values.
Diagnostic checking: It deals with the analysis of residual and overfitting of data. In the residual analysis, go for the Ljung-Box Q (LBQ) test for residual autocorrelation and residual quantile–quantile (Q-Q) plot for normal distribution. If the model is not up to the mark, go for the initial step and follow the same procedure for any improvement.
3.2 Holt-Winter's method (H-W)
H-W method is used when series shows a seasonal pattern with or without trend and gives short- to medium-range prediction. It gives decreasing weights to previous or older data, and for weightage, three smoothing parameters α, β and γ are engrossed for level, trend and seasonal component, respectively. All the three parameters are constrained as 0 ≤ α, β, γ ≤ 1.
This method is categorised as an additive or multiplicative based on how seasonality is modelled.
Multiplicative method: This H-W method is so-called because trend is multiplied by seasonality component. The following equations describe this method (Makridakis et al., 2008, p. 165):
where,
Lt = level component at time t,
bt = trend component at time t,
St = seasonal component at time t,
s = seasonal period,
Ft + m = prediction for m ahead period and
α, β, γ represent weightage for level, trend and seasonal component, respectively.
Additive method: This method is applied when the seasonal pattern's magnitude does not vary as the series changes its nature. In this approach, the trend and seasonality are additive as shown in the following equations (Makridakis et al., 2008), and this method gives prediction equivalent to an ARIMA (0, 1, s + 1) (0, 1, 0)s model (Makridakis et al., 2008):
4. Data analysis
As the methodology suggested, SARIMA modelling is conducted in three steps. It applies the data of monthly tourist arrivals in India from January 2014 to February 2020. The data are obtained from the Ministry of Tourism, India.
Data set division: The data set of the monthly tourist is taken from FTAs from January 2014 to February 2020. The obtained data are classified into a train and test group. The training data set is approximately 81% (60 months), from January 2014 to December 2018, and the testing data set is 19% (last 14 months), from January 2019 to February 2020.
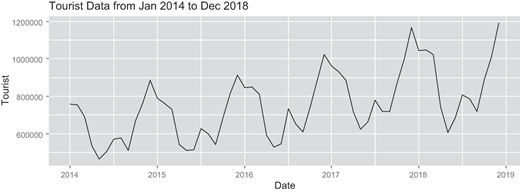
Construction and decomposition of time series: The training data set is converted into a time series data set for applying the steps of the SARIMA model. Figure 1 shows the tourist's monthly arrival from January 2014 to December 2018.
Further, this data set is decomposed for a better understanding of the time series. In this study, classical decomposition by an additive method with a seasonal period of 12 is used. The decomposition function in R software divides time series into observed, trend, seasonality and remainder components, as shown in Figure 2.
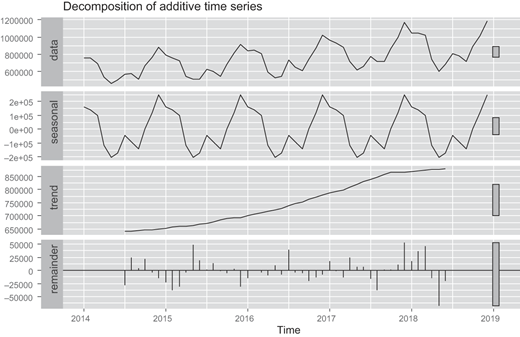
The monthly arrival of the tourist is decomposed into three components with respect to time. The first component is the seasonal components that describe the seasonal behaviour and is shown in Figure 2. The second component is the trend, which represents the upward or downward nature of time series. It is evident from Figure 2 that the arrival of the tourist having an upward trend, which means the tourist arrival is increasing over time. The third component is the remainder, which reflects noise or irregular patterns in time series, that is attained after the removal of seasonal and trend components with respect to time. From decomposition analysis, FTAs have seasonal and upward trending patterns with respect to time, so either the SARIMA or H-W method can be employed.
3. Prediction model formation
In this study, Box–Jenkins method for SARIMA is employed. In order to apply according to Box–Jenkins method, the given time series must be stationary. To test the stationarity of the tourist arrival time series data, the augmented Dickey–Fuller test is conducted. The hypothesis of the augmented Dickey–Fuller test describes as follows:
Null hypothesis: Time series (FTAs) contains a unit root or non-stationary and expressed as follows:
Alternate hypothesis: Time series (FTAs) contains stationary and expressed as follows:
The result of the augmented Dickey–Fuller test is provided in Table 1.
Augmented Dickey–Fuller test and ARIMA model with BIC values
| Augmented Dickey–Fuller test | |||
|---|---|---|---|
| Null rejected | p-value | Test statistic | Lag order |
| True | 0.01 | −4.4691 | 3 |
| ARIMA model with BIC values | ||
|---|---|---|
| S. No | Model | BIC value |
| 1 | ARIMA (2,1,2) (1,1,1) [12] | 1137.033 |
| 2 | ARIMA (0,1,0) (0,1,0) [12] | 1128.19 |
| 3 | ARIMA (1,1,0) (1,1,0) [12] | 1125.892 |
| 4 | ARIMA (0,1,1) (0,1,1) [12] | 1123.946 |
| 5 | ARIMA (0,1,1) (0,1,0) [12] | 1122.319 |
| 6 | ARIMA (0,1,1) (1,1,0) [12] | 1123.911 |
| 7 | ARIMA (0,1,1) (1,1,1) [12] | 1127.75 |
| 8 | ARIMA (1,1,1) (0,1,0) [12] | 1125.399 |
| 9 | ARIMA (0,1,2) (0,1,0) [12] | 1125.413 |
| 10 | ARIMA (1,1,0) (0,1,0) [12] | 1126.401 |
| 11 | ARIMA (1,1,2) (0,1,0) [12] | 1129.774 |
The Augmented Dickey–Fuller test concludes that the time series is stationary and ready for ARIMA modelling. Therefore, auto. arima() function is applied that returns the best model based on the minimum BIC or AIC value. Table 1 shows the results of ARIMA modelling.
On the basis of minimum BIC value, best model is ARIMA (0,1,1) (0,1,0) [12]. After the identification of the best model, the estimates of the model are calculated and shown in Table 2.
Model estimation and Ljung–Box test results
| Model estimation | ||||||
|---|---|---|---|---|---|---|
| ARIMA model | Coefficient MA(1) | Std. error | Variance(σ2) | AIC value | BIC value | Log likelihood |
| (0,1,1) (0,1,0) [12] | −0.5618 | 0.1362 | 1.183e+09 | 1118.62 | 1122.32 | −557.31 |
| Ljung–Box test results | |||||
|---|---|---|---|---|---|
| Q* | DF, model DF | Total lags used | Significance level | p-value | Null rejected |
| 19.433 | 11,1 | 12 | 0.05 | 0.05375 | False |
Model Fitting Test: In order to check the model fitness, the Ljung–Box test is conducted. The hypothesis of the Ljung–Box test is as follows:
Null Hypothesis: The first m autocorrelations of the residuals are jointly 0.
Alternative hypothesis: Autocorrelations of residual is not zero.
After conducting the Ljung–Box test, the result is compiled and shown in Table 2.
From the Ljung–Box test, p-value is 0.05375, which signifies that the null hypothesis cannot be rejected for the first 12 lags and different values of p above the 5% significance level. Hence, null hypothesis is accepted, which means autocorrelations of the residuals are jointly 0.
From Figure 3, in ACF of the residual diagram, it clearly shows that residuals are not correlated except for some points at Lags 7 and 14. Also, in Figure 3 of residuals, a histogram shows that residuals follow a normal distribution.
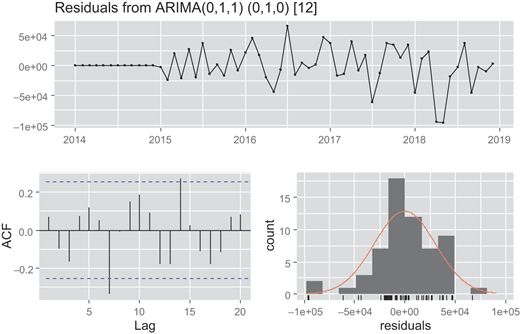
From the first figure, the Residuals vs Time plot depicts no pattern in it. Hence, forecasted values are acceptable.
4.1 Holt-Winter's method approach
In the formation of H-W method applied for additive as well as multiplicative seasonality and estimate parameters of exponential smoothing coefficient alpha, beta and gamma with optimal values on minimum squared one-step prediction error basis. Estimated parameters of additive and multiplicative are shown in Table 3.
Estimated parameters of exponential smoothing (additive) and (multiplicative)
| S. No | α | β | γ |
|---|---|---|---|
| 1. (Additive) | 0.336828 | 0.003748 | 1 |
| 2. (Multiplicative) | 0.1848 | 0.1253 | 0.5147 |
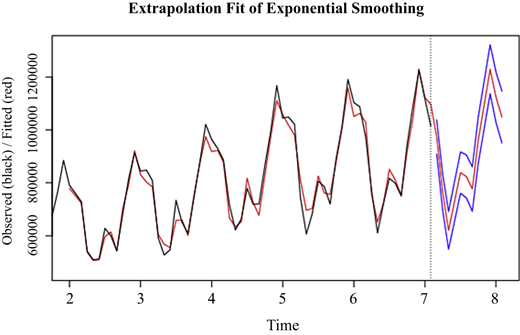
H-W method of additive seasonality gives better results based on measured error performance of MAPE value of 3.12, and the RMSE value is 37,074.26 as compared to the multiplicative method's MAPE and RMSE value of 3.25 and 37,521.731, respectively.
From Figure 4, additive exponential smoothing is extrapolated within 95% upper and lower bound (blue colour). It seems to follow the observed previous data evenly.
4.1.1 The goodness of fit
The measure of how well the performance is shown by the residual depicts the best-fitted time series model.
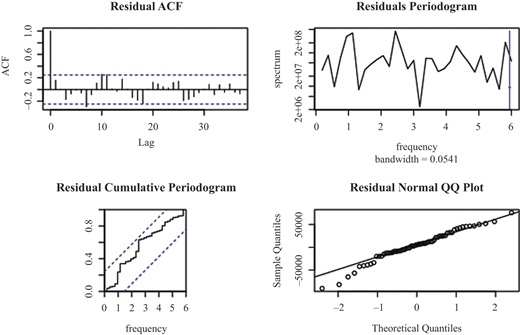
In Figure 5, the ACF plot of residual depicts no significant residual for a 5% significance level shown by the blue dotted line except at Lag order 7. In the residual cumulative diagram, an integrated periodogram fall within 95% bound is shown dotted blue colour line signifies residuals are random and appear to be white noise. For residual normal Q-Q plot, residual follows normal distribution as close to the line with some curvature away initially.
5. Model evaluation and forecast values
In this section, univariate time series models are finally chosen based on the measured error performance of MAP, RMSE and mean absolute error (MAE). As per earlier discussions, these measured errors are evaluated for testing of data sets of FTAs. Based on the minimum values of MAP, RMSE and MAE, obtained results are tabulated in Table 4.
Error values for different models
| Model | RMSE | MAPE | MAD |
|---|---|---|---|
| ARIMA (0,1,1) (0,1,0) [12] | 36,612.28 | 2.95 | 28,513.88 |
| Additive exponential | 37,074.26 | 3.12 | 28,839.11 |
| Multiplicative exponential | 37,521.73 | 3.25 | 29,360.73 |
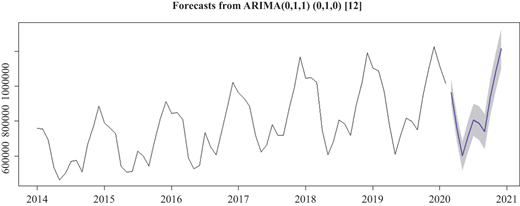
ARIMA (0,1,1) (0,1,0) [12] seems to be the best model, as it is showing the smallest RMSE, MAPE and MAE values. Based on this model, the next 10-month forecast by ARIMA (0,1,1) (0,1,0) [12] model with 95% upper and lower bound for FTAs in India with the financial year of 2020–2021 is tabulated in Table 5.
Forecast of the foreign tourist arrival in India
| Month | Point forecast | Lower bound 95% | Upper bound 95% |
|---|---|---|---|
| March 2020 | 963142.3 | 891452.8 | 1034831.7 |
| April 2020 | 761629.3 | 684259.2 | 838999.3 |
| May 2020 | 600866.3 | 518205.1 | 683527.4 |
| June 2020 | 711291.3 | 623657.9 | 798924.6 |
| July 2020 | 807731.3 | 715393.1 | 900069.4 |
| August 2020 | 788863.3 | 692048.6 | 885677.9 |
| September 2020 | 740790.3 | 639697.1 | 841883.4 |
| October 2020 | 934509.3 | 829311.6 | 1039707.0 |
| November 2020 | 1082222.3 | 973074.2 | 1191370.3 |
| December 2020 | 1215948.3 | 1102987.9 | 1328908.6 |
The forecasted value for March 2020 to December 2020 is graphically shown in Figure 6 with blue colour, by analysing expected forecast of the FTAs monthly. It follows a similar increasing trend with up and down nature as previous monthly data sets.
However, India suspended all the visas with effect from 13 March and imposed a nationwide lockdown by the end of March 2020. So, in this paper, prediction of FTAs starts from March 2020. As reported in a brief note by the Ministry of Tourism (FTA, 2021), FTAs in March 2020 were 328,462 with growth of −66.4% as compared to March 2019. The proposed prediction of March is fairly similar and found −66.42% of loss of FTAs in India.
For April, as per the estimation, 761,630 tourists were treated as a total loss of FTAs in India. India expects 600,867 individual foreign tourists to drop in May month as India extends lockdown to 31 May. As reported in The Hindu, AIIMS director expects Covid-19 cases likely to hit a peak somewhere between the months of June and July (The Hindu, 2020a). In case the situations prevail, it could be the enormous loss of 711,292 FTAs and 807,732 in-person for June and July, respectively.
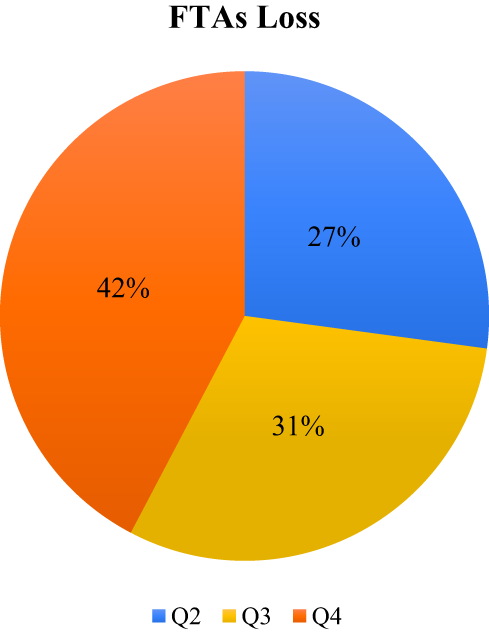
By analysing the quarterly FTAs for the financial year 2020–2021, India expects a loss of the number of persons in Table 6 and a percentage loss of FTAs in Figure 7.
6. Recommendations for the government and industries
Covid-19 pandemic has hit the top global tourist destinations such as Spain, Italy, France and UK (International Tourism Highlights 2019 Edition). Therefore, global travellers may lean towards the north-eastern and southern parts of India, which are far less affected by Covid-19 and has a lesser fatality rate. Tourism is fragile and seasonal, which depends on different influential factors such as GDP, consumer price index and the exchange rate of incoming countries of tourist arrivals in India. Major sources of tourist share from USA, UK, Canada, Australia, etc. Now their GDP growth rate varies between −5 and −9 in April 2020 (Nathan, 2020), and employment losses are high. Therefore, the arrivals from these countries are likely to come down.
As the Indian economy is struggling, one of the biggest challenges is reviving and boosting the economy during this pandemic outbreak. Currently, the tourism industry accounts for approximately 10% of GDP, and this research predicts the tourism industry's unhealthy signs in the upcoming quarters. Therefore, the need of the hour is that the government and industry take a serious step towards the revival of this sector and recommended to plan measures as in Table 7.
Recommendations to reduce losses for government and industry
| S. No | Government | Industry |
|---|---|---|
| 1 | As the situation improves, the government should ease of tourist visa policy to promote tourism in less-affected Covid-19 hotspots and issue more practical and documented lockdown guidelines for tourists | Entice local tourists and NRIs along with the foreign tourists by adopting the following confidence-building measures: providing quality medical facilities at nominal charges, medical insurance, ensuring government protocols during their stay and travel, etc. |
| 2 | The government authority should distribute an impressive sum and focus on the sanitation and tidiness of all visitor destinations and spots | Industry to follow preventive measures and redesign their facilities and ensure proper hygiene and sanitation |
| 3 | Strict guidelines should be made and carried out to give better hygiene facilities to tackle the coronavirus outbreak at all places of interest | Capacity building and retraining of the workforce to deal with the pandemic. Engage local workers in catering and hospitality services |
| 4 | Uniformity of taxes and extensive relief be provided in hotels and restaurants and bring some relief as the cost of service will increase during and after Covid-19 | Give handsome commission of tour operators based on a group size of tourists |
| 5 | Avoid GST refund delay to maintain the balance in the industry | Attractive and affordable tour packages should include yoga and meditation in their packages as these are immunity boosters |
| 6 | Transportation charges should be low as international crude oil price reducing nowadays | Promote and focus on less-affected Covid-19 hotspots such as Kerala, Lakshadweep, north-eastern states, etc. |
This study provides a basic understanding of the magnitude of the problem coming to the Indian tourism industry. The need is for industry, policy planners and researchers to develop policies to attract foreign tourists and improve sustainability. As the WTTC predicts the huge employment loss in this sector, there is a need to develop a policy for alternative employment. The finding of this study could also give a good idea of the loss of foreign exchange earnings. One can use the finding to develop strategies to reduce the loss by attracting local tourists and alternate use of the existing facilities.
7. Conclusion, limitations and future scope
Most of the world is going through a rough patch due to the Covid-19 virus, and India is also equally suffering. The Indian government has implemented strict rule and regulation to control the growth rate of rapidly increasing corona cases, where for more than 70 days, a large portion of economic activity is restricted due to partial or sometimes full closure of manufacturing and service sectors. This nationwide lockdown has adversely affected the travel and hospitality industry and may be the worst in the service sector. India's tourism industry is one of the significant areas of the Indian economy, which provides a wide range of employment and contributes approximately 10% of the GDP.
This paper predicts the FTAs by using SARIMA as compared to the H-W method based on measured error performance of MAPE, RMSE and MAE. As per the earlier discussions, the tenth months ahead of forecast, which is equivalent to the downfall or loss of FTAs in India. This research estimates the monthly forecast of the FTAs from March 2020 to December 2020 in India, as India found a considerable number of Covid-19 patients that were increasing from March. Thus, simulation shows a clear sign of the downfall of 634,681 FTAs in March month by the proposed research. For the second quarter, it is to be a total loss of 2,073,787 FTAs. If such situations prevail, then 2,337,385 and 3,232,680 would be the overlooked FTAs in the third and fourth quarter, respectively, and all the last three quarter will be 7,643,852 FTAs, a considerable loss incurred.
This study uses monthly data, so its prediction performance may be compromised compared to the use of daily or weekly data. Even if the perfect prediction model is pointed out, it can just fill in as an estimation for sophisticated traveller practices because the vacationers' decisions are influenced by changes in financial ups and downs, inspirations or preferences. Henceforth, the planner should consistently be set up to make modifications to the earlier identified and defined model, adjusting it to any recently made changes. Therefore, government can use the outcomes of this research to correlate the foreign exchange received and employability as it supports the substantial contribution of GDP of the country and formulate policies accordingly to revive and boost its hospitality and tourism industry.
Abbreviation
- ACF:
Autocorrelation function
- AIC:
Akaike information criterion
- ANN:
Artificial neural network
- ARIMA:
Autoregressive integrated moving average
- BIC:
Bayesian information criterion
- DF:
Degree of freedom
- FTAs:
Foreign tourist arrivals
- GDP:
Gross domestic product
- H0:
Null hypothesis
- Ha:
Alternate hypothesis
- MAE:
Mean absolute error
- MAPE:
Mean absolute percentage error
- NAR:
Nonlinear autoregressive
- NARX:
Nonlinear autoregressive with exogenous inputs
- PACF:
Partial autocorrelation function
- Qi:
ith quarter
- RMSE:
Root mean square error
- SARIMA:
Seasonal autoregressive integrated moving average