Tourism is one of the upcoming service industry in India with high potentials for future growth, particularly in rural areas. Many potential barriers are affecting the growth of tourism in rural India. Therefore, it is essential to explore and prioritize the barriers to tourism growth in rural India.
Qualitative and quantitative responses from “16” experts related to tourism and hospitality management from central India are collected for this study. An integrated Multi-Criteria Decision Making (MCDM) based framework is adopted to identify and relate significant barriers to tourism growth in India.
The result of the study identified many significant barriers and their importance to tourism growth in rural India.
The findings of this study add to the knowledge base of tourism research in line with the previous literature. This study offers an in-depth understanding of barriers focusing on rural tourism growth and devising both the plan of action and the suggestive measures in dealing with rural tourism.
The study provides a robust framework by integrating Interpretive Structural Modelling(ISM) and Decision Making Trial and Evaluation Laboratory (DEMATEL) to explore and prioritizing the critical barriers to rural tourism growth in India. The results of this study can help the decision-maker to fundamentally improve the economy of India through the growth of rural tourism.
1. Introduction
Tourism is primarily an expression of natural human instinct for experience, education and entertainment (Raghavendra et al., 2016). Tourism is a very vast, vibrant, dynamic and growth-oriented industry in the world. The tourism industry is becoming one of the firmest-growing sectors of the global economy, which accounts for 11% of gross domestic product and employs more than 225 million people worldwide (Raghavendra et al., 2016). The tourism industry is also one of the top contributors to job creation across the world. The sector is contributing to nearly 10% of employment globally (Market Width, 2019). India is recognized as the potential of tourism since its independence. Tourism was introduced as an economic boasting activity in 1950 (Nair and Ramachandran, 2016). Domestic tourism boosted when people within India started to travel and visit their friends or relatives for pilgrimage and study (Nair and Ramachandran, 2016; Abhyankar, 2013). The immense expansion of domestic tourism has strengthened its rich heritage and maintained unity in diversity. The tourism growth has led to enhancement in other economic activities such as job opportunities and infrastructure development, improvement in communication channels and attempts to alleviate poverty.
According to the Indian Brand Equity Foundation (IBEF, 2019), tourism is one of India's largest foreign exchange contributors. More than 81.1 million people were engaged in tourism activities during 2017–18, which contributed to 12.38% of total employment in India. Foreign Exchange Earnings (FEE) from tourism reached US$ 28.59 billion in 2018 (Ministry of Tourism, 2018). The Government of India plans to achieve 20 million foreign tourist arrivals (FTAs) by the end of 2020. The government is also planning to double its foreign exchange earnings in 2020. In the pursuit of achieving the target, India's Government has launched many initiatives such as ‘Incredible India!’ and ‘Atithi Devo Bhava’. These initiatives have provided a focused impetus to the growth of the Indian tourism sector.
Eliminating poverty in rural area is becoming a challenge for many developing countries. According to a study by Chaudhry and Gupta (2010), nearly about 75% of the worlds poor live in rural areas. It is, therefore, essential to identify different ways to eradicate poverty in these rural areas. Many countries, including India, have identified tourism as a tool for rural revitalization. Rural tourism preponderantly supports the preservation of local culture, heritage and traditions. As per Meena (2015), the notion of rural tourism is to benefit the local community through entrepreneurial and employment opportunities. Rural tourism helps in poverty alleviation, conservation, development of local handicrafts and preserving the environment and heritage. Rural tourism also helps to bring people of different lifestyles, cultures and beliefs closer to one another and provide a more comprehensive outlook of their life (Verma and Jain, 2018). Therefore, all stakeholders should identify and address the critical barriers to tourism growth in rural India.
Finally, the remaining paper is organized as follows. Section 2 is dedicated to the review of related work and the identification of research gaps. Section 3 outlines the Multi-Criteria Decision Making Techniques used in this paper, while Section 4 is devoted to the research methodologies used in this research. Results and their analysis are presented in Section 5. Discussion of the result is presented in Section 6. Finally, the paper is concluded in Section 7 by highlighting the research's contribution, limitation and future scope.
2. Literature review
Tourism growth helps increase countries' economies and solve the various socio-economic problems (Morakabati et al., 2012; Jane et al., 2019; Paul Hanna et al., 2019). On the other hand, tourism impacts society and the environment both positively and negatively. Therefore, the sustainability of tourism, particularly in the rural area, is becoming an essential topic for all stakeholders to improve the economy. Rural tourism has taken many different forms and is pursued differently in different areas (Richard et al., 2011). There are many economic and social reasons to promote tourism as a growth engine for rural prosperity (Morakabati, 2013).
Moreover, rural tourism is being flattened out by the powers of globalization (Tanahashi, 2010). Over the last few decades, the rural economy of many countries is showing a downward trend. Therefore many governments are giving more attention to the growth of the rural economy. The aim of promoting rural tourism is to increase local participation in creating and managing different tourism products. The nature of rural tourism products is very diverse. Tourism also facilitates a range of other benefits to rural areas like infrastructural development and offshoot enterprise opportunities. On the other hand, developing and managing rural tourism has many challenges and difficulties (Jingjing Liu et al., 2017). The thriving tourism development in the rural area depends on financial, logistic and economic issues. The above issues may further be compounded by political and economic obstacles (Fletcher and Morakabati, 2008). Thus, to deal with these challenges, the barriers responsible for tourism growth in general (rural tourism in particular) need to be identified.
Furthermore, many researchers have identified barriers that cater to a specific tourism vertical (Marzo-Navarro and Pedraja-Iglesias, 2009; Heung et al., 2011; Rokni et al., 2017; Jian et al., 2019; Xiong et al., 2020). Marzo-Navarro and Pedraja-Iglesias (2009) observed that the personal and structural factors are significant for wine tourism growth from a wine tourism perspective in rural areas. In medical tourism research, the policies and regulations, government support, costs and healthcare needs are the most significant barriers to medical tourism growth (Heung et al., 2011). Moreover, Rokni et al. (2017) found that government regulations, policy, promotion, language, and medical experts' number are significant barriers. Jian et al. (2019) found that economy, policies and regulations, marketing and government support and facilities are the main constraints for Macau's entertainment tourism growth.
Furthermore, available literature on tourism demand provides a variety of barriers to the growth of rural tourism. Galvasová and Holeček (2008) identified essential factors influencing the development of rural tourism. These factors are natural, historical, cultural and socio-economic factors. Demographic, economics and socio-political conditions, etc. are considered to be a social-economic factor. Natural factors include climatic conditions, flora and fauna, water etc. Toušek et al. (2008) found natural factors are one of the decisive localizing barriers of rural tourism. Cultural-historical monuments, cultural programs and cultural facilities are generally considered cultural and historical (Krogmann et al., 2021). The cultural heritage and collection of museums and galleries contribute to rural tourism (Kathryn A. Boys et al., 2017). Traditional meals can be counted as heritage features and traditional architecture (Bessiére, 2008). The removal of economic and political barriers and providing adequate infrastructure that improved the accessibility to rural areas are among other factors that support the growth of rural tourism (Ana-Elia et al., 2018; Wijesundara and Ranasinghe, 2019). Melichová et al. (2018) found that accommodation providers' unavailability in local areas, representatives at the regional level, are significant hurdles for rural tourism development.
From the literature review, it is evident that several studies related to rural tourism development are available in the literature. Most of them are studied in the western context. But, the socio-economic condition in rural areas in western countries is quite different from India. Therefore, the factors/barriers responsible for rural tourism growth cited in these research may not apply to developing countries like India. Further, no study found in the literature accentuates on identification and prioritization of barriers to rural tourism growth in India. Therefore, this study engaged in identifying and prioritizing the potential barriers to rural tourism growth in India. This research will help the stakeholders recognize and take proper steps to overcome these barriers. However, ascertaining critical issues in the Indian rural tourism industry and their tenacity is closely related to decision-making activities. It is essential to get engrossed in an in-depth study to identify and prioritize the most critical factors for rural tourism growth. Thus, this study deployed a systems science approach to establish a composite methodology and analyze the complicated relationship among various vital barriers to rural tourism growth in India. Based on the above discussion, the following primary objectives are focused in this study:
- □
To identify the key barriers that influence the growth of rural tourism in India.
- □
To develop a robust integrated research approach (DEMATEL and ISM) to prioritizing these barriers.
Based on similar studies and consultation with experts, 17 significant barriers to India's rural tourism are identified. Further, these 17 factors are grouped into eight categories based on their similarities and expert suggestion. The lack of access and connectivity (B1), lack of suitable and sufficient accommodation (B2) and lack of proper amenities (B3) (Heung et al., 2011; Jian et al., 2019; Jane et al., 2019) are included in the infrastructure category. All these barriers are significant for sustainable rural tourism in India. Similarly, the barriers like lack of a local brand of entertainment (B4), insufficient advertisement of tourism destination with local and international media(B5) and lack of promotion of old towns and heritage/historical sites (B6) (Heung et al., 2011; Vijayaragavan, 2014; Jian et al., 2019; Jane et al., 2019) are grouped under the “marketing and promotion” barrier category. Lack of strategic planning (B7), lack of effective coordination among stakeholders (B8) and unprofessional customer service (B9) (Heung et al., 2011; Jian et al., 2019; Jane et al., 2019) are assigned to the category called “Management”. This category has a significant effect on the growth of rural tourism. Another essential category responsible for rural tourism growth is “Government Attitude”. It includes two barriers, that is insufficient investment in the tourism sector (B10) and lack of support to innovation at the community level (B11) (Heung et al., 2011; Nunkoo, 2015; Jian et al., 2019; Jane et al., 2019). High tax in tourism product and services (B12), lack of security infrastructure and policies (B16) and lack of a comfortable and single window VISA system (B17) barriers are grouped under “Taxation”, “Security” and “Regulatory Issues” respectively (Vijayaragavan, 2014; Raghavendra et al., 2016). The barriers like “A limited number of experts (B13)”, “Shortage of trained local guide (B14)” and “Lack of communication ability (B15)” are categorized as “Expertise and manpower” (Heung et al., 2011; Jian et al., 2019; Jane et al., 2019).
3. Multi-criteria decision-making techniques
Most real-world problems deal with multiple data with different characteristics, for example some are objective or precise, and some are subjective or uncertain (Belton and Stewart, 2002). Therefore varieties of statistical and non-statistical based decision-making methods have been developed by researchers to model these complex real-world problems (Tomas Gal et al., 2013). Multiple-Criteria Decision-Making (MCDM) is one of these techniques that have recently gained unprecedented popularity and a wide range of applications (Maria et al., 2018; Cinelli et al., 2014; Velasquez and Hester, 2013; Amado et al., 2012). MCDM methods have been used by many researchers in the domain of tourism (Sheng-Li et al., 2018). But the decision-making trial and evaluation laboratory (DEMATEL) and interpretive structural modelling (ISM) methodologies are used extensively to analyze complex socio-economic systems. Both the methods have a quite a number of disadvantages along with some excellent features. Different researchers adopt the integration of different methods and their variation to overcome these disadvantages. There are many versions of DEMATEL such as classical DEMATEL, fuzzy DEMATEL, grey DEMATEL, analytical network process- (ANP-) DEMATEL etc. (Sheng-Li et al., 2018). The ISM methods have been integrated with other MCDM methods for example analytic hierarchy process (AHP), VIKOR and DEMATEL etc.
There are many similarities between ISM and DEMITEL, such as both emphasize the cause–effect relationship. The prominence and relation matrix in DEMATEL is similar to the driving power and dependence matrix in ISM. On the other hand, many dissimilarities, such as ISM, presented the relationship in two possible ways (0 and 1). In comparison, DEMATEL examined the relationships with more than two possible ways (from 0 to 4) to present a more in-depth evaluation. Consequently, ISM is more macro-oriented, whereas DEMATEL is more micro oriented. Both methods complement each other to employ synergic benefits. The strength and weakness of ISM and DEMATEL are shown in Table 1.
Comparative strength of each (ISM and DEMATEL) methods
| Attributes | DEMATEL | ISM |
|---|---|---|
| Causality | √ | √ |
| Comparative strength | √ | |
| Hierarchy | √ | |
| Network structure | √ | √ |
The details of the Decision Making Trial and Evaluation Laboratory (DEMATEL) and Interpretive Structural Modeling (ISM) are being discussed in the following sub-sections.
3.1 Decision Making Trial and Evaluation Laboratory (DEMATEL)
The DEMATEL method was first created at the Battelle Geneva Institute in 1971. The DEMATEL model is useful for solving a complex system's causality problems that are difficult to comprehend or articulate(Ortiz-Barrios et al., 2020). These techniques also help to elucidate the causal relations among factors (Shih-Hsi et al., 2012; Kefan Xie and Zimei Liu, 2019). Mathematically, the procedure of DEMATEL is explained step-by-step as follows:
- 1.
Determine the Important barriers, named .
- 2.
Generate Initial Direct-Relation Matrix. Collect expert opinion about the direct effect between each pair of elements. The pair-wise comparison marked by five levels: 0, 1, 2, 3 and 4 to represent “No influence,” “Low influence,” “Medium Influence”, “High influence” and “Very high influence,” respectively. The initial direct-relation matrix A is a n × n matrix, in which is denoted as the degree to which the element i affects the element j is denoted as A = .
- 3.
Normalize the Initial Direct-Relation Matrix. The normalized direct-relation matrix X = [] is obtained from eq (1), and eq (2) give below:
Eq. (2) represents the normalized Initial Direct-Relation (IDR) matrix. All the elements in the principal diagonal are equal to 0, and all elements in the matrix fulfil with 0 ≤ ≤ 1.
- 4.
Compute Total Relation Matrix. Eq (3) is used to obtain the Total Relation Matrix(T):
Where p represents power, and I is the identity matrix. Hence, when it approaches infinity, the matrix X converges.
- 5.
Determine the influencing degree and influenced degree. The Influencing degree and the influenced degree are calculated by adding the row elements and column elements of matrix T. The influencing degree and influenced degree of barrier are calculated as follows:
where is the influencing degree indicating the total influence of barrier on other barriers, and is the influenced degree indicating the overall impact of the other barriers on .
- 6.
Determine centre degree and cause degree. The cause degree is obtained by subtracting the influenced degree from influencing degree, whereas the centre degree is calculated by adding both influenced degree influencing the degree of the barrier:
Center degree signifies the status and role of barrier in the entire system and cause degree denotes the type of barrier ().
- 7.
Rank the barriers. According to the value of cause and center degree, each barrier is represented in a cartesian coordinate. It helps to analyze the importance of each barrier based on their actual order.
3.2 Interpretive Structural Modeling (ISM)
Interpretive Structural Modeling is a robust technique used to identify the problem or issues in a complex system. It helps find the complicated relationship between various entities in a system (Shih-Hsi et al., 2012). It also identifies the complex relationships between the critical factors/barriers (Shih-Hsi et al., 2012). Interpretive structural modelling technique is an excellent choice to heightened perceptual insights into the complex system (Chauhan et al., 2018). In other words, interpretive structural modelling is a group learning process. It is suitable for both a single expert and a group of experts. ISM is used to predicate on the particular relevance of system elements, using matrix operations. It also systematically display the graphical representation of the theory and concepts (Sage, 1977). Many researchers have discussed ISM implementation's relevance in the various domains (Shih-Hsi et al., 2012; Chauhan et al., 2018).
The steps of ISM are listed below:
- 1.
Find the influencing barriers in the system, named .
- 2.
Construct adjacency matrix based on the relationship between the influencing barriers:
- 3.
Calculate the reachability matrix. The reachability matrix is calculated from the adjacency matrix(A) using eq (9):
Where I, the unit matrix and n is the order of the matrix A. When , K = is called the reachability matrix. When = 1, it reveals that influences on , and if = 0, it means that does not influence on .
- 4.
Draw Hierarchical Structure Diagram. Find Reachable set , Antecedent set and the Collective set using eq (10)-eq (12):
For any factor , if = , then is the top-level barrier. The ith row and ith column are subsequently deleted, and a new reachability matrix is formed.
- 5.
Repeat step 4 until all barriers are eliminated. The hierarchical structure is obtained based on the order in which the barriers are eliminated.
3.3 Integrating ISM and DEMATEL
ISM and DEMATEL are the most used MCDM methodologies to clarify complex relationships between the factors/barriers in a multifaceted decision-making process. In this study, both DEMATEL and ISM methods' strength is integrated to identify and interrelation barriers more simplified, logical, and understandable. ISM method is known for the scientificity, integrity and operability (Shen et al., 2018). ISM is an essential exploratory tool (Mishra, 2020) that aids practitioners in visualizing the implementation structure better. The ISM method analyses the intrinsic influence mechanism between structural factors effectively and meets the requirements of relevance, hierarchy and complexity of factors influencing India's rural tourism growth. The DEMATEL is based on matrices representing the contextual relation and strength of influence of the target system's elements. It converts the cause-effect relationship of elements into visible structural models. DEMATEL technique also used to classify factors into facilitators (cause) and dependent (effect) groups based on their interrelationships' intensity. Integrating DEMATEL and ISM have the following advantages: Firstly, DEMATEL methods are used to obtain the more detailed cause–effect relationship direct matrix using more options (e.g. 0, 1, 2, 3, 4, 5) instead of binary relationship (0,1) used in the ISM method. Secondly, the ISM method requires a large number of complex matrix operations to obtain the reachable matrix. The main objective is to reduce computational complexity by integrating the DEMATEL and ISM approach. Thirdly, the DEMATEL method is used to identify the cause and effect of rural tourism growth barriers.
The ISM methodology is used to obtain more in-depth information about the essential driving and dependent power of the barriers and their relationship. Various researchers have successfully used the integrated ISM and DEMATEL methods in their studies (Trivedi et al., 2021; Hassan and Asghar, 2021; Mahnaz Shakerian et al., 2020; Chauhan et al., 2018). Trivedi et al. (2021) used DEMATEL and ISM methods to analyze the cause–effect relationship among the barriers to maritime transport in India and further identify the vital influential barriers from an identified set of factors. Hassan and Asghar (2021) implemented integrated ISM-DEMATEL methods to determine the intensity of software project elements and their relationship. Mahnaz Shakerian et al. (2020) employed a hierarchical model to identify and relate the unsafe behaviour cognitive factors (UBCFs). Chauhan et al. (2018) analysed the barriers of waste recycling in India using the ISM-DEMATEL method. All the above studies have established the usefulness of the integration of ISM and DEMATEL.
The proposed integrated algorithm is adopted from Shen et al. (2018) and Kefan Xie and Zimei Liu (2019) and the steps are outlined as follows:
- 1.
Determine the barriers (B) affecting rural tourism in India, and Direct Influence Matrix
- 2.
Calculate the Comprehensive Relation Matrix (T). T is calculated using the DEMATEL method (Section 3.1).
- 3.
Determine Total Relation Matrix (H):
- 4.
Calculate the reachability matrix from the total relation matrix(H):
denote the threshold value for the reachability matrix. is used to simplifying the system structure by eliminating less influence relationship. is set to zero for the systems with fewer factors/barriers. The value of can be decided based on the requirements of decision-makers/experts for a more complex system (Kefan Xie and Zimei Liu, 2019).
- 5.
From the reachability matrix (K), determine the Systematic Hierarchical Structure. Follow the steps (4–5) of section 3.2(ISM).
4. Research methodology
This section elucidates the research flow, including research design, data collection processes, etc. used in this research.
4.1 Research flow
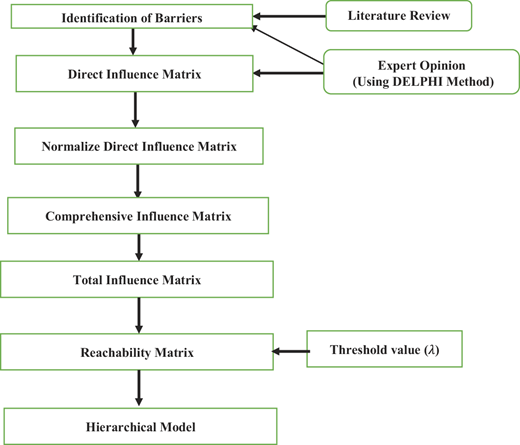
The research flow adopted in this research is shown in the following Figure 1. The detailed steps are discussed as follows:
Step 1: The first step in the design flow is identifying the barriers to rural tourism growth in India. Initially, 19 barriers are identified from past literature. Based on the opinion of four local experts (two professors, one government official, one tourist), 17 barriers are selected for further analysis.
Step 2: The barriers finalized in Step-1 is sent to experts to obtain the association and relation between these barriers.
Step 3: The initial association matrix is feed to DEMATEL and ISM algorithms for further exploration.
Step 4: The results in the form of a DEMATEL plot and ISM digraph is obtained.
Step 4: Final set of barriers and their priorities are derived after comparing and contrasting the results.
In the present study, dozens of rural tourist destinations have been visited to understand the cons and pros of tourist places in central and south India.
4.2 Research methods
This subsection briefly outlines the research processes using an empirical case study.
4.2.1 Research subjects
There is always a big debate over the number of experts required to validate the result of MCDM based research. Hogarth argued that for MCDM research, the expert group should be between 6 and 25 people (Hogarth, 1978). Hogarth's approximation was well supported by Ashton (1986). Lin et al. (2016) even argued that the number of experts depends on experts' experience. They suggested fewer experts if experts have more than ten years of experience in the domain of study. Further, Asgharpour suggested that if the experts are homogeneous, 10–15 experts would be sufficient for any MCDM research (Asgharpour, 2010). It is also observed from the past MCDM studies that 10–20 participants are good enough to validate the study results (Luthra et al., 2016; Mangla et al., 2018; Shen et al., 2018; Kefan Xie and Zimei Liu, 2019). Therefore, 30 experts from government officials related to tourism, academic experts and industry experts from hotel and MICE industries were invited to participate in this study. The experts were invited based on their expertise in MICE research and development and author('s) contact. Finally, 16 experts (Government (4), Academic (7) and Industry (5)) agreed to participate in this study. The present sample size can be considered satisfactory for any MCDM studies (Luthra et al., 2016; Mangla et al., 2018). The experts were highly accomplished professionals from the different dimensions of rural tourism development. A Delphi method was used for data collection. During the data collection, the experts were contacted more than three times. The brief profile of experts are given in Table 2.
4.2.2 Instrument development
Suitable instruments are developed to collect data for ISM and DEMATEL methods. The questionnaire consists of three parts. Part-1 contains demographic profiles. Part-2 asked the experts to rate the different barriers on a 5-point Likert scale (1 = not at all and 5 = very significant) of rural tourism growth. Part-3 asked the experts to fill the table for ISM and DEMATEL processes.
4.3 Data collection
A Delphi method was adopted to collect data from experts. The author played the role of moderators to obtained and compile responses for this research work. The survey was conducted from July 2019 to May 2020. The first round of responses was received on 13th August 2019. Table 3 summarised the scores related to rural tourism barriers in India based on the expert's opinion.
Mean score of crucial barriers to smart city development
| Barriers | Critical barriers to tourism growth in rural India | Mean | SD |
|---|---|---|---|
| B1 | Lack of Access and connectivity | 4.15 | 0.93 |
| B2 | Lack of suitable and sufficient accommodation | 3.94 | 0.67 |
| B3 | Lack of proper amenities | 3.58 | 0.81 |
| B4 | Lack of a local brand of entertainment | 3.41 | 0.65 |
| B5 | Insufficient advertisement of tourism destination with local and international media | 3.81 | 0.91 |
| B6 | Lack of policies and promotion of old rural heritage/historical sites | 4.17 | 0.49 |
| B7 | Lack of strategic planning for promotion of rural tourist spot | 3.52 | 0.75 |
| B8 | Lack of effective coordination among stakeholders | 3.38 | 0.98 |
| B9 | Unprofessional customer service | 3.27 | 0.27 |
| B10 | Insufficient investment in the tourism sector | 3.95 | 0.81 |
| B11 | Lack of support to innovation at the community level | 3.72 | 0.56 |
| B12 | High tax on tourism product and services | 3.11 | 0.68 |
| B13 | A limited number of experts | 3.52 | 0.91 |
| B14 | Shortage of trained local guide | 3.76 | 0.62 |
| B15 | Lack of communication ability in other than local languages | 4.04 | 0.87 |
| B16 | Lack of security infrastructure and policies | 3.61 | 0.47 |
| B17 | Lack of accessible and single window VISA system | 3.45 | 0.56 |
The mean scores of the barriers and their standard deviations to rural tourism growth in the Indian context are shown in Table 3. All the mean values are more than 2.5, which shows the importance of each barrier selected for this study. The experts' responses to part-3 are compiled, and then the second round of questionnaires was sent to experts. After three rounds of opinion consolidation, the experts' final consensus was received on 18th May 2019.
5. Results and analysis
In this section, the barriers affecting rural India's tourism growth are analyzed using the integrated DMTATEL-ISM technique. The main objective is to explore each barrier's influence on the growth of rural tourism in India.
5.1 Establishment of the direct influence matrix
Based on expert consultation and literature analysis, 17 barriers influencing tourism in rural India denoted as are identified. Influence relationships between these barriers are determined through the Delphi method. A 2-points Likert-type scale questionnaire was designed and distributed among experts. The direct influence matrix (X) is obtained where = 0 indicates that barrier does not influence barrier . = 1 suggests that influences on . The direct relation matrix (X) is obtained by aggregating the judgment of 16 experts based on equation(15) (Wu et al., 2010):
The direct relationship matrix is shown in Table 4. The value (0–5) of each element is obtained by experts opinion, of which = 0 indicates a barrier does not influence barrier , and = 5 reveals the barrier has a powerful influence on barrier . When i = j, = = 0, and when i ≠ j, the value is .
The direct relation matrix
| B1 | B2 | B3 | B4 | B5 | B6 | B7 | B8 | B9 | B10 | B11 | B12 | B13 | B14 | B15 | B16 | B17 | |
|---|---|---|---|---|---|---|---|---|---|---|---|---|---|---|---|---|---|
| B1 | 0 | 0 | 0 | 0 | 0 | 1 | 1 | 2 | 1 | 0 | 0 | 0 | 0 | 0 | 0 | 0 | 0 |
| B2 | 0 | 0 | 3 | 0 | 0 | 0 | 0 | 0 | 4 | 0 | 1 | 0 | 0 | 0 | 0 | 0 | 0 |
| B3 | 0 | 0 | 0 | 3 | 0 | 0 | 0 | 0 | 0 | 0 | 0 | 0 | 0 | 0 | 0 | 0 | 0 |
| B4 | 0 | 0 | 0 | 0 | 0 | 2 | 0 | 0 | 0 | 0 | 0 | 0 | 0 | 0 | 0 | 0 | 0 |
| B5 | 0 | 0 | 0 | 0 | 0 | 4 | 1 | 0 | 0 | 0 | 0 | 0 | 0 | 0 | 0 | 0 | 0 |
| B6 | 0 | 2 | 2 | 2 | 3 | 0 | 3 | 2 | 1 | 2 | 2 | 0 | 1 | 1 | 1 | 2 | 0 |
| B7 | 0 | 3 | 2 | 3 | 0 | 2 | 0 | 3 | 2 | 3 | 3 | 3 | 2 | 2 | 2 | 3 | 4 |
| B8 | 2 | 2 | 2 | 0 | 0 | 0 | 0 | 0 | 0 | 1 | 2 | 0 | 1 | 1 | 0 | 2 | 0 |
| B9 | 0 | 0 | 0 | 0 | 0 | 0 | 0 | 0 | 0 | 0 | 0 | 0 | 0 | 0 | 0 | 0 | 0 |
| B10 | 5 | 4 | 4 | 3 | 3 | 4 | 0 | 1 | 1 | 0 | 3 | 2 | 3 | 2 | 1 | 4 | 0 |
| B11 | 0 | 0 | 0 | 0 | 0 | 2 | 0 | 0 | 0 | 0 | 0 | 0 | 0 | 0 | 0 | 1 | 0 |
| B12 | 0 | 3 | 1 | 1 | 0 | 0 | 1 | 0 | 0 | 0 | 2 | 0 | 0 | 0 | 0 | 0 | 0 |
| B13 | 0 | 0 | 0 | 0 | 0 | 0 | 0 | 0 | 1 | 0 | 2 | 0 | 0 | 0 | 0 | 0 | 0 |
| B14 | 0 | 0 | 0 | 0 | 0 | 4 | 0 | 1 | 3 | 0 | 2 | 0 | 0 | 0 | 5 | 0 | 0 |
| B15 | 0 | 0 | 0 | 0 | 0 | 0 | 0 | 0 | 1 | 0 | 0 | 0 | 0 | 0 | 0 | 0 | 0 |
| B16 | 0 | 0 | 0 | 0 | 0 | 0 | 0 | 0 | 0 | 0 | 0 | 0 | 0 | 0 | 0 | 0 | 0 |
| B17 | 0 | 0 | 0 | 0 | 0 | 0 | 0 | 0 | 0 | 0 | 0 | 0 | 0 | 0 | 0 | 0 | 0 |
5.2 Determining the comprehensive relation matrix
The comprehensive relation matrix
| B1 | B2 | B3 | B4 | B5 | B6 | B7 | B8 | B9 | B10 | B11 | B12 | B13 | B14 | B15 | B16 | B17 | |
|---|---|---|---|---|---|---|---|---|---|---|---|---|---|---|---|---|---|
| B1 | 0.003 | 0.007 | 0.005 | 0.004 | 0.002 | 0.028 | 0.027 | 0.054 | 0.028 | 0.005 | 0.007 | 0.002 | 0.004 | 0.004 | 0.003 | 0.007 | 0.003 |
| B2 | 0.000 | 0.000 | 0.075 | 0.006 | 0.000 | 0.002 | 0.000 | 0.000 | 0.100 | 0.000 | 0.025 | 0.000 | 0.000 | 0.000 | 0.000 | 0.001 | 0.000 |
| B3 | 0.000 | 0.000 | 0.000 | 0.075 | 0.000 | 0.004 | 0.000 | 0.000 | 0.000 | 0.000 | 0.000 | 0.000 | 0.000 | 0.000 | 0.000 | 0.000 | 0.000 |
| B4 | 0.001 | 0.003 | 0.003 | 0.003 | 0.004 | 0.051 | 0.004 | 0.003 | 0.002 | 0.003 | 0.004 | 0.000 | 0.002 | 0.002 | 0.002 | 0.003 | 0.000 |
| B5 | 0.001 | 0.009 | 0.009 | 0.009 | 0.008 | 0.105 | 0.033 | 0.008 | 0.006 | 0.008 | 0.010 | 0.003 | 0.005 | 0.005 | 0.005 | 0.009 | 0.003 |
| B6 | 0.010 | 0.067 | 0.068 | 0.067 | 0.082 | 0.029 | 0.080 | 0.060 | 0.042 | 0.059 | 0.070 | 0.009 | 0.036 | 0.034 | 0.035 | 0.068 | 0.008 |
| B7 | 0.014 | 0.098 | 0.074 | 0.093 | 0.012 | 0.076 | 0.008 | 0.084 | 0.072 | 0.082 | 0.102 | 0.080 | 0.061 | 0.058 | 0.062 | 0.094 | 0.101 |
| B8 | 0.053 | 0.054 | 0.032 | 0.005 | 0.003 | 0.010 | 0.002 | 0.005 | 0.011 | 0.026 | 0.057 | 0.001 | 0.027 | 0.027 | 0.004 | 0.055 | 0.000 |
| B9 | 0.000 | 0.000 | 0.000 | 0.000 | 0.000 | 0.000 | 0.000 | 0.000 | 0.000 | 0.000 | 0.000 | 0.000 | 0.000 | 0.000 | 0.000 | 0.000 | 0.000 |
| B10 | 0.128 | 0.114 | 0.119 | 0.094 | 0.085 | 0.129 | 0.016 | 0.041 | 0.051 | 0.009 | 0.098 | 0.052 | 0.081 | 0.055 | 0.036 | 0.113 | 0.002 |
| B11 | 0.001 | 0.003 | 0.003 | 0.003 | 0.004 | 0.051 | 0.004 | 0.003 | 0.002 | 0.003 | 0.004 | 0.000 | 0.002 | 0.002 | 0.002 | 0.028 | 0.000 |
| B12 | 0.000 | 0.078 | 0.033 | 0.030 | 0.001 | 0.006 | 0.026 | 0.002 | 0.009 | 0.002 | 0.055 | 0.002 | 0.002 | 0.002 | 0.002 | 0.004 | 0.003 |
| B13 | 0.000 | 0.000 | 0.000 | 0.000 | 0.000 | 0.003 | 0.000 | 0.000 | 0.025 | 0.000 | 0.050 | 0.000 | 0.000 | 0.000 | 0.000 | 0.001 | 0.000 |
| B14 | 0.002 | 0.008 | 0.008 | 0.007 | 0.008 | 0.106 | 0.008 | 0.031 | 0.083 | 0.007 | 0.059 | 0.001 | 0.004 | 0.004 | 0.129 | 0.010 | 0.001 |
| B15 | 0.000 | 0.000 | 0.000 | 0.000 | 0.000 | 0.000 | 0.000 | 0.000 | 0.025 | 0.000 | 0.000 | 0.000 | 0.000 | 0.000 | 0.000 | 0.000 | 0.000 |
| B16 | 0.000 | 0.000 | 0.000 | 0.000 | 0.000 | 0.000 | 0.000 | 0.000 | 0.000 | 0.000 | 0.000 | 0.000 | 0.000 | 0.000 | 0.000 | 0.000 | 0.000 |
| B17 | 0.000 | 0.000 | 0.000 | 0.000 | 0.000 | 0.000 | 0.000 | 0.000 | 0.000 | 0.000 | 0.000 | 0.000 | 0.000 | 0.000 | 0.000 | 0.000 | 0.000 |
5.3 Determine causality, centrality, influenced degree and influencing degree
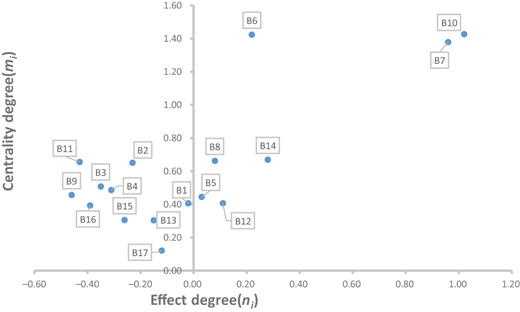
The causality, centrality, influencing degree and influenced degree of each barrier is calculated using the equation (eq (4)-eq (7); section 3.1). The influencing degree () of each barrier on other barriers is calculated using eq (4). The influenced degree of the barrier denoted as , represented the far-reaching influence of other barriers on the barrier is calculated by eq (5). The centrality of the barrier , that is , reflected the importance of the barrier i in rural tourism is calculated by eq (6). Higher is the centrality; the more critical is the barrier. The causality of the barrier that is reflecting the pure influences of the barrier on other barriers and is calculated using eq (7). For any barrier i, if > 0, the barrier imposed more considerable influences on other barriers and is called as “cause barrier”; if 0, the barrier is more influenced by other barriers and is known as the “effect barrier”. The values of fi, ei, mi and ni are shown in Table 6.
Results of influencing and influenced degrees, centrality and causality
| Factor | B1 | B2 | B3 | B4 | B5 | B6 | B7 | B8 | B9 | B10 | B11 | B12 | B13 | B14 | B15 | B16 | B17 |
|---|---|---|---|---|---|---|---|---|---|---|---|---|---|---|---|---|---|
| 0.193 | 0.209 | 0.079 | 0.094 | 0.236 | 0.824 | 1.171 | 0.372 | 0.000 | 1.223 | 0.115 | 0.257 | 0.079 | 0.476 | 0.025 | 0.000 | 0.000 | |
| Rank | 9 | 8 | 12 | 11 | 7 | 3 | 2 | 5 | 14 | 1 | 10 | 6 | 12 | 4 | 13 | 14 | 14 |
| 0.213 | 0.441 | 0.429 | 0.396 | 0.209 | 0.600 | 0.208 | 0.291 | 0.456 | 0.204 | 0.541 | 0.150 | 0.224 | 0.193 | 0.280 | 0.393 | 0.121 | |
| Rank | 11 | 4 | 5 | 6 | 12 | 1 | 13 | 8 | 3 | 14 | 2 | 16 | 10 | 15 | 9 | 7 | 17 |
| 0.406 | 0.650 | 0.508 | 0.486 | 0.445 | 1.424 | 1.379 | 0.663 | 0.456 | 1.427 | 0.656 | 0.407 | 0.303 | 0.669 | 0.305 | 0.393 | 0.121 | |
| Rank | 13 | 7 | 8 | 9 | 11 | 2 | 3 | 5 | 10 | 1 | 6 | 12 | 16 | 4 | 15 | 14 | 17 |
| −0.02 | −0.23 | −0.35 | −0.31 | 0.03 | 0.22 | 0.96 | 0.08 | −0.46 | 1.02 | −0.43 | 0.11 | −0.15 | 0.28 | −0.26 | −0.39 | −0.12 | |
| Rank | 8 | 11 | 14 | 13 | 7 | 4 | 2 | 6 | 17 | 1 | 16 | 5 | 10 | 3 | 12 | 15 | 9 |
| Cause (C)/Effect(E) | E | E | E | E | C | C | C | C | E | C | E | C | E | C | E | E | E |
Table 7 listed the relations among various barriers that affect the growth of tourism in rural India. These barriers are found to have influencing degrees ranging from 0. 0 to 1.22. Eight barriers are relatively large influencing degrees (more than 0.2) and include: Lack of suitable and sufficient accommodation (B2); Insufficient advertisement of tourism destination with local and international media (B5); Lack of promotion of old towns and heritage/historical sites (B6); Lack of strategic planning (B7); Lack of effective coordination among stakeholders (B8); Insufficient investment in tourism sector (B10); High tax in tourism product and services (B12), Shortage of trained local guide (B14). Accordingly, Infrastructure, Marketing and Promotion, Management, Government attitude, Taxation, Expertise and human resources are grouped as the underlying barriers that affect rural tourism by affecting other significant barriers.
Reachability matrix
| B1 | B2 | B3 | B4 | B5 | B6 | B7 | B8 | B9 | B10 | B11 | B12 | B13 | B14 | B15 | B16 | B17 | |
|---|---|---|---|---|---|---|---|---|---|---|---|---|---|---|---|---|---|
| B1 | 0 | 0 | 0 | 0 | 0 | 1 | 1 | 1 | 1 | 0 | 0 | 0 | 0 | 0 | 0 | 0 | 0 |
| B2 | 0 | 0 | 1 | 0 | 0 | 0 | 0 | 0 | 1 | 0 | 1 | 0 | 0 | 0 | 0 | 0 | 0 |
| B3 | 0 | 0 | 0 | 1 | 0 | 0 | 0 | 0 | 0 | 0 | 0 | 0 | 0 | 0 | 0 | 0 | 0 |
| B4 | 0 | 0 | 0 | 0 | 0 | 1 | 0 | 0 | 0 | 0 | 0 | 0 | 0 | 0 | 0 | 0 | 0 |
| B5 | 0 | 0 | 0 | 0 | 0 | 1 | 1 | 0 | 0 | 0 | 0 | 0 | 0 | 0 | 0 | 0 | 0 |
| B6 | 0 | 1 | 1 | 1 | 1 | 1 | 1 | 1 | 1 | 1 | 1 | 0 | 1 | 1 | 1 | 1 | 0 |
| B7 | 0 | 1 | 1 | 1 | 0 | 1 | 0 | 1 | 1 | 1 | 1 | 1 | 1 | 1 | 1 | 1 | 1 |
| B8 | 1 | 1 | 1 | 0 | 0 | 0 | 0 | 0 | 0 | 1 | 1 | 0 | 1 | 1 | 0 | 1 | 0 |
| B9 | 0 | 0 | 0 | 0 | 0 | 0 | 0 | 0 | 0 | 0 | 0 | 0 | 0 | 0 | 0 | 0 | 0 |
| B10 | 1 | 1 | 1 | 1 | 1 | 1 | 0 | 1 | 1 | 0 | 1 | 1 | 1 | 1 | 1 | 1 | 0 |
| B11 | 0 | 0 | 0 | 0 | 0 | 1 | 0 | 0 | 0 | 0 | 0 | 0 | 0 | 0 | 0 | 1 | 0 |
| B12 | 0 | 1 | 1 | 1 | 0 | 0 | 1 | 0 | 0 | 0 | 1 | 0 | 0 | 0 | 0 | 0 | 0 |
| B13 | 0 | 0 | 0 | 0 | 0 | 0 | 0 | 0 | 1 | 0 | 1 | 0 | 0 | 0 | 0 | 0 | 0 |
| B14 | 0 | 0 | 0 | 0 | 0 | 1 | 0 | 1 | 1 | 0 | 1 | 0 | 0 | 0 | 1 | 0 | 0 |
| B15 | 0 | 0 | 0 | 0 | 0 | 0 | 0 | 0 | 1 | 0 | 0 | 0 | 0 | 0 | 0 | 0 | 0 |
| B16 | 0 | 0 | 0 | 0 | 0 | 0 | 0 | 0 | 0 | 0 | 0 | 0 | 0 | 0 | 0 | 0 | 0 |
| B17 | 0 | 0 | 0 | 0 | 0 | 0 | 0 | 0 | 0 | 0 | 0 | 0 | 0 | 0 | 0 | 0 | 0 |
Influenced degree denoted other barriers' comprehensive influence on barrier . In the influenced degree ranking, lack of promotion of old towns and heritage/historical sites (B6), unprofessional customer service (B9) and lack of support to innovation at the community level (B11) are front runners. Improving these barriers can help create a positive loop for the growth of rural tourism in India.
Centrality represents the position of the barrier and shows its importance in the system. As shown in Table 4, insufficient investment in the tourism sector (B10) is the most important, followed by a lack of support to innovation at the community level (B11) in the 2nd position.
Causality reflects the influences of the barrier on other barriers and can be classified as cause barrier and effect barrier. As shown in Table 6, among the “17” influencing barriers, seven barriers (Insufficient advertisement of tourism destination with local and international media(B5); Lack of promotion of old towns and heritage/historical sites (B6); Lack of strategic planning (B7); Lack of effective coordination among stakeholders (B8); Insufficient investment in tourism sector (B10); High tax in tourism product and services (B12); “Shortage of trained local guide (B14)” are cause barriers, while the rest ten barriers are “effect” barriers. These seven cause barriers are of vital importance for the growth of tourism in rural India.
The causality value for any cause barriers is positive. These barriers are placed on the right side of Figure 2. Seven out of 17 barriers are identified as cause barrier (B5, B6, B7, B8, B10, B12, B14), while the rest are identified as effect barriers. Among these 15 barriers, B5, B10 and B7 are seen as the primary causal barriers. These barriers are of great importance for the growth of tourism in rural India. Taking comprehensive steps to overcome these barriers can improve the overall rural tourism landscape in future. Barriers B1, B2, B3, B4, B6, B9, B11, B12, B13, B15, B16 and B17 are classified as effect barriers based on the score. Effect barriers deter the growth of rural tourism. The “effect barriers” are generally influenced by the cause barrier. The lesser score implies minimum influence. “Unprofessional customer services” is found to be having the least score (-0.46). This implies “Unprofessional customer services” is the least influencing barrier for the growth of rural tourism in India. In the causal relationship diagram (Figure 2), the cause barriers are represented in the positive Y-axis and the effect barriers are shown in the negative Y-axis. The right-most barriers in the Figure 2, that is Insufficient investment (B10), is the highly correlated barrier. In contrast, unprofessional customer service (B9) are the least correlated barrier positioned in the left-most corner of the Figure 2.
5.4 Computing the reachability matrix
The Comprehensive Relation Matrix shows the mutual relationships between barriers but does not reflect the influence of barriers on itself. So, it is required to determine the complete influence matrix between the various barriers. Hereafter, the reachability matrix (K) is computed using the Total Relation matrix and the threshold value (λ). If the influencing degree of a barrier to other barriers more significant or equal to λ, the barrier can directly affect other barriers; if the influencing degree of a barrier is less than λ, the barrier does not influence other barriers. The main objective of determining the threshold value is to identify the major causes in a complex system. The value of λ is also the essence of every complex system (Leveson, 2011). After several iterations, experts' advice and practical requirements, λ is chosen to 0.019 for this study. Table 7 shows the reachability matrix obtained for this study.
5.5 Structural levels of barriers
Using steps 4–5 of the ISM section and the reachability matrix obtained in the previous step, all barriers' structural levels are determined. Notably, the initial reachable set antecedent set and collective set of each barrier are obtained (Table 8).
Reachable set, antecedent set and collective set of each barrier in the first round
| Barriers | |||
|---|---|---|---|
| B1 | 1,6,7,8,9 | 1,8,10 | 1,8 |
| B2 | 2,3,9,11 | 2,6,7,8,10,12 | 2 |
| B3 | 3,4 | 2,3,6,7,8,10,12 | 3 |
| B4 | 4,6 | 3,4,6,7,10,12 | 4,6 |
| B5 | 5,6,7 | 5,6,10 | 5,6 |
| B6 | 2,3,4,5,6,7,8,9,10,11,13, 14,15,16 | 1,4,5,6,7,10,11,14 | 4,5,6,7,10,11,14 |
| B7 | 2,3,4,6,7,8,9,10,11,12,13, 14,15,16,17 | 1,5,6,7,12 | 6,7,12 |
| B8 | 1,2,3,8,10,11,13,14,16 | 1,6,7,8,10,14 | 1,8,10,14 |
| B9 | 9 | 1,2,6,7,9,10,13,14,15 | 9 |
| B10 | 1,2,3,4,5,6,8,9,10,11,12,13,14,15,16 | 6,7,8,10 | 6,8,10 |
| B11 | 6,11,16 | 2,6,7,8,10,11,12,13,14 | 6,11 |
| B12 | 2,3,4,7,11,12 | 7,10,12 | 7,12 |
| B13 | 9,11,13 | 6,7,8,10,13 | 13 |
| B14 | 6,8,9,11,14,15 | 6,7,8,10,14 | 6,8,14 |
| B15 | 9,15 | 6,7,10,14,15 | 15 |
| B16 | 16 | 6,7,8,10,11,16 | 16 |
| B17 | 17 | 7,17 | 17 |
Subsequently, five barriers are removed from Table 8 and step “4” of the ISM section is repeated. The for the rest of the barriers are obtained (Table 9). It can be seen from Table 10 that barriers B3, B11 and B15 hold the equation . Therefore, these three barriers are placed at the second level of the hierarchical structure.
Reachable set, antecedent set and collective set of each barrier in the second round
| Barriers | |||
|---|---|---|---|
| B1 | 1,7,8 | 1,8,10 | 1,8 |
| B2 | 2,3,11 | 2,7,8,10,12 | 2 |
| B3 | 3 | 2,3,7,8,10,12 | 3 |
| B5 | 5,7 | 5,10 | 5 |
| B7 | 2,3,7,8,10,11,12,13,14,15 | 1,5,7,12 | 7,12 |
| B8 | 1,2,3,8,10,11,13,14 | 1,7,8,10,14 | 1,8,10,14 |
| B10 | 1,2,3,5,8,10,11,12,13,14,15 | 7,8,10 | 8,10 |
| B11 | 11 | 2,7,8,10,11,12,13,14 | 11 |
| B12 | 2,3,7,11,12 | 7,10,12 | 7,12 |
| B13 | 11,13 | 7,8,10,13 | 13 |
| B14 | 8,11,14,15 | 7,8,10,14 | 8,14 |
| B15 | 15 | 7,10,14,15 | 15 |
Structural levels of all barriers in the hierarchical structure
| Levels | Barriers |
|---|---|
| L1 | Lack of a local brand of entertainment (B4), lack of policies and promotion of old rural heritage/historical sites (B6), Unprofessional customer service (B9), Lack of security infrastructure and policies (B16), Lack of accessible and single window VISA system (B17) |
| L2 | Lack of proper amenities (B3), Lack of support to innovation at the community level (B11), lack of communication ability in other than local languages (B15) |
| L3 | Lack of suitable and sufficient accommodation (B2), Lack of effective coordination among stakeholders (B8), A limited number of experts (B13), shortage of trained local guide (B14) |
| L4 | Lack of strategic planning for promotion of rural tourist spot (B7), High tax in tourism product and services (B12) |
| L5 | Lack of access and connectivity (B1), Insufficient advertisement of tourism destination with local and international media (B5) |
| L6 | Insufficient investment in the tourism sector (B10) |
Similarly, four barriers (B2, B8, B13 and B14) are deleted. By repeating the above step until all factors are removed, all barriers' structural levels are determined and presented in Table 10.
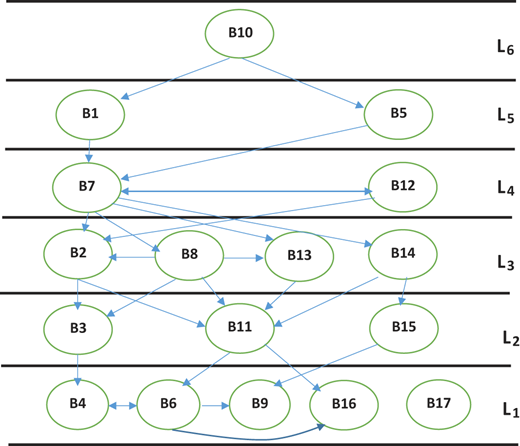
Initially, 17 barriers affecting the growth of rural tourism in India are divided into six levels. The barriers in the 1st level are regarded as direct influencing barriers (B4, B6, B9, B16, B17), those in the 2nd and 3rd levels are called surface affecting barriers (B2, B3, B8, B11, B13, B14, B15), those in the levels 4th and 5th are called shallow influencing barriers (B1, B5, B7, B12) and those that are in the level 6 are called deep controlled barriers (B10).
6. Discussion
Nowadays, different stakeholders' attention to rural tourism development is conditioned by its very positive influence on the country's economy. Tourism growth can influence rural inhabitants' employment and sell local artisan products and preserve the green eco-system. Rural tourism development is further added to the revival of rural economic and social development in India. This study identified significant barriers, which directly or indirectly influence rural tourism development. The hierarchical structure obtained by the ISM model (Figure 3) illustrated the most significant barrier to rural tourism growth in India. Insufficient investment in the tourism sector (B10) is found as one of the most significant barriers to rural development. That means facilitating rural tourism growth; the government must encourage investment in tourism sectors, particularly in rural areas. To support this cause, the Government of India has already liberalized its FDI policy in recent times. In pursuit of that, India's Government is also now focusing on attracting investment in the tourism sector. To attract foreign investments, India's government has allowed 100% FDI in the hotel and tourism industries. The hotels in and around UNESCO World Heritage sites are offered a five-year tax holiday to boost investment. These efforts have attracted US$ 12.35 billion FDI in hospitality sectors by March 2019. The government has also allowed 100% FDI in the Ayurveda, Yoga and Naturopathy, Unani, Siddha and Homoeopathy (AYUSH) sector (Singh, 2018). In 2018, the Union budget of India had announced a program named “Incredible India 2.0” to promote tourism. This program's main objective is to develop its rural hospitality sector through investments in tourism infrastructure. The government of Indias' other initiative like “Swadesh Darshan” and Pilgrimage Rejuvenation and Spirituality Augmentation Drive (PRASAD) is also aimed to increase investments in the rural sector.
The hierarchical model of the influencing Barriers of Rural Tourism Growth in India
The hierarchical model of the influencing Barriers of Rural Tourism Growth in India
Further, barriers such as “Lack of access and connectivity (B1)” and “Insufficient advertisement of tourism destination with local and international media (B5)” influence each other interdependently and also act as significant barriers for rural tourism in India. Lack of accessibility to local tourist destinations is another obstacle to the growth of rural tourism in India. Therefore, the Indian government should encourage and promote e-ticketing for rural cultural sites, multi-lingual telephone helplines for tourists in rural areas, online databases for rural cultural programmes and different schemes to promote rural heritage sights reducing rail/bus/air ticket prices and improving seaports for cruise tourism.
From the ISM hierarchy structure, it is evident that the above-discussed barriers would lead to “Lack of strategic planning for promotion of rural tourism spot (B6)”, which further lead to “Lack of suitable and sufficient accommodation (B2)”, “Limited number of local experts (B13)” and “Shortage of trained local guide (B14)”. The hierarchical relationships also make a lot of sense, as the influence of barriers such as “lack of proper amenities in local tourist places”, “lack of support to innovation in community-level” and “lack of communication ability by local stakeholders” play an essential role in strengthening the tourism in India. Therefore, the government and local stakeholders must find ways to tackle these challenges/barriers. The above-discussed barriers also influence other barriers like “Lack of a local brand of entertainment (B4)”, “Policies and Promotion of old rural heritage/historical sites (B6)”, “Unprofessional customer service (B9)”, “Lack of security infrastructure and policies (B16)” and “Lack of easy and single window VISA system (B17)”. The Ministry of Tourism has been working with other ministries to ease the existing VISA system to make a robust and straightforward VISA system. In support of external affair, the Ministry has already implemented the “Tourist Visa on Arrival enabled with Electronic Travel Authorisation (ETA)”, renamed as e-Tourist Visa. Now there are as many as 150 countries have been listed for this scheme. More efforts are required to improve the current visa system efficiency further. To overcome problems like unprofessional services, the limited number of experts and a shortage of trained local guides, India's government should launch vocational/professional courses at different colleges and universities. This can help to develop professionalism among stakeholders to handle tourists in rural India.
This study contributes some meaningful inferences to the theory of tourism research. According to Collis and Hussey (2014), the primary purpose of any study, mainly academic research, is to examine the research questions to produce some knowledge. As there has not been any influential research that prioritizes the crucial barriers to rural tourism growth in India, exploring such barriers through this study would help researchers understand the issues pertaining to rural tourism growth. From a theoretical point of view, this research is one of the first efforts to identify relevant barriers from various sources (i.e. research articles, websites/blogs, expert opinion on rural tourism, etc.) affecting India's rural tourism. Furthermore, none of the existing study has classified rural tourism barriers in India into various categories such as autonomous barriers, influencing barriers, influenced barriers, surface barriers, direct barriers, shallow barriers and linkage barriers to understand their nature. Based on experts' opinion, this study has computed the driving and dependence power for each barrier and assigned them to particular groups depending on their influences. This study has established the levels of various barriers and their interlinks using integrated MCDM techniques. This study has also prioritized the barriers to the growth of rural tourism in India. The DEMATEL method is used to identify the cause and effect of barriers to rural tourism growth. The ISM methodology provides more in-depth information about the essential driving and dependent barriers and their interlinks. Using integrated DEMATEL and ISM framework to rank the rural tourism barriers and further establish their interlink, this research has also contributed methodologically to rural tourism.
Finally, to summarise, this research is one of the first efforts to conduct a comprehensive study to prioritize the barriers responsible for rural tourism growth in India. Prior research on rural tourism in India neither identify barriers nor establish causal links between these essential barriers. This paper tried to fill these gaps in current research by prioritizing and linking various significant barriers from various sources using integrated DEMATEL and ISM techniques. The discussion concluded with a hope that future studies in rural tourism can empirically validate such links among barriers using an appropriate framework and primary data.
6.1 Academic implications
The hierarchical structure of barriers influencing rural tourism growth in India is inferred using an integrated DEMATEL – ISM techniques. The robustness of results obtained using the DEMATEL – ISM method is based solely on mathematical modelling. DEMATEL method is used (1) to divide the influencing barriers to cause barriers and effect barriers, (2) to identify the importance of the barriers in the growth of rural tourism in India. ISM is used to decompose the nonlinear and complicated interlinked barriers. Based on their influencing nature, ISM disintegrated these barriers into six hierarchies. These six hierarchies of barriers established in this research provide a holistic scenario for understanding the importance of India's rural tourism growth barriers.
Additionally, this study's influencing/influenced barriers are based on both the past literature and expert's opinion using the Delphi method. Combining two data sources to identify the barriers is more reliable and authentic than a single source. Further, recognized barriers would facilitate policymakers in the growth of rural tourism in India. However, in contributing to the theory, the straightforward integration of the DEMATEL and ISM techniques is logically sound in analyzing the barriers to rural tourism growth.
6.2 Managerial implications
The hierarchical structure provides a visualization of interrelationships and interdependences among the influencing/influenced barriers to tourism growth in rural India. It can serve as a useful reference for the growth of tourism in India. Based on the finding and analysis, the corresponding countermeasures are proposed to improve tourism's footfall in rural India. Figure 3 shows that the direct barriers influencing tourism growth are marketing and promotion, management, regulatory issues and safety measures. Reducing these barriers is the most direct and affordable means to improve tourism in rural India. In reality, however, it is not always possible to improve these direct barriers, but it can be managed by changing/reducing other influencing barriers to direct barriers. The direct barriers are also affected by the surface influencing barriers.
The surface influencing barriers do not directly affect rural tourism growth but register their influence through direct barriers. The improvement of surface influencing' barriers is a practical and feasible way to improve rural India's tourism growth. But the shortcoming is that the improvement potential of these barriers is very negligible in this case. Furthermore, shallow influencing barriers to tourism development are more concealed and often have little to do with the growth. These influencing barriers are often challenging to relate directly to tourism growth. But it affects the growth of tourism through surface barriers. The scope of improvements in these surface barriers is more practical and feasible. The impact of profound influencing barriers such as “marketing and advertisement”, “accessibility and security” etc., is found not directly reflected in the growth of rural tourism in India, but on other aspects that directly impact the growth. Minimizing these barriers can substantially improve the existing environment for tourism development. Working on these barriers can help to enhance the tourism eco-system effectively and continuously.
Further, to address these barriers related to the economic and political eco-system are more complicated to address. In summary, a practical and feasible way to improve the rural tourism in India is to enhance the surface and shallow influencing barriers like “Insufficient investment in the tourism sector”, “lack of access and connectivity and insufficient advertisement of tourism destinations in media”, while gradually and subtly improving the awful influencing barriers like “policies and promotion of old rural heritage/historical sites”, “lack of support to innovation in community-level”, “limited number of experts, shortage of trained local guide” etc. Ultimately, working on these barriers will fundamentally improve India's economy through the growth of rural tourism. Proper management of potential barriers found in the study can bring various benefits in future, such as rural employment, higher government revenues and the transformation of rural resources into a modern service industry; otherwise, it can damage many rural indigenous societies.
7. Conclusion
Growth in rural tourism in India can help in economic development. The government should recognize the importance of rural tourism in India and provide a healthy, sustainable environment for the stakeholders. All the stakeholders should give data to decision-making bodies to identify factors/barriers responsible for India's rural tourism growth. Furthermore, the government should provide adequate support and cost-effective infrastructures to foster rural tourism growth.
The growth of tourism in rural India is dependent on different factors like marketing, advertisement, government support, safety and security, etc. Based on the past literature and experts' opinion, this paper identified and established the relationship between various rural tourism growth barriers in India. Finally, the finding of the study is summarised as follows:
- •
The integration of ISM and DEMATEL analyses the interrelationship between different barriers that affect rural tourism growth. This integrated approach divided the barriers to cause barriers and significant barriers based on the causality score. Further, the causal relations among these barriers are established. Again, the significance of the different barriers is obtained using a centrality score. Finally, these barriers are classified into “direct influencing barriers”, “surface barriers”, “shallow barriers” and “controlled barriers”.
- •
The barriers that affect rural tourism growth in India have a very complex hierarchical structure. The barriers with high causality are placed in the upper layers of the structure. The analysis shows that insufficient government support is the root cause of low rural tourism growth in India. Accordingly, significant action should be taken to improve other indirect barriers, e.g accessibility, safety and security, marketing and promotion, local facilities etc. Therefore, all the stakeholders should work jointly to promptly reduce these root barriers with an effective and timely response to improve rural India's tourism footprint.
References
Appendix Survey Questionnaire
Section A – Please choose only one choice in each question as follows:
What is your professional qualification level?
(a) Graduate; (b) Postgraduate; (c) Doctorate; (d) If any other, please specify______
What is your work experience?
(a) 5 years; (b) 5–10 years; (c) 11–15 years; (d) 16–20 years; (e) >20 years
How will you classify your sector?
(a) Private sector; (b) Public sector; (c) If any other, please specify___________________
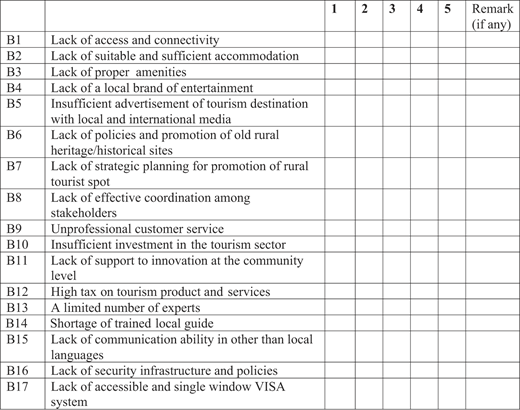
Section B – Please choose only one choice in each question as follows:
Kindly indicate the impact of the following barriers on rural tourism growth in India in 5-points Likert scale (1-not at all,2- slight impact, 3- moderate impact,4-significant impact and 5-very significant impact). Please tick (√) in the appropriate column)
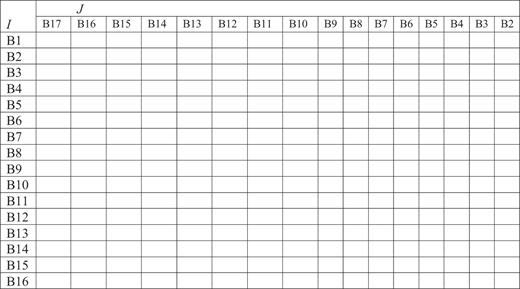
Section C – Contextual relationships between different barriers (Used in Delphi process)
Kindly fill the following table to represent contextual relationships between different direct influence matrix barriers to India's rural tourism. The direct influence matrix(X) is obtained where = 0 indicates that barrier does not influence barrier . = 1 suggests that influences on . For example, if you think that barrier (B1) influences barrier (B2), insert one(1), otherwise zero(0).
Please do this exercise to fill (0/1) for all the cells indicated below