Contribution by Reza Barati
Orouji et al. (2012) utilised simulated annealing (SA) and shuffled frog leaping algorithm (SFLA) algorithms to calibrate the parameters of the non-linear Muskingum model. The study is both appropriate and interesting, especially for the application of SFLA, but the discusser would like to draw attention to two points – flood routing model classification and storage equation selection.
Classification of flood routing models
Orouji et al. (2012) indicated that there are two general procedures to route the hydrograph of flooding along river reaches – hydraulic (i.e. distributed) and hydrologic (i.e. lumped) routing procedures. However, not only one-dimensional (1D) and 2D distributed flood routing models (Akbari and Barati, 2012; Xia et al., 2012) and lumped flood routing models (Barati, 2011) can be used to route the hydrograph of the downstream section, but semi-distributed models such as Muskingum–Cunge procedures (Barati et al., 2013; Perumal and Sahoo, 2007) can also be used.
Selection of storage equation
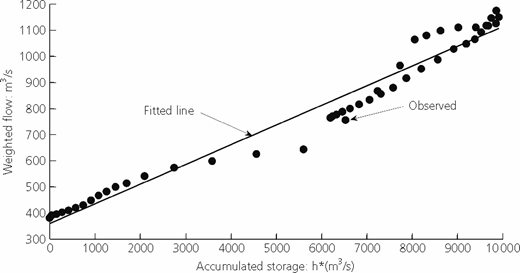
Orouji et al. (2012) used the data of Karoon River as a real case study. However, the use of a non-linear model for this dataset is questionable. Selection of the storage equation is based on the relationship between weighted flow (i.e. [XIt + (1 − X)Ot] where It and Ot are the inflow and outflow at time t, respectively, and X is the weighting factor) and storage volume (Yoon and Padmanabhan, 1993) by considering the features of catchments (e.g. area, shape, morphology, lithology and vegetation) and the features of flood and rainfall events (e.g. rainfall intensity and duration) that affect the relationship. Because the second case study of the original paper, unlike the first one, does not have a non-linear relationship (see Figure 9), use of a linear model might be more appropriate. The routing equation of the linear model can be developed by combining Equations 1 and 2 of the original paper. Although several methods are available for determining the parameters of the linear model (Yoon and Padmanabhan, 1993), the least-squares method (LSM) of Aldama (1990) is used here.
In the original paper, the SFLA has better results than SA in terms of statistics. The best results of the SFLA, for the second case study, in ten runs were
• sum of the square deviation of observed and computed outflows (SSQ) = 130 928·6473, the absolute value of the deviations of the peak of computed and observed outflows (DPO) = 12·9905 and the deviation of peak time of computed and observed outflows (DPOT) = 0
• the sum of the absolute value of the deviations betweeen computed and observed outflows (SAD) = 1835·6291, DPO = 14·7764 and DPOT = 0
for SSQ and SAD objective functions respectively. However, the LSM can improve the results of the SFLA with two parameters K = 12·76 h and X = 0·12833 as SSQ = 101 033·0005, SAD = 1497·1920, DPO = 37·0995 and DPOT = 0. The LSM improves results by 22·83% and 18·44% in terms of SSQ and SAD respectively. However, the DPO of the SFLA is lower than the LSM. The discusser agrees with the authors that DPO and DPOT are important criteria for the hydrograph, although it is notable that SSQ and SAD are the premier measures because they are the objective functions. In other words, it is possible that the LSM improves DPO, in addition to SSQ and SAD, more than the SFLA for other flood events with the linear relationship. If the linear model using LSM is applied to calibrate Wilson's data (Wilson, 1974), the results of the statistics, for parameters K = 27·692 h and X = 0·24868, are SSQ = 655·5257, SAD = 100·9442, DPO = 1·5595 and DPOT = 1, which are increases (i.e. worse) than the results of both SFLA and SA of the non-linear model. These results confirm that selection of the storage equation depends on the linear or non-linear nature of flood event data.
Conclusion
The linear Muskingum model is more appropriate than a non-linear model for data such as those from Karoon River because
• the linear form has fewer degrees of freedom (i.e. only two parameters), which is important especially in the verification step
• the linear form improves the results of SSQ and SAD (the most important statistics)
• the routing parameters can be determined in a deterministic manner in only one run using the LSM.
Furthermore, the LSM is simple and explicit without the need to determine the limits of routing parameters, some algorithm parameters and/or initial guesses of design parameters that are required for meta-heuristic algorithms and mathematical techniques. However, use of the non-linear Muskingum model is more appropriate for flooding with a non-linear relationship (e.g. Wilson's data).
Authors' reply
The authors thank the respected discusser for his constructive comments on the original paper. The following responses are presented to clear some obscure issues raised by the discusser.
Although the discusser has classified routing methods along river reaches as lumped, semi-distributed and distributed models, other investigations (Abida et al., 2005; Orouji et al., 2013; Samani and Shamsipour, 2004) have also grouped routing methods into hydrologic and hydraulic routing methods. In the latter classification, the semi-distributed category has been merged with the hydraulic routing methods category.
The flood routing problem has been studied by employing simulation, optimisation and simulation–optimisation approaches in several investigations. The approach in the original paper focuses on the performance of the optimisation algorithm to determine an appropriate solution by using the same simulation model employed by other investigators with different optimisation algorithms. Thus, linear and non-linear relations for the Muskingum equation as the simulation model do not directly affect the performance of the employed optimisation algorithm. However, in the original paper, the same simulation model should be used to make the results of different optimisation algorithms comparable.
On the basis of Figure 9, the discusser claims that use of the linear Muskingum model might be more appropriate in the second case study of the original paper. Although the illustration shows an approximately linear relation, the latter may not be applicable along other river reaches. However, the linearity of the Muskingum model should be verified in each river reach by using field data, which were not available in the considered case study of the original paper.
Moreover, mathematically speaking, a non-linear form of any equation represents various linear forms of the same equation. In this regard, consideration of the non-linear form of the Muskingum model, as done in the original paper, indirectly covers its linear form and the results can be expressed either in linear or non-linear forms.
As mentioned by the discusser, the LSM is a simple and explicit method in which there is no need to determine limits of routing parameters of a linear form. To respond to this, the simulation model of the second case study was considered by using the discusser's suggestion (linear relation) and results of the model computed using the SFLA. Table 1 shows the obtained results. The best performance with the minimum SSQ and the SAD between observed and routed outflows as the objective functions are respectively 4·75% and 4·69% better (lower) than the corresponding values obtained by the LSM suggested by the discusser. Thus, a linear form of the Muskingum model coupled with the SFLA performed better than the LSM.
Even though the discusser mentioned that ‘…DPO and DPOT are important criteria for the hydrograph, although it is notable that SSQ and SAD are the premier measures because they are the objective functions', the authors emphasise that an appropriate method for estimating the Muskingum model parameters improves the value of the objective function as well as other performance criteria, such as DPO, simultaneously. The DPO (37·0995 m3/s) obtained by the LSM is considerably different from that of the non-linear Muskingum relation produced by the SFLA (12·9905 m3/s) in the original paper. Thus, the LSM solution does not represent the best parameters for the Muskingum model.