


As social networks have developed to be a ubiquitous platform of public opinion spreading, it becomes more and more crucial for maintaining social security and stability by accurately predicting various trends of public opinion dissemination in social networks. Considering the fact that the dissemination of online public opinion is a dynamic process full of uncertainty and complexity, this study establishes a novel conformable fractional discrete grey model with linear time-varying parameters, namely the CFTDGM(1,1) model, for more accurate prediction of online public opinion trends.
First, the conformable fractional accumulation and difference operators are employed to build the CFTDGM(1,1) model for enhancing the traditional integer-order discrete grey model with linear time-varying parameters. Then, to improve forecasting accuracy, a base value correction term is introduced to optimize the iterative base value of the CFTDGM(1,1) model. Next, the differential evolution algorithm is selected to determine the optimal order of the proposed model through a comparison with the whale optimization algorithm and the particle swarm optimization algorithm. The least squares method is utilized to estimate the parameter values of the CFTDGM(1,1) model. In addition, the effectiveness of the CFTDGM(1,1) model is tested through a public opinion event about “IG team winning the championship”. Finally, we conduct empirical analysis on two hot online public opinion events regarding “Chengdu toddler mauled by Rottweiler” and “Mayday band suspected of lip-syncing,” to further assess the prediction ability and applicability of the CFTDGM(1,1) model by comparison with seven other existing grey models.
The test case and empirical analysis on two recent hot events reveal that the CFTDGM(1,1) model outperforms most of the existing grey models in terms of prediction performance. Therefore, the CFTDGM(1,1) model is chosen to forecast the development trends of these two hot events. The prediction results indicate that public attention to both events will decline slowly over the next three days.
A conformable fractional discrete grey model is proposed with the help of conformable fractional operators and a base value correction term to improve the traditional discrete grey model. The test case and empirical analysis on two recent hot events indicate that this novel model has higher accuracy and feasibility in online public opinion trend prediction.
1. Introduction
With recent progress in social networks, people are used to getting information, keeping up with current news and posting their own comments on social platforms such as Facebook, Instagram, Little Red Book (Xiaohongshu), TikTok (Douyin), Twitter (X), YouTube, WeChat, Weibo and so forth. While a large number of public opinions spread rapidly on various social platforms, online public opinion events are emerging from time to time. After the formation of public opinion events, they are influenced by various factors, leading to the generation of false information. These false pieces of information spread rapidly on social media platforms, just like true information, thus causing public opinion events to continue to capture the attention of the public, with the heat remaining unabated. This is detrimental to the positive development of events and may even lead to social conflicts. Therefore, timely forecasting and correctly guiding the evolution trend of public opinion on social networks are of great significance in maintaining social harmony and stability.
Numerous methods exist for forecasting social network public opinion, such as intelligent prediction models (Chen et al., 2021; Li, 2021; Liu and He, 2020; Xie et al., 2022) and statistical models (Lan et al., 2020; Wang, 2022), which can provide accurate predictions only when the number of samples is sufficient. However, online public opinion events are almost always sudden events, and public opinion data change too fast and have the typical characteristic of “information-poor” uncertainty. Drawing from these characteristics, some researchers have directed their focus toward the theory of grey systems presented by Deng (1989). It is a mathematical approach tailored for analyzing and addressing the problem of modelling uncertain systems that are “information-poor”. The grey forecasting model is the central content of this theory, encompassing the traditional grey model (GM(1,1)) (Liu and Deng, 2000), the three-parameter grey model (TPGM(1,1)) (Zhan and Shi, 2013), the linear time-varying parameters discrete grey model (TDGM(1,1)) (Zhang and Liu, 2010) which has strong simulation and forecasting capabilities for sequences with monotonically changing growth rates, the GM(1,N) model based on the new kernel and degree of grayness sequences (Xiong et al., 2020), and so on. They can get accurate forecasting results by modelling with little quantity of data. Therefore, scholars applied the grey prediction models to social network public opinion. Zhang et al. (2019) developed an improved TPGM(1,1) model by preprocessing the original sequence with the geometric mean weakening buffer operator and optimizing the initial value of the TPGM(1,1) model through the least squares method. The model was used to forecast the Baidu index of the “IG team winning the championship” event. Xie et al. (2023) established a multi-factor GM(1,n) model and improved it using metabolic theory and Markov theory. The enhanced model was used to forecast the development trends of the “Xinjiang cotton” and “Chengdu No. 49 high school” events on Weibo. Chen et al. (2023) introduced the concept of an increment coefficient and combined fuzzy neural network with the GM(1,1) model to establish a hybrid Mixed-FNNGM model. They used this model to predict the development trends of four Weibo news events, namely the “North Korea-United States Conference”, “97 Edition Tianlong Babu”, “Accusation of a Zhejiang enterprise by Liu Dehua” and “Birth of He Jie’s third child”. These grey prediction models all achieved good forecasting results in predicting social network public opinion.
Although grey models have achieved better results in social network public opinion prediction, most of the grey models currently used for social network public opinion prediction are integer-order accumulative. Due to the complex evolution process and rapid dissemination speed of social network public opinion events, integer-order grey models are evidently less adaptable. In contrast, fractional-order grey models, as extensions of integer-order ones, possess greater flexibility and applicability. They enable a more precise description of certain phenomena in the public opinion evolution systems and easier revelation of the intrinsic laws of the system objects. The fractional order grey model (FGM) was first presented by Wu et al. (2013). To reflect the new information prioritization principle, fractional order accumulation (FOA) was introduced into the GM(1,1) model. Through specific experiments, they proved an excellent predictive performance of the new model even with less data. Building upon this foundation, other fractional-order grey models have been further put forward by scholars. The fractional-order accumulated generating matrix was employed by Mao et al. (2016) to convert the first-order differential equations of GM(1,1) into fractional-order ones, thus proposing the FGM(q,1) model. They verified that this newly proposed model demonstrated higher modelling accuracy through a sequence of experiments. Wu et al. (2018) enhanced the performance and applicability of GMC(1,N) by extending it from first order to fractional order with the introduction of fractional order accumulated generating sequences. Zeng (2018) established a multivariable grey model based on fractional order accumulation and optimized the model by reconstructing the background value. Experimental findings demonstrated that the new model surpassed traditional models. The forecasting accuracy of the optimized model was further enhanced. Shi and Wu (2021) proposed the FHGM(1,1) model and applied it to forecast the AQCI of ten cities. Liu et al. (2022c) introduced a novel FPDGM(r,1,N) model, which could select suitable structures according to the features of original data and exhibit strong predictive performance. Kang et al. (2021) proposed the VOAKFGM model by extending the constant order accumulation generation of the classical grey model to the variable order fractional order accumulation generation, and applied it to predict complex dynamical systems.
Apart from the fractional-order grey models mentioned earlier, Ma et al. (2020) proposed new concepts, namely the conformable fractional accumulation operator (CFAO) and conformable fractional difference operator (CFDO), which were employed to improve the GM(1,1) model. Accordingly, a new conformable fractional grey model (CFGM) was constructed. Experimental demonstrations have shown that this model outperformed the conventional FGM(1,1) model. In addition, the implementation of CFAO and CFDO is not only convenient but also capable of substituting the fractional-order operations employed in existing fractional-order grey models. Consequently, this significant progress has drawn much attention of many scholars. In Table 1, we compare some continuous grey models with conformable fractional accumulations or derivatives proposed by researchers in recent years. For conformable fractional discrete grey models, Liu et al. (2022b) proposed a new CFUGPM(1,1) model to enhance the prediction capability for data sequences with nonlinear and complex characteristics. Zhu et al. (2023) constructed a new multi-faceted optimization GM(1,N) model, which further improved the multivariate grey prediction model. Wang et al. (2023) proposed a CFTDNGBM(1,1) model with time delay effects for predicting rural regional economies. Tong et al. (2023) introduced the CFAO to improve the non-homogeneous discrete grey model and proposed the CFNDGM(1,1) model. By incorporating the conformable fractional operators, Zhu et al. (2024) extended the integer-order DGM(1,1) model and established the CFDGM(1,1) model.
Comparison of some conformable fractional continuous grey models in the literature
| References | Models | Accumulation forms | Research objectives | Applications |
|---|---|---|---|---|
| Wu et al. (2020) | CFNGM(1,1,k,c) | α-CFA | Unify the forms of CFAO and CFDO, and utilize them to propose the CFNGM(1,1,k,c) model | Predict the carbon dioxide emissions of BRICS countries |
| Xie et al. (2020) | CFGOM(1,1) | α-CFA | Develop a novel conformable fractional grey model in the opposite direction and use it to study China’s electricity consumption | Predict the electricity consumption of Beijing, Fujian, and Shandong in China |
| Wu et al. (2022) | CFGMC(α,N) | α-CFA | Establish a novel conformable fractional derivative multivariate grey model to advance the development of multivariate grey forecasting models incorporating the conformable fractional derivative | Predict the urban consumption per capita of China |
| Wang and Qian (2022) | CFGNOM(1,1) | α-NOAGO | Propose a new conformable fractional opposite-direction calculation and use it to construct the CFGNOM(1,1) model, which can better reflect the principle of prioritizing new information | Predict the per capita primary energy consumption of South and Central America |
| Xie et al. (2024) | GCFGM(1,1) | α-GCFA | Provide the definitions of generalized conformable fractional accumulation and difference, and propose the GCFGM(1,1) model | Predict China’s overall energy consumption, natural gas consumption, and gross domestic product |
| Li et al. (2024) | DCFBM(1,1,k,c) | α-DCFA | Propose a new damped conformable fractional Bernoulli model to better handle random and highly volatile data | Predict the global industrial coal consumption and global coal production |
Source(s): The authors
Following the above line of exploration, this paper extends the TDGM(1,1) model with the help of conformable fractional operators to construct the CFTDGM(1,1) model. This model can be employed to make more precise predictions about social networks’ public opinion. The main contributions are outlined as follows:
- (1)
The CFTDGM(1,1) model is constructed by virtue of the CFAO and CFDO to enhance the existing TDGM(1,1) model.
- (2)
The base value correction term is added to optimize the iterative base value of the CFTDGM(1,1) model, and it is obtained by means of an approach based on the principle of least squares.
- (3)
The differential evolution (DE) algorithm is selected to determine the optimal order of the CFTDGM(1,1) model through a comparison with the whale optimization (WO) algorithm and the particle swarm optimization (PSO) algorithm. The least squares method is utilized to estimate the model parameter vector of the proposed model.
- (4)
The effectiveness of the CFTDGM(1,1) model is tested through a public opinion event about “IG team winning the championship”.
- (5)
The presented CFTDGM(1,1) model is utilized to forecast the trend of online public opinion on two recent hot events regarding “Rottweiler mauls Chengdu toddle” and “Mayday band suspected of lip-syncing”. The comparative analysis is conducted among eight different grey models to further demonstrate the superiority of the proposed model in terms of prediction performance, stability, and applicability.
- (6)
The CFTDGM(1,1) model is utilized to predict the public opinion trends of two hot events in the next three days.
The subsequent sections of the paper are organized as follows: Section 2 reviews the fundamental concepts of conformable fractional operators and the traditional integer-order TDGM(1,1) model. Section 3 discusses the establishment of the CFTDGM(1,1) model and the determination of the optimal model order. Section 4 focuses on the selection of optimization algorithms, stepwise description for applying the CFTDGM(1,1) model and a test of the proposed model. Section 5 conducts empirical analysis on two online public opinion events to further assess the prediction ability and applicability of the CFTDGM(1,1) model. Section 6 summarizes this study and suggests possible direction for further exploration.
2. Preliminaries
In this section, we recall some fundamental notions which are necessary for proposing the CFTDGM(1,1) model.
2.1 Conformable fractional operators
Sebah and Courdon (2002) The function Γ(x) is given by
For any positive integer n, we have Γ(n + 1) = n!.
Wu et al. (2020) The CFAO of f(t) is given by
Ma et al. (2020) The CFAO and CFDO of f(t) satisfy the following equation:
2.2 The TDGM(1,1) model
Zhang and Liu (2010) Let X(0) = {x(0)(1), x(0)(2), …, x(0)(s)} be a non-negative sequence and its first-order accumulated generating sequence be X(1) = {x(1)(1), x(1)(2), …, x(1)(s)}. Then the TDGM(1,1) model is expressed as
Using the least squares method, the following result for estimating the parameters in the TDGM(1,1) model is obtained.
Gao et al. (2019) Suppose that is the parameter vector of the TDGM(1,1) model. Then the least squares estimation of this parameter vector is given by
Based on Definition 4 and Theorem 1, the following recursive formula of the TDGM(1,1) model is obtained.
Zhang and Liu (2010) Let X(0) = {x(0)(1), x(0)(2), …, x(0)(s)} be a non-negative sequence and its first-order accumulated generating sequence be X(1) = {x(1)(1), x(1)(2), …, x(1)(s)}. Assume that . Then the recursive formula of the TDGM(1,1) model is as follows:
In Proposition 2, the iterative base value is assumed to be . However, the selection of this base value may cause the accumulation and transmission of errors in the TDGM(1,1) model (Zhang and Liu, 2010). Therefore, the iterative base value of this model needs to be further optimized by adding a correction term ϱ5 to the iterative base value (Liu et al., 2022a), so as to obtain the modified TDGM(1,1) model as follows:
For the solution of ϱ5, we use a method similar to the least squares principle to build the unconstrained optimization model shown in Eq. (9):
where is a primary polynomial with respect to ϱ5 and t = 1, 2, …, s.
Let , then H is a quadratic polynomial in terms of ϱ5, and the term coefficients are positive real. Thus, by making , we can obtain ϱ5.
3. The CFTDGM(1,1) model
The integer-order TDGM(1,1) model does not respond well to the flexibility and stochasticity of time series. Fractional-order grey models are more flexible and effective than integer-order grey models in time series forecasting and have better applicability to the evolution of simplex systems. In this section, we introduce the CFAO and CFDO on the basis of TDGM(1,1) to construct the CFTDGM(1,1) model.
3.1 Establishment of the CFTDGM(1,1) model
Let X(0) = {x(0)(1), x(0)(2), …, x(0)(s)} be a non-negative sequence, and its ς-order conformable accumulated generating sequence be X(ς) = {x(ς)(1), x(ς)(2), …, x(ς)(s)}. Then the CFTDGM(1,1) model is given by
Building on Definition 5, we give the following least squares estimation expression for the CFTDGM(1,1) model and the proof of the expression.
Assume that be the parameter vector of the CFTDGM(1,1) model. Then the least squares estimation of this parameter vector is expressed as
Proof From Eq. (10), we can obtain
Replacing x(ς)(t + 1) by , We can get the following error sequence:
Let , the parameter column that minimizes E according to the least squares method, should satisfy the following equations
Organizing Eq. (15), we get the following equations
According to Eq. (16), we have that
This completes the proof.□
According to Definition 5 and Theorem 2, we present the following recursive function expression for the modified CFTDGM(1,1) model and its proof.
Let X(0) = {x(0)(1), x(0)(2), …, x(0)(s)} be a non-negative sequence, and its ς-order conformable accumulated generating sequence be X(ς) = {x(ς)(1), x(ς)(2), …, x(ς)(s)}. Assume that . Then the recursive function of the modified CFTDGM(1,1) model can be expressed as
Proof By substituting the obtained into Eq. (10), we have
By substituting into Eq. (18), we have
This completes the proof.□
The restored sequence can be calculated as follows:
In Theorem 3, the base-value correction term ϱ5 is added to optimize the iterative base value of the CFTDGM(1,1) model. This term can be obtained by means of an approach based on the principle of least squares. More specifically, we consider an optimization problem as follows:
Firstly, substituting the obtained into Eq. (17), let
Then, substituting Eq. (17) into Eq. (21), the ϱ5 value that minimizes S satisfies the following equation:
Finally, the expression for ϱ5 is given by
3.2 Determination of the optimal model order
For the construction of the CFTDGM(1,1) model, the determination of the optimal order ς of the model is of utmost importance. In this section, an optimization problem with the mean absolute percentage error (MAPE) as the objective function is constructed for determining the optimal order ς. In this optimization problem, we split the initial dataset into two parts: one is employed to train the CFTDGM(1,1) model, while the other is used to assess the precision of the model’s predictions. The MAPE for the simulation and the forecasting phases can be computed respectively as follows:
where the length of the simulated sequence is represented by s, and l signifies the length of the predicted sequence.
To determine the optimal order ς, the following optimization problem needs to be solved:
Nevertheless, this optimization problem is too complicated to be solved by traditional methods. Therefore, we try to use the particle swarm optimization (PSO) algorithm (Kennedy and Eberhart, 1995), the differential evolution (DE) algorithm (Storn and Price, 1997), and the whale optimization (WO) algorithm (Mirjalili and Lewis, 2016) to obtain the optimal order ς in the next section. The advantages and disadvantages of these optimization algorithms are briefly summarized in Table 2. In addition, Table 3 lists several widely used metrics for evaluating prediction errors of grey models.
Comparison of three optimization algorithms
| Algorithms | Advantages | Disadvantages |
|---|---|---|
| WO | Simple structure, few parameters, and strong global search capability | Unstable performance in handling multimodal problems |
| PSO | Fast convergence speed, few parameters, and easy implementation | Tendency to fall into local optimality in complex high-dimensional search spaces |
| DE | Broad applicability, and strong robustness | Slow convergence speed in solving high-dimensional and complicated problems |
Source(s): The authors
4. Selection of optimization algorithms and a test of the proposed model
4.1 Selection of optimization algorithms
To choose the most appropriate way of determining the optimal model order, we separately use the above mentioned three optimization algorithms to conduct 100 times of numerical experiments on the data from the “IG team winning the championship” event (Zhang et al., 2019). In view of the fact that the average MAPE values of these algorithms are all equal to 0.2606%, it can be inferred that all three algorithms perform well in terms of prediction accuracy. Figure 1 shows the MAPE values of three algorithms in 100 times of experiments. As shown in Figure 1, it is evident that the DE algorithm is most stable while the PSO algorithm ranks second. In contrast, the WO algorithm shows a relatively high fluctuation in 100 times of experiments. Considering the stability and other features listed in Table 2, the DE algorithm is selected to determine the optimal order of the fractional-order grey models in this study.
The optimal model order determination method based on DE.

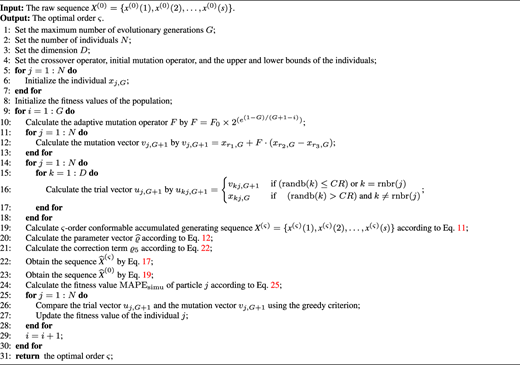
The DE algorithm is a global optimization algorithm used for solving multidimensional optimization problems of high complexity. It includes three main operations as follows:
- (1)
Mutation operation: generates mutation vectors by performing weighted differential operations on individuals within the population, introducing new solutions.
- (2)
Crossover operation: combines parts of the mutation vector with the original individual vector to create a new trial vector, enhancing the diversity of solutions.
- (3)
Selection operation: compare the trial vector and the mutation vector using the greedy criterion, selecting the better individuals to move forward to the next generation.
The optimal model order determination method based on DE is described in Algorithm 1. Table 4 lists the parameters involved in the DE algorithm.
Parameter descriptions of the DE algorithm
| Parameters | Descriptions |
|---|---|
| F0 | Initial mutation operator |
| r1 | Random number, r1 ∈ {1, 2, …, N} |
| r2 | Random number, r2 ∈ {1, 2, …, N} |
| r3 | Random number, r3 ∈ {1, 2, …, N} |
| CR | Crossover probability, CR ∈ [0, 1] |
| randb(k) | The k-th evaluation of the uniform random number generator, randb(k) ∈ [0, 1] |
| rnbr(j) | Randomly selected index, rnbr(j) ∈ 1, 2, …, D |
Source(s): The authors
4.2 Stepwise description for applying the CFTDGM(1,1) model
The steps for applying the CFTDGM(1,1) model can be described as follows:
Step 1. Input the initial sequence X(0).
Step 2. Determine the optimal order ς of the model with the DE algorithm.
Step 3. Compute the ς-order conformable accumulated generating sequence X(ς) by Eq. (11).
Step 4. Estimate the parameter vector of the model according to Eq. (12).
Step 5. Calculate the base value correction term ϱ5 by Eq. (22).
Step 6. Compute the simulated sequence of the sequence X(ς) by Eq. (17).
Step 7. Calculate the restored sequence by reducing with Eq. (19).
Step 8. Obtain the predicted sequence with combined use of Eq. (17) and Eq. (19).
Step 9. Compute the MAPESimu of the restored sequence by Eq. (23).
Step 10. Compute the MAPEFore of the predicted sequence by Eq. (24).
4.3 Test of the proposed model
The data source used in the previous subsection is consistently employed for testing our new model. The data from November 3 to November 10 (i.e. Day 1–8), 2018, is used as the training set. The data from November 11 to November 12 (i.e. Day 9–10), 2018, is used as the test set. We use the CFTDGM(1,1) model for prediction, and the TPGM(1,1) model (Zhan and Shi, 2013) for comparison. The DE algorithm is used to solve the optimal order of the CFTDGM(1,1) model and the obtained result is ς = 0.1932. Figure 2 illustrates the comparison of the Baidu-index results given by the CFTDGM(1,1) and TPGM(1,1) models. The experimental results of two grey models are shown in Table 5.

Experimental results obtained by two grey models
| Day | Raw data | TPGM(1,1) | CFTDGM(1,1) | ||
|---|---|---|---|---|---|
| Data | APE(%) | Data | APE(%) | ||
| Fitting stage | |||||
| 1 | 35,170 | 35170.00 | 0.00 | 35170.50 | 0.00 |
| 2 | 25,595 | 25739.40 | 0.98 | 25992.10 | 0.01 |
| 3 | 18,871 | 19475.00 | 3.20 | 18884.80 | 0.07 |
| 4 | 15,565 | 15530.50 | 0.22 | 15545.20 | 0.13 |
| 5 | 13,431 | 13046.80 | 2.86 | 13399.90 | 0.23 |
| 6 | 11,646 | 11482.90 | 1.40 | 11747.40 | 0.87 |
| 7 | 10,621 | 10498.10 | 1.16 | 10540.60 | 0.76 |
| 8 | 9,428 | 9878.02 | 4.77 | 9426.87 | 0.01 |
| MAPESimu(%) | 1.82 | 0.26 | |||
| Forecasting stage | |||||
| 9 | 7,928 | 9487.57 | 19.67 | 8769.40 | 10.61 |
| 10 | 6,425 | 9241.71 | 43.84 | 7634.19 | 18.82 |
| MAPEFore(%) | 31.76 | 14.72 | |||
Source(s): The authors
According to the judgment standard given by Lewis (1982), the MAPE value less than 10% indicates that the model prediction results are highly accurate, while the MAPE value ranging from 20% to 50% reveals that the results given by the prediction model are reasonable. From Table 5, it can be seen that the MAPESimu of the CFTDGM(1,1) model is 0.26% and the MAPESimu of the TPGM(1,1) model is 1.82%. This suggests that both models have good fitting performance. During the prediction phase, the MAPEFore values for these two models are respectively 14.72% and 31.76%, indicating that the CFTDGM(1,1) model has higher prediction accuracy. Moreover, the comparison of the Baidu-index results in Figure 2 shows that the overall trend of the Baidu-index given by the CFTDGM(1,1) model is closer to the trend of the raw data.
Table 6 shows the error values of these two models. The MAPE, MAE, and RMSE values of the CFTDGM(1,1) model are smaller than those of the TPGM(1,1) model, indicating that the prediction performance of the CFTDGM(1,1) model is superior to that of the TPGM(1,1) model. In conclusion, the CFTDGM(1,1) model is more suitable than the existing TPGM(1,1) model for predicting the development trend of online public opinion.
5. Forecasting online public opinion using the CFTDGM(1,1) model
One of Baidu’s applications is the Baidu Index, which can give statistics on the number of searches for specific keywords within a certain timeframe, and the statistics are relatively objective. Therefore, to validate the effectiveness of CFTDGM(1,1) in social network opinion forecasting, the data of public opinion events selected in this section are sourced from the Baidu Index. Taking two recent events “Chengdu toddler mauled by Rottweiler” and “Mayday band suspected of lip-syncing” as examples, the CFTDGM(1,1) model is constructed using the Baidu index of these two events as the raw data series. We utilize seven different existing grey models, including the discrete grey model (i.e. the DGM(1,1) model by Xie and Liu (2009)), the three-parameter discrete grey model (i.e. the DGM(1,1)3 model by Sun and Zhou (2018)), the new non-homogenous discrete grey model (i.e. the NNDGM(1,1) model by Zhang (2020)), the fractional-order accumulation linear time-varying parameters discrete grey model (i.e. the FTDGM(1,1) model by Gao et al. (2019)), the TDGM(1,1) model by Zhang and Liu (2010), the CFGM(1,1) model by Ma et al. (2020), the CFNDGM(1,1) model by Tong et al. (2023) as comparative models, to further assess the prediction ability and applicability of the CFTDGM(1,1) model.
5.1 Case 1: “Chengdu toddler mauled by Rottweiler” event
On October 16, 2023, in Chongzhou, Chengdu, Sichuan Province, a two-year-old girl was mauled by a Rottweiler dog in a residential community, resulting in multiple bite wounds all over her body, laceration of her right kidney, and fracture of her right ribs. Subsequently, surveillance footage was exposed and quickly circulated on the Baidu platform, sparking intense discussion and drawing attention from netizens, leading to a continuous rise in the event’s popularity.
We collected the Baidu index data regarding the “Chengdu toddler mauled by Rottweiler” event from October 18 (i.e. Day 1) to October 31 (i.e. Day 14), 2023. Specifically, we used Python to crawl the Baidu index data with two keywords “dog bites child in Chengdu all video” and “news on dog biting people in Chengdu”, respectively. The obtained two sets of collected data were merged into the original data set of the “Chengdu toddler mauled by Rottweiler” event, as shown in Table 7. The data from October 18 (i.e. Day 1) to October 27 (i.e. Day 10), 2023, is utilized for modelling. The data from October 28 (i.e. Day 11) to October 31 (i.e. Day 14), 2023, is used for out-of-sample validation.
Raw data of the “Chengdu toddler mauled by Rottweiler” event
| Day | 1 | 2 | 3 | 4 | 5 | 6 | 7 | 8 | 9 | 10 | 11 | 12 | 13 | 14 |
|---|---|---|---|---|---|---|---|---|---|---|---|---|---|---|
| Baidu index | 3,356 | 5,270 | 3,551 | 2,324 | 2,016 | 1,704 | 1,746 | 971 | 943 | 733 | 687 | 604 | 494 | 460 |
Source(s): The authors
With the collected data, we construct the CFTDGM(1,1) model and solve it in MATLAB environment. The specific solving process is shown as follows:
Step 1. We can get the initial sequence
from the data given in Table 7.
Step 2. We build the corresponding optimization problem using Eq. (25), and solve it with the DE algorithm to get the optimal order ς = 1.9855.
Step 3. By substituting the order ς = 1.9855 and the raw data from Day 1 to Day 10 into Eq. (11), we can obtain the following conformable accumulated generating sequence:
Step 4. The sequence X(1.9855) is used to construct the matrices G and W , from which we can obtain the parameters
by Eq. (12).
From Eq. (26), we can obtain the simulated sequence as follows:
Step 7. According to Eq. (19), we can get the restored sequence as follows:
Table 8 displays the experimental results of DGM(1,1), NNDGM(1,1), DGM(1,1)3, TDGM(1,1), CFTDGM(1,1), CFNDGM(1,1), FTDGM(1,1), CFGM(1,1) models. As shown in Table 8, the MAPESimu of the eight models are 11.26%, 9.30%, 19.61%, 9.15%, 7.68%, 7.33%, 6.31% and 11.05%, respectively. The MAPEFore of these models are 44.14%, 42.48%, 8.50%, 22.57%, 1.97%, 16.98%, 53.92%, 42.79%, respectively. In both the simulation and forecasting stages, the MAPE values of the CFTDGM(1,1) model are less than 10%. Moreover, the MAPEFore of the CFTDGM(1,1) model is only 1.97%. We can conclude that the predictive accuracy of the CFTDGM(1,1) model is higher than that of the other seven models.
Experimental results obtained by eight grey models in Case 1
| Day | DGM(1,1) | NNDGM(1,1) | DGM(1,1)3 | TDGM(1,1) | CFTDGM(1,1) | CFNDGM(1,1) | FTDGM(1,1) | CFGM(1,1) |
|---|---|---|---|---|---|---|---|---|
| Fitting stage | ||||||||
| 1 | 3356.00 | 3354.95 | 3356.00 | 3366.44 | 3356.75 | 3356.39 | 3356.00 | 3356.00 |
| 2 | 4865.59 | 5244.11 | 5270.00 | 5223.93 | 5356.26 | 5381.82 | 5344.54 | 4827.08 |
| 3 | 3739.30 | 3445.55 | 3309.73 | 3508.90 | 3236.53 | 3188.68 | 3297.34 | 3721.14 |
| 4 | 2873.73 | 2638.44 | 3070.93 | 2552.72 | 2603.32 | 2599.99 | 2542.65 | 2868.58 |
| 5 | 2208.51 | 2068.00 | 2588.86 | 2000.59 | 2102.79 | 2119.99 | 2074.48 | 2211.36 |
| 6 | 1697.29 | 1608.77 | 2134.78 | 1641.51 | 1707.76 | 1728.61 | 1722.88 | 1704.71 |
| 7 | 1304.40 | 1312.06 | 1750.74 | 1382.11 | 1396.19 | 1409.28 | 1432.38 | 1314.14 |
| 8 | 1002.45 | 1085.37 | 1433.81 | 1184.02 | 1150.54 | 1149.27 | 1178.92 | 1013.06 |
| 9 | 770.41 | 1018.87 | 1173.84 | 1028.00 | 956.89 | 937.09 | 950.40 | 780.95 |
| 10 | 592.07 | 902.55 | 960.92 | 902.31 | 804.27 | 764.09 | 740.29 | 602.03 |
| MAPESimu(%) | 11.26 | 9.30 | 19.61 | 9.15 | 7.68 | 7.33 | 6.31 | 11.05 |
| Forecasting stage | ||||||||
| 11 | 455.02 | 845.16 | 786.60 | 799.24 | 684.03 | 623.03 | 544.88 | 464.10 |
| 12 | 349.69 | 791.94 | 643.91 | 713.47 | 589.36 | 508.01 | 362.05 | 357.77 |
| 13 | 268.74 | 761.13 | 527.10 | 641.21 | 514.89 | 414.22 | 190.60 | 275.80 |
| 14 | 206.53 | 743.85 | 431.48 | 579.69 | 456.39 | 337.75 | 29.91 | 212.61 |
| MAPEFore(%) | 44.14 | 42.48 | 8.50 | 22.57 | 1.97 | 16.98 | 53.92 | 42.79 |
Source(s): The authors
The simulation and forecasting results for each model are displayed in Figure 3. It is evident that the data curve of CFTDGM(1,1) is closest to the original data curve, indicating that it has the best fitting and forecasting effect. The CFNDGM(1,1) model comes in second. The fitting performance of NNDGM(1,1) and TDGM(1,1) is good, but their prediction performance is poor, which indicates that the two models are overfitting. The DGM(1,1)3 model shows poor fitting performance but good prediction performance, which demonstrates that the model is underfitting. Additionally, the predicted values of TDGM(1,1) and NNDGM(1,1) are higher than the original data, and the predicted values of CFGM(1,1), DGM(1,1), and FTDGM(1,1) are lower than the original data. In contrast, the predicted values of CFTDGM(1,1) closely match the original data. This suggests that the forecasting results of the CFTDGM(1,1) model are more accurate. The reason for achieving good forecasting results is that the structure of the CFTDGM(1,1) model is inherently well-suited for predicting time series data with nonlinear characteristics. Moreover, this model is conformable fractional order, making its structure more flexible and better able to adapt to the complex features in the original data.

Figure 4 shows the box plots of APE values of eight grey models. As seen in Figure 4, the box plot of CFTDGM(1,1) is the shortest, indicating that the APE values of this model are more concentrated, and its prediction performance is the most stable among the eight grey models. In contrast, the box plots of the DGM(1,1) and CFGM(1,1) models are longer, suggesting that these models have larger prediction errors and lower stability. The box plots of the NNDGM(1,1) and FTDGM(1,1) models show outliers at the upper end, which indicates the presence of some larger APE values for these models. The box plot of the CFTDGM(1,1) model is positioned lowest, indicating that its overall prediction accuracy is superior to that of the other models.

To further compare the accuracy of the prediction results for these grey models, we calculated their MAPE, MAE, and RMSE values, as shown in Table 9. From Table 9, we are able to analyze that the MAE and MAPE values of CFTDGM(1,1) are 102.00 and 6.05%, which are smaller than the MAPE and MAE of the other seven grey models. Furthermore, although the RMSE result of CFTDGM(1,1) is not the smallest, its value is only a little higher than the RMSE of TDGM(1,1). In conclusion, the CFTDGM(1,1) model can more accurately forecast the future evolution trend of social network public opinion.
Comparison of the error values of eight grey models in Case 1
| Metrics | DGM(1,1) | NNDGM(1,1) | DGM(1,1)3 | TDGM(1,1) | CFTDGM(1,1) | CFNDGM(1,1) | FTDGM(1,1) | CFGM(1,1) |
|---|---|---|---|---|---|---|---|---|
| MAPE(%) | 20.66 | 18.78 | 16.44 | 12.99 | 6.05 | 10.09 | 19.91 | 20.12 |
| MAE | 220.95 | 163.20 | 222.81 | 123.22 | 102.00 | 128.06 | 162.71 | 218.24 |
| RMSE | 269.58 | 201.88 | 323.23 | 154.62 | 158.67 | 171.55 | 210.26 | 268.68 |
Source(s): The authors
5.2 Case 2: “Mayday band suspected of lip-syncing” event
On November 30, 2023, a music blogger on Weibo posted that Mayday was lip-synching. On the same day, Bilibili blogger “Maitian Nongfu” posted a video, claiming that through professional software identification, nearly half of the 12 songs performed by Mayday at the November 16 concert in Shanghai were lip-synced. On December 2 and 3, this blogger “Maitian Nongfu” posted two more videos of Mayday allegedly lip-synching. The incident of “Mayday band suspected of lip-syncing” continues to ferment, with related topics topping the social media trending list.
For further validation of the CFTDGM(1,1) model, we collected Baidu index data regarding the “Mayday band suspected of lip-syncing” public opinion hotspot event from December 4 (i.e. Day 1) to December 18 (i.e. Day 15), 2023. Using Python to crawl the Baidu index data of the keyword “Mayday lip-syncing”, which is used as the original data of the “Mayday band suspected of lip-syncing” event, as shown in Table 10. In the dataset shown in Table 10, the data from December 4 (i.e. Day 1) to December 13 (i.e. Day 10), 2023, are used for training, while the data from December 14 (i.e. Day 11) to December 18 (i.e. Day 15), 2023, are used for testing.
Raw data of the “Mayday band suspected of lip-syncing” event
| Day | 1 | 2 | 3 | 4 | 5 | 6 | 7 | 8 | 9 | 10 | 11 | 12 | 13 | 14 | 15 |
|---|---|---|---|---|---|---|---|---|---|---|---|---|---|---|---|
| Raw data | 13,320 | 9,712 | 11,864 | 11,439 | 6,629 | 3,522 | 2,906 | 2,881 | 1,900 | 1,930 | 1,832 | 1,647 | 1,302 | 1,168 | 1,368 |
Source(s): The authors
In the following, we build the corresponding optimization problem using Eq. (25), and solve it with the DE algorithm to get the optimal order ς = 0.2530. Then, we can obtain the parameters
by Eq. (12) and Eq. (22). By substituting these values of parameters and the optimal order ς = 0.2530 into Eq. (17), we have
According to Eq. (19), we can obtain
Table 11 shows the experimental results of the DGM(1,1), NNDGM(1,1), DGM(1,1)3, TDGM(1,1), CFTDGM(1,1), CFNDGM(1,1), FTDGM(1,1) and CFGM(1,1) models. From Table 11, we can conclude that the MAPESimu values of these models in the training phase are 20.11%, 18.22%, 29.63%, 8.34%, 6.42%, 15.02%, 4.75% and 21.53%, respectively. The MAPEFore values of eight models in the prediction stage are 30.29%, 46.35%, 64.81%, 30.74%, 9.60%, 68.81%, 12.04% and 25.97%, respectively. The MAPESimu values of the TDGM(1,1), CFTDGM(1,1), and FTDGM(1,1) models are all less than 10%, indicating that these three models have high simulation accuracy. During the forecasting phase, only the CFTDGM(1,1) model exhibits a MAPE below 10%, suggesting that its forecasting accuracy exceeds that of the other models. The MAPE value of FTDGM(1,1) is between 10% and 15%, making it the second-best in terms of prediction performance. While the MAPE of the remaining six grey models exceeds 20%, indicating poor predictive performance of these models.
Experimental results obtained by eight grey models in Case 2
| Day | DGM(1,1) | NNDGM(1,1) | DGM(1,1)3 | TDGM(1,1) | CFTDGM(1,1) | CFNDGM(1,1) | FTDGM(1,1) | CFGM(1,1) |
|---|---|---|---|---|---|---|---|---|
| Fitting stage | ||||||||
| 1 | 13320.00 | 13298.23 | 13320.00 | 13326.23 | 13321.76 | 13323.48 | 13320.00 | 13320.00 |
| 2 | 12598.55 | 12309.52 | 9712.00 | 9536.19 | 9619.87 | 9423.18 | 9568.76 | 12391.92 |
| 3 | 9992.60 | 9524.08 | 12931.60 | 12680.12 | 12364.03 | 13283.75 | 12297.32 | 9898.96 |
| 4 | 7925.67 | 8846.15 | 13020.34 | 10271.16 | 10571.65 | 9411.00 | 10911.59 | 7907.52 |
| 5 | 6286.28 | 7481.73 | 9986.30 | 6646.55 | 6841.58 | 6667.31 | 6764.72 | 6316.71 |
| 6 | 4985.99 | 4977.29 | 7074.32 | 4285.95 | 4100.21 | 4723.52 | 3791.20 | 5045.94 |
| 7 | 3954.65 | 3319.95 | 4867.67 | 3104.77 | 2905.49 | 3346.42 | 2906.00 | 4030.81 |
| 8 | 3136.65 | 2634.36 | 3311.04 | 2406.09 | 2391.36 | 2370.80 | 2484.73 | 3219.91 |
| 9 | 2487.85 | 2218.29 | 2241.72 | 1928.67 | 2041.80 | 1679.62 | 2155.90 | 2572.14 |
| 10 | 1973.25 | 1569.48 | 1514.83 | 1589.09 | 1787.85 | 1189.94 | 1946.98 | 2054.68 |
| MAPESimu(%) | 20.11 | 18.22 | 29.63 | 8.34 | 6.42 | 15.02 | 4.75 | 21.53 |
| Forecasting stage | ||||||||
| 11 | 1565.09 | 1311.89 | 1022.83 | 1333.73 | 1590.22 | 843.03 | 1747.37 | 1641.33 |
| 12 | 1241.36 | 1050.03 | 690.40 | 1138.48 | 1432.76 | 597.25 | 1637.58 | 1311.13 |
| 13 | 984.59 | 796.85 | 465.95 | 983.05 | 1302.59 | 423.13 | 1463.77 | 1047.36 |
| 14 | 780.93 | 529.18 | 314.45 | 859.59 | 1194.27 | 299.77 | 1474.85 | 836.66 |
| 15 | 619.40 | 360.77 | 212.21 | 756.57 | 101.14 | 12.37 | 1145.06 | 668.34 |
| MAPEFore(%) | 30.29 | 46.35 | 64.81 | 30.74 | 9.60 | 68.81 | 12.04 | 25.97 |
Source(s): The authors
Figure 5 shows the overall trends of each model. The overall trend curves of DGM(1,1), NNDGM(1,1) and CFGM(1,1) are monotonically decreasing, with significant deviations from the original data curve. The simulated and predicted trend curves of CFTDGM(1,1), FTDGM(1,1) align closely with the raw data curve, indicating that the prediction results of these two models are more accurate. The TDGM(1,1) model shows good simulation results but poor prediction results, indicating overfitting. The overall performance of the CFNDGM(1,1) and DGM(1,1)3 model is poor. Besides, we can conclude from the simulation stage that the simulated values of DGM(1,1) and CFGM(1,1) are not satisfactory from Days 2–4. The simulated values of DGM(1,1)3 show a significant deviation from the original data from Days 4–6. From the prediction results, the forecasted data of CFTDGM(1,1) and FTDGM(1,1) models is closer to the actual data. However, the performance of other models is mediocre, with their predicted data almost deviating from the raw data.

The box plots of the APE values of each model are shown in Figure 6. From Figure 6, it can be seen that the box plot of CFTDGM(1,1) is the shortest, and its position is the lowest. This indicates that the APE values of CFTDGM(1,1) exhibit minimal variation, and the predictive performance of this model is more stable compared to other grey models. The square in the box plot represents the mean value. Among the eight grey models, the mean value of the FTDGM(1,1) model is the lowest, indicating that this model has the smallest MAPE value. The MAPE value of the CFTDGM(1,1) model ranks second. The box plot of DGM(1,1)3 is the longest, with the upper edge near 100, indicating that this model has the worst predictive performance. Table 12 presents the performance metrics for each model. Observing Table 12, it becomes evident that the FTDGM(1,1) model achieves lower MAPE, MAE, and RMSE values compared to the other seven models. The CFTDGM(1,1) model ranks second in terms of overall performance metrics, and it has a slightly higher MAPE value than FTDGM(1,1) model.

Comparison of the error values of eight grey models in Case 2
| Metrics | DGM(1,1) | NNDGM(1,1) | DGM(1,1)3 | TDGM(1,1) | CFTDGM(1,1) | CFNDGM(1,1) | FTDGM(1,1) | CFGM(1,1) |
|---|---|---|---|---|---|---|---|---|
| MAPE(%) | 23.50 | 27.59 | 41.35 | 15.81 | 7.48 | 32.95 | 7.18 | 23.01 |
| MAE | 942.60 | 968.47 | 1154.55 | 415.76 | 251.73 | 788.83 | 197.56 | 939.03 |
| RMSE | 1390.39 | 1279.71 | 1553.20 | 523.10 | 350.87 | 953.91 | 255.26 | 1380.71 |
Source(s): The authors
In summary, the CFTDGM(1,1) model performs excellently in Case 1. In Case 2, the overall performance of CFTDGM(1,1) is second only to that of FTDGM(1,1). In both cases, the MAPE values of the simulation and prediction phases of the CFTDGM(1,1) model are within 10%. Therefore, the CFTDGM(1,1) model exhibits stable predictive performance and high prediction accuracy compared to other models and is suitable for forecasting social network public opinion.
5.3 Prediction
As shown in the previous subsections, the CFTDGM(1,1) model outperforms most of existing grey models in terms of forecasting performance. Consequently, we apply the CFTDGM(1,1) model to forecast the online public opinion trends for the “Chengdu toddler mauled by Rottweiler” event from November 1 (i.e. Day 15) to November 3 (i.e. Day 17), 2023 and the “Mayday band suspected of lip-syncing” event from December 19 (i.e. Day 16) to December 21 (i.e. Day 18), 2023. For the predictions to be reliable, we utilize the entire original dataset for fitting. We construct the corresponding optimization problems using Eq. (25), and solve them with the DE algorithm. Then, we obtain the optimal orders ς = 1.8443 for the first event and ς = 0.1043 for the second event. The efficiencies of the DE algorithm in searching for the optimal fitness values are shown in Figure 7, and the forecast results are illustrated in Figure 8. Figure 9 illustrates the predicted results of the concerned two events in the next three days.


From Figure 7, it can be observed that the minimum MAPE values of both events do not exceed 8% during the fitting phase. From Figure 8, it can be concluded that the overall curves of both events closely approximate the original curves. We can conclude that the CFTDGM(1,1) model has higher fitting accuracy. From Figures 8 and 9, it can be inferred that the online public opinion trends of both events continue to decline, suggesting that the public and media are gradually forgetting about these two events. However, the decline in the trends is relatively slow, which reflects that some people are still paying attention to and spreading both of the two hot events. Therefore, the government and relevant departments can refer to the forecasted trends of online public opinion to formulate relevant measures and actively guide public opinion, so as to further reduce and control the hotness of the events and prevent the hotness from rebounding.
6. Conclusion
The process of public sentiment evolution on social networks is marked by features like uncertainty and intricacy. Conventional integer-order grey models struggle to accommodate these features, leading to their inability to accurately forecast the trends in online public opinion. In light of this, we have improved the existing TDGM(1,1) model by virtue of the CFAO and CFDO, and constructed the CFTDGM(1,1) model. To further enhance the forecasting accuracy of the presented model, the correction term has been introduced to correct the iterative initial value of our model, and the DE algorithm has been chosen to solve the optimal order of the modified model through a comparison with the other two optimization algorithms. The performance of the CFTDGM(1,1) model has been tested through a public opinion event regarding “IG team winning the championship”, and the numerical results have indicated that the CFTDGM(1,1) model outperforms the existing TPGM(1,1) model in both simulation and prediction stages. To further evaluate the predictive capability, stability, and applicability of the CFTDGM(1,1) model, we have applied it to two hot online public opinion events regarding “Chengdu toddler mauled by Rottweiler” and “Mayday band suspected of lip-syncing”. Through comparison with seven other existing grey models, it has been shown that the CFTDGM(1,1) model is superior to most existing grey models in forecasting performance, stability and applicability. Consequently, we have used the CFTDGM(1,1) model to predict the online public opinion trends of these two events over the next three days. The results indicate that both events show a slowly declining trend, reflecting that they are still being followed by netizens and the media. Relevant departments can formulate corresponding measures based on the predicted trends in advance. This helps to prevent the incident from provoking public concern and emotional fluctuations again, maintain public order, and promote the construction of a harmonious society. Although the CFTDGM(1,1) model performs well in forecasting social network opinion trends, it is a univariate grey model which can be further extended and improved by considering multiple affecting factors in public opinion dissemination. In the future, we will further investigate multiple influential factors of social network public opinion by constructing multivariate fractional-order grey models to predict the intrinsic evolutionary patterns of online public opinion.
The authors would like to thank the Editor-in-Chief, the Associate Editor, and the anonymous referees for their valuable comments and suggestions, which greatly improve the quality of this paper. This work was partially supported by the National Natural Science Foundation of China [Grant No. 11301415], the Shaanxi Provincial Key Research and Development Program [Grant No. 2021SF-480], and the Natural Science Basic Research Plan in Shaanxi Province of China [Grant No. 2018JM1054].
Conflict of interest: On behalf of all authors, the corresponding author states that there is no conflict of interest.
Data availability: The data that support the findings of this study are enclosed in this paper.
Author contributions statement: Feng Feng, Xiaoxiao Ge and Jianke Zhang wrote the original draft of the manuscript. Xiaoxiao Ge and Jianke Zhang conducted data analysis. Feng Feng and Stefania Tomasiello conducted the formal analysis. All authors reviewed and revised the manuscript.

