

1-20 of 53198
Keywords: VIKOR
Close
Follow your search
Access your saved searches in your account
Would you like to receive an alert when new items match your search?
Journal

An important forum for the exchange of knowledge and information among all those who are interested in cybernetics and systems thinking.
Journal Articles
in The fragmented legacy of Heinz von Foerster: bibliometric mapping of second-order cybernetics, 1981–2025
> Kybernetes
Published: 20 August 2026
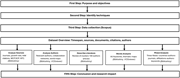
Figure 1 Methodological approach to the bibliometric analysis. Source(s): Author's work A flowchart illustrating the methodological approach to bibliometric analysis. The flowchart illustrates the methodological approach to bibliometric analysis. The process begins with the first step, which i... More about this image found in Methodological approach to the bibliometric analysis. Source(s): Author's w...
in The fragmented legacy of Heinz von Foerster: bibliometric mapping of second-order cybernetics, 1981–2025
> Kybernetes
Published: 20 August 2026
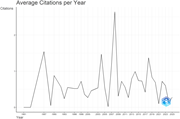
Figure 2 Evolution of annual scholarly output. Source(s): Author's work A line graph titled Average Citations per Year. A line graph titled Average Citations per Year. The x-axis represents the years from 1981 to 2025, and the y-axis represents the number of citations ranging from 0 to 2.5. Th... More about this image found in Evolution of annual scholarly output. Source(s): Author's work A line gr...
in The fragmented legacy of Heinz von Foerster: bibliometric mapping of second-order cybernetics, 1981–2025
> Kybernetes
Published: 20 August 2026
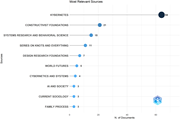
Figure 3 The ten most relevant journals. Source(s): Author's work A bar graph showing the number of documents from various sources. A horizontal bar graph compares the number of documents from different sources. The x-axis represents the number of documents, ranging from 0 to 70. The y-axis li... More about this image found in The ten most relevant journals. Source(s): Author's work A bar graph sho...
in The fragmented legacy of Heinz von Foerster: bibliometric mapping of second-order cybernetics, 1981–2025
> Kybernetes
Published: 20 August 2026
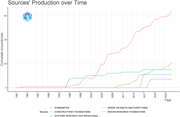
Figure 4 Cumulative growth of journals by the number of papers. Source(s): Author's work A line graph showing cumulative occurrences of journals over time from 1981 to 2023. The line graph illustrates the cumulative occurrences of journals over time, spanning from 1981 to 2023. The x-axis repr... More about this image found in Cumulative growth of journals by the number of papers. Source(s): Author's ...
in The fragmented legacy of Heinz von Foerster: bibliometric mapping of second-order cybernetics, 1981–2025
> Kybernetes
Published: 20 August 2026
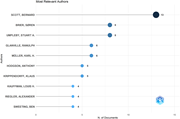
Figure 5 Ten most prolific authors by number of publications. Source(s): Author's work A dot plot showing the number of documents by various authors. A horizontal dot plot titled Most Relevant Authors. The horizontal axis represents the number of documents, ranging from 0 to 15. The vertical a... More about this image found in Ten most prolific authors by number of publications. Source(s): Author's wo...
in The fragmented legacy of Heinz von Foerster: bibliometric mapping of second-order cybernetics, 1981–2025
> Kybernetes
Published: 20 August 2026
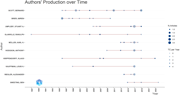
Figure 6 Publication output of the top ten authors over time. Source(s): Author's work A line graph showing authors' production over time. The line graph titled 'Authors' Production over Time' displays the publication output of the top ten authors from 1987 to 2023. The x-axis represents the y... More about this image found in Publication output of the top ten authors over time. Source(s): Author's wo...
in The fragmented legacy of Heinz von Foerster: bibliometric mapping of second-order cybernetics, 1981–2025
> Kybernetes
Published: 20 August 2026
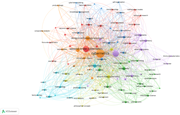
Figure 7 Overlay visualisation of the keyword co-occurrence analysis. Source(s): Figure by author A network diagram illustrating the co-occurrence of various keywords related to cybernetics. A network diagram illustrating the co-occurrence of various keywords related to cybernetics. The diagra... More about this image found in Overlay visualisation of the keyword co-occurrence analysis. Source(s): Fig...
in The fragmented legacy of Heinz von Foerster: bibliometric mapping of second-order cybernetics, 1981–2025
> Kybernetes
Published: 20 August 2026
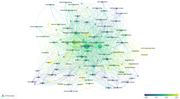
Figure 8 Distribution of keywords by year of publication (2005–2020). Source(s): Figure by author A network diagram illustrating the distribution of keywords by year of publication from 2005 to 2020. A network diagram illustrating the distribution of keywords by year of publication from 2005 t... More about this image found in Distribution of keywords by year of publication (2005–2020). Source(s): Fig...
in The fragmented legacy of Heinz von Foerster: bibliometric mapping of second-order cybernetics, 1981–2025
> Kybernetes
Published: 20 August 2026
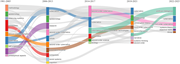
Figure 9 Thematic Evolution (1981–2025). Source(s): Author's work A diagram showing the thematic evolution from 1981 to 2025. The diagram illustrates the thematic evolution over several periods: 1981-2005, 2006-2013, 2014-2017, 2018-2021, and 2022-2025. Each period is represented by a vertical... More about this image found in Thematic Evolution (1981–2025). Source(s): Author's work A diagram showi...
in The fragmented legacy of Heinz von Foerster: bibliometric mapping of second-order cybernetics, 1981–2025
> Kybernetes
Published: 20 August 2026
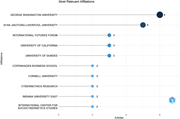
Figure 10 Ten most relevant affiliations. Source(s): Author's work A dot plot showing the most relevant affiliations and the number of articles associated with each. A horizontal dot plot represents the most relevant affiliations and the number of articles associated with each. The horizontal ... More about this image found in Ten most relevant affiliations. Source(s): Author's work A dot plot show...
in The fragmented legacy of Heinz von Foerster: bibliometric mapping of second-order cybernetics, 1981–2025
> Kybernetes
Published: 20 August 2026
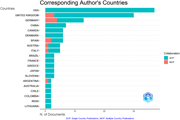
Figure 11 Countries of the 20 most relevant corresponding authors. Source(s): Author's Work A bar graph showing the number of documents by corresponding author's countries. The bar graph compares the number of documents by corresponding author's countries. The x-axis represents the number of d... More about this image found in Countries of the 20 most relevant corresponding authors. Source(s): Author'...
in The fragmented legacy of Heinz von Foerster: bibliometric mapping of second-order cybernetics, 1981–2025
> Kybernetes
Published: 20 August 2026
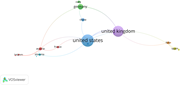
Figure 12 Twenty most relevant country networks. Source(s): Figure by author A Venn diagram showing the relationships and overlaps between different country networks. A Venn diagram representing the twenty most relevant country networks. The diagram consists of multiple overlapping circles, ea... More about this image found in Twenty most relevant country networks. Source(s): Figure by author A Ven...
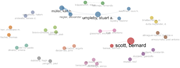
in The fragmented legacy of Heinz von Foerster: bibliometric mapping of second-order cybernetics, 1981–2025
> Kybernetes
Published: 20 August 2026
Figure 13 Collaboration author network. Source(s): Author's work A scatter plot of collaboration author network. A scatter plot visualizing a collaboration author network. The plot contains several data points, each representing an author. The x-axis and y-axis likely represent some form of au... More about this image found in Collaboration author network. Source(s): Author's work A scatter plot of...
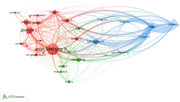
in The fragmented legacy of Heinz von Foerster: bibliometric mapping of second-order cybernetics, 1981–2025
> Kybernetes
Published: 20 August 2026
Figure 14 Co-citation clusters of cited authors. Source(s): Figure by author A network diagram of co-citation clusters of cited authors. A network diagram illustrating co-citation clusters of cited authors. The diagram features various nodes representing different authors, with lines indicatin... More about this image found in Co-citation clusters of cited authors. Source(s): Figure by author A net...
Journal Articles
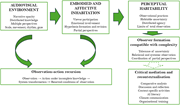
in Perceptual habitability: from observing systems to observer formation in second-order cybernetics
> Kybernetes
Published: 19 August 2026
Figure 1 Perceptual habitability: from audiovisual environments to observer formation. The diagram maps the theoretical model developed in the article. It shows how audiovisual environments characterized by narrative opacity, distributed knowledge, multiple perspectives and sensory-narrative affor... More about this image found in Perceptual habitability: from audiovisual environments to observer formatio...

in Perceptual habitability: from observing systems to observer formation in second-order cybernetics
> Kybernetes
Published: 19 August 2026
Figure 2 Two modes of observation in Attack on Titan. The figure contrasts Erwin Smith and Eren Yeager as two cybernetic configurations of observation. Erwin embodies distributed coordination: his gaze remains oriented towards action under incomplete knowledge, and his command depends on the coordination of partial observers rather than on a total view of the system. Eren, by contrast, progressively approximates the ideal of total observation: his gaze becomes saturated by memory, future vision and inevitability. The juxtaposition visualizes the article's central distinction between distributed coordination under uncertainty and the failed aspiration to total observation, in which the expansion of information corresponds to a contraction of perceived choices. Source and credits: Selected frames from Attack on Titan, Season 3, Episode 4; Attack on Titan Final Season: THE FINAL CHAPTERS Special 1; and Attack on Titan Opening 7, “The Rumbling”. Attack on Titan © Hajime Isayama/Kodansha Ltd.; animated material © the respective production committee and rightsholders. Frames selected and arranged by the author for scholarly analysis. A collage of four images from the animated series Attack on Titan featuring characters Erwin Smith and Eren Yeager. The collage consists of four images from the animated series Attack on Titan, arranged in two columns contrasting Erwin Smith and Eren Yeager as two modes of observation. The top left image shows Erwin Smith with a focused gaze, representing distributed coordination and acting without total knowledge. The bottom left image shows Erwin in action on horseback, representing action under uncertainty. The top right image is a close-up of Eren Yeager’s eye, representing a failed approximation of total observation and a vision saturated by memory and future events. The bottom right image shows Eren with a wide, fixed gaze, representing inevitability and the contraction of perceived choices. The juxtaposition contrasts distributed coordination under uncertainty with the attempt to achieve total observation, in which increased access to information corresponds to reduced perceived possibilities for action. More about this image found in Two modes of observation in Attack on Titan. The figure contrasts Erwin Smi...
Journal Articles

