This study aims to systematically map the evolution of research on employability within higher education by identifying publication trends, influential contributors, thematic developments and emerging research directions. It also examines how higher education institutions (HEIs) contribute to graduate employability through skill development and their alignment with labour market requirements.
A bibliometric analysis was conducted using peer-reviewed publications retrieved from Web of Science Core Collection covering the period 2013–2023. Following a multi-stage screening process, 186 articles were included in the final dataset. Data were analysed using Microsoft Excel and Biblioshiny (R package) to examine publication trends, citation patterns, collaboration networks, keyword co-occurrence, thematic evolution and influential sources within the employability research landscape.
The findings reveal substantial growth in employability research over the past decade, reflecting increased global attention to aligning higher education with labour market needs. The analysis identifies key research themes, including employability skills, graduate attributes, work-integrated learning, curriculum development and career readiness. Emerging themes such as entrepreneurship, emotional intelligence, self-efficacy and career adaptability indicate a shift towards holistic graduate development. The study also highlights leading authors, journals, institutions and countries contributing to this field, while emphasising the need for curriculum reforms to strengthen graduate employability.
This study provides a comprehensive bibliometric overview of employability research in higher education and identifies emerging themes and knowledge gaps that have received limited attention. By synthesising a decade of scholarly evidence, it offers valuable insights for researchers, educators, HEIs and policymakers seeking to strengthen curriculum design, graduate employability and evidence-based higher education reforms.
Introduction
Employability Skills are the transferable abilities a person needs to become employable. According to Dacre Pool and Sewell's (2007) more current definition, employability is the possession of a set of abilities, knowledge, comprehension and character traits that increase an individual's likelihood of selecting, obtaining and holding onto successful careers. Either globally, employability is now expected, or policy actors prioritize it above everything else. Specifically, to address global skill mismatches or widespread unemployment, policy players are forced to modify their education strategies (Singh & Ehlers, 2020). Given these global policy shifts and rapid growth of research in this field, it is now critical to map, analyse and synthesize existing academic trends in a systematic manner. As a result, this study takes a bibliometric method to investigate how employability-related research has evolved over time and how global policy discourses have influenced it. The structural shift in labour markets brought about by the Industrial Revolution 4.0 and Globalization 4.0 is one of the primary causes of these deficiencies (Schwab, 2017).
Employers, higher education institutions (HEIs) and recruiters have all become more aware of employability. Scholars' interest in employability in the twenty-first century has risen due to “the combination of rapidly increasing speed in technology developments, new business models, expanded globalization, and increased demand for productivity, creativity and flexibility” (De Vos, Jacobs, & Verbruggen, 2021). Despite the fact that preparing graduates for the workforce is one of HEIs' primary objectives (Weerathunga & Mallawarachchi, 2020), widespread unemployment and skill mismatches persist (Singh & Ehlers, 2020).
Founded on July 31, 2008, the National Skill Development Corporation (NSDC) is India's first public-private partnership (PPP) dedicated to improving the skills of the country's expanding labour force through a variety of initiatives including VTPs (Vocational Training Providers). The goal of the NSDC is to make up around 30% of the total skilling target of 500 million Indians by 2022. (Yojana Reference, May 2012). In response to the need for students to develop their skills, the Indian government launched the National Skills Qualifications Framework (NSQF) to make education more relevant and produce a skilled workforce that is “industry fit.” Institutions recognized under the Community Colleges program, the B.Voc degree program and Deen Dayal Upadhyay KAUSHAL Kendras that offer skill-based courses will need to maintain constant communication with the relevant Sector Skill Council(s) and the industry in order to stay informed about the needs of the workforce for the local economy. As a result, the curriculum will include a reasonable balance of general education and skill development components in each semester or year of the program. A total of 40% of the total credits will come from the General Education component, with the remaining 60% coming from the Skill component. Skill development is a continuous process, just as learning is, as we all know. Every product looks for a competitive advantage, and a person's capacity to find work in the future is mostly determined by how good their talents are. Skills are capabilities that are anticipated to yield favorable outcomes for a company.
The recent fast economic expansion of India, fuelled by new technology, has made industry-wide skill development imperative. The NSDC, has made a substantial overall contribution to the accomplishment of the Skill India goal. We think that effective mechanisms for skill development support and vocational training are essential to aggressively sparking our country's economic progress (nsdcindia.org). The first education policy of the twenty-first century, Ministry of Human Resource Development and National Education Policy (NEP) (2020), also attempts to meet the numerous, expanding developmental imperatives facing our nation. Ministry of Human Resource Development and NEP (2020) states that by 2025, at least 50% of students will have gained experience in the workforce through higher education and the classroom.
Literature review
According to Bowden, Hart, King, Trigwell, and Watts (2000), employability is a collection of graduate attributes, or the traits, abilities and knowledge that the higher education community feels its students should acquire while attending the school and that, in turn, determine the contributions they can make in their careers and as citizens. Scholarly works recognize that completing a degree program does not guarantee employment (Paadi, 2014; Yorke, 2006). It also claims that there is no one perfect recipe for integrating employability because of the complexity of employability and the diversity of higher education curriculum (Eden, 2014; Shah, Pell, & Brooke, 2004; Knight & Yorke, 2006). For example, in Europe, national and international qualification frameworks, like the European qualifications framework, incorporate generic skills (communication, critical thinking, problem-solving, teamwork, lifelong learning, professional ethics, entrepreneurship, leadership etc.) to facilitate the transfer of knowledge (European Parliament & Council of the European Union, 2008). Australia developed the graduate skills evaluation, a centralized generic skills evaluation instrument (Hambur, Luc, & Rowe, 2002). Other examples are the work keys system examination administered by the American College Testing Center for Education and Work (McLarty & Saterfiel, 1995) and the Cambridge Thinking Skills examination in the UK (Cambridge Assessment Admissions Testing, 2017). There are several predictions that the labour market will place greater value on generic skills in the future (Casserly, 2013; DavDavies, Fidler, & Gorbis, 2011). Additionally, recent studies from a variety of fields have demonstrated that employers require generic skills (communication, critical thinking, problem-solving, teamwork, lifelong learning, professional ethics, entrepreneurship, leadership, etc.) in addition to job-related requirements like the field-specific (technical/professional) skills (Virtanen, Tynjala, & Collin, 2009). In order to address the development of skills in career development learning, attributes to develop and communicate work and life experiences, degree subject knowledge and understanding, development of generic skills, emotional intelligence and other transferable skills, a multitude of programs use various pedagogical approaches. According to Eden (2014) and Butcher, Smith, Kettle, and Burton (2011), the educational techniques include experiential learning, blended learning, in-person lectures, small-group work, seminars and presentations. To attain sustainable education, HEIs should think about using cutting-edge teaching pedagogies and offering a conducive learning environment that may support the teaching of employable skills (Tomlinson, 2017). According to the literature review, university graduates often lack sufficient training in critical thinking, communication, information technology, decision-making, interpersonal relationships and technical and numeracy skills – all of which have an impact on their employability down the road. From the standpoint of the educational institutions, three reasons have been found for the lack of employability skills among Indian graduates: (1) the graduate programs' lack of relevance; (2) the research's lack of veracity and (3) the educational institutions' lackluster innovative culture (Kumar & Mittal, 2019). In addition to understanding, controlling and applying knowledge about emotions, emotional intelligence is the capacity to identify emotions in other people (Paik, Seo, & Jin, 2019). According to research findings, emotional intelligence can predict important outcomes like enhanced psychological well-being, positive social relationships at work, success in the workplace, improved decision-making, academic achievement and leadership traits (Manichander, 2020). These results will probably have a big effect on a graduate's overall employability. According to Myers and Tucker (2005), there is a growing demand for curricular changes that will include emotional intelligence abilities for students studying business management. Technical skills, also known as subject-specific or content-specific knowledge and competence, are another type of talent that are related to or within a particular area, such as psychology or computer technology. Both official and informal methods can be used to gain technical skills. Medina (2010) clarified that the conventional route is via academic channels, specifically through HEIs. The non-formal approach to acquiring the technical abilities is by means of a textual, electronic and progressive instruction (Medina, 2010). To ensure that abilities are continuously enhanced, continuous engagement in the endeavor is necessary to advance technical knowledge. In reviewing employability research, it is evident that several important adjacent concepts such as work readiness, transferable skills, graduate attributes and career adaptability are now considered essential components of the broader employability discourse. Recent studies emphasize that employability extends beyond technical or soft skills and includes a wider set of transversal competencies that enable graduates to adapt, transition and perform effectively in dynamic labour markets (Caballero et al., 2022; Smith, Ferns, & Russell, 2019). Similarly, transferable skills and graduate attributes have been identified as crucial indicators of long-term employability and professional growth (Jackson & Bridgstock, 2023; Tomlinson, 2022), while career adaptability is increasingly viewed as a core psychological resource that supports graduates' resilience and readiness for uncertain work environments (Clarke, 2022; Organisation for Economic Co-operation and Development OECD, 2023). People who are more confident in their ability to complete the educational requirements for certain occupational responsibilities are more likely to consider and express interest in a wider range of career prospects, self-efficacy may also play a crucial role in graduate employability (Hamzah, Le, & Musa, 2021). According to Pool and Qualter (2013), graduate employability is most influenced by self-efficacy. Self-efficacy is also a mediating component in professional outcomes, according to social cognitive career theory (Lent, Brown, & Hackett, 1994). While prior studies have extensively examined graduate employability from perspectives such as skills development, curriculum design and labour market alignment, the literature also reflects broader theoretical debates regarding how employability should be conceptualized. Scholars have approached employability through frameworks such as human capital theory, which emphasizes the accumulation of knowledge and skills through education, and graduate capital perspectives, which highlight the importance of social, cultural and psychological resources in shaping career outcomes. More recent discussions further emphasize a career ecosystem approach, where employability is understood as the interaction between individual capabilities, institutional structures and labour market dynamics. Despite the growing body of research, existing reviews largely provide narrative summaries of employability skills or institutional practices. Consequently, there remains limited systematic understanding of how these theoretical perspectives have evolved and interacted within the scholarly literature. By employing a bibliometric approach, the present study advances the field by mapping the intellectual structure, thematic clusters and evolving research trends within graduate employability studies. In doing so, the study not only synthesizes existing knowledge but also identifies emerging theoretical directions and underexplored areas that can inform future research on employability in higher education.
By analysing how various conceptualisations of employability are reflected in the changing research landscape, the current study adds to the literature by building on these theoretical perspectives. While traditional approaches have primarily framed employability through the lens of human capital theory, emphasising the accumulation of technical and transferable skills., more recent studies have broadened the concept to include psychological, social and contextual aspects of graduate readiness, According to perspectives like the graduate capital framework and career ecosystem approach, employability is shaped not only by skills acquisition, but also by institutional environments, social networks and individual adaptability within changing labour markets. There is still little systematic knowledge of how various viewpoints have evolved and interacted within the scholarly literature, despite the increasing complexity of these theoretical discussions. This study addresses this gap by using bibliometric analysis to trace the developing research fronts, thematic evolution and intellectual structure of employability scholarship in higher education.
Research objectives
The main focus of the study is to examine the global research trends in employability skills within higher education from 2013–2023 using bibliometric analysis of publications that have been indexed in the Web of Science. Specifically, the study aims to achieve the following objectives:
To determine which employability skills are most frequently highlighted in academic literature.
To analyse publication and citation patterns.
To map collaboration networks among countries and institutions and
To investigate thematic clusters like entrepreneurship, emotional intelligence and soft skills.
Research questions
What are the key employability skills emphasized in the scholarly literature on higher education between 2013 and 2023?
How have publication and citation trends evolved concerning employability skills in higher education over the past decade?
What are the predominant themes and clusters emerging in the research on graduate employability, as identified through keyword co-occurrence analysis?
How does the collaboration between countries and institutions contribute to the knowledge production on employability in higher education?
Which journals and authors are most influential in shaping the discourse on skill-based education and graduate employability?
What gaps exist in the literature regarding emotional intelligence, entrepreneurship and self-efficacy as factors influencing employability?
How aligned are HEIs' curricula with the evolving demands of employers for both soft and technical skills?
Research method
Researchers can examine patterns in a particular field of study using bibliometric analysis, a quantitative cross-disciplinary discipline that is based on the findings of published literature databases. The examination of co-citations, keyword occurrence, regional distribution and future orientations of a particular topic of interest are the main foci of this bibliometric analysis article. Additionally, bibliometric analysis makes it possible for researchers to disseminate their findings to other researchers in the same area and set the direction and pace of research by the using quantitative evaluation of output (Munaqib, Mohiuddin, & Darzi, 2023).
The methodological rationale of this study is grounded in the need to systematically map the intellectual structure and research evolution of employability studies in higher education. Bibliometric analysis was selected as it enables the quantitative examination of publication trends, citation patterns and thematic relationships within a large body of literature. To ensure alignment with the research questions, specific analytical techniques were employed: publication and citation trend analysis addresses the evolution of research activity (RQ2); keyword co-occurrence and thematic mapping identify dominant themes and emerging clusters in the literature (RQ3); while collaboration and citation network analyses help reveal influential authors, journals and patterns of knowledge production (RQ4 and RQ5). By linking each analytical step with the corresponding research questions, the study provides a structured and transparent approach for identifying key themes, research gaps and future directions in the field of graduate employability.
Data mining and research strategy
On August 21, 2023, data mining was done with the Web of Science database. According to Paul-Hus and Mongeon (2016), WoS is the biggest database that gathers a variety of scientific records and is the source that is utilized the most for publication and data gathering for bibliometric research. Research publications and journals with the keyword “graduate employability” in both the title and abstract are the main focus of the investigation. The most recent publication was found in 2023, while the oldest was found in 2013.
Search strategy
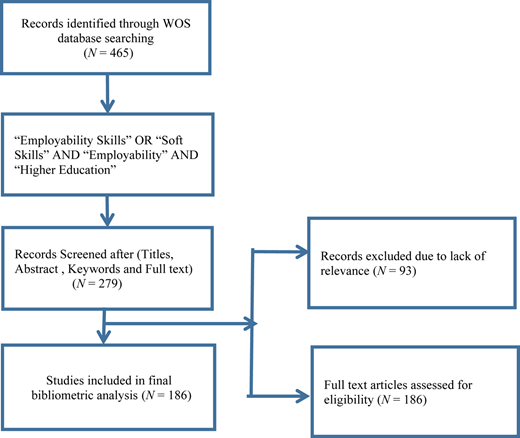
A systematic search strategy was employed to ensure comprehensive coverage of employability related literature within higher education. The Web of Science Core Collection (WoS) was selected as the primary database due to its rigorous indexing standards and its widespread use in bibliometric research. Clearly reporting the sample size and the specific inclusion criteria is critical for evaluating the methodological robustness of bibliometric studies. As shown in Figure 1 the search was conducted on 21 August 2023 using a combination of controlled and free text keywords. The final search string applied to titles, abstracts and author keywords was: “Employability Skills” OR “Soft Skills” AND “Employability” AND “Higher Education”. This query was designed to capture studies at the intersection of employability, skill development and higher education systems. The initial search yielded 465 records, which were then screened for relevance based on titles, abstracts, keywords and full texts. After removing duplicates and applying inclusion criteria peer-reviewed journal articles, English-language publications, WoS-indexed documents and a defined time window of 2013–2023 the dataset was reduced to 279 records. A final screening based on conceptual alignment with employability and higher education resulted in 186 articles being included for bibliometric analysis. This structured search approach ensured consistency and replicability, while the multi-stage screening process strengthened the validity of the final dataset. Therefore the inclusion criteria that are designed to uphold scientific rigor by limiting the selection to peer-reviewed articles, thereby ensuring the reliability and quality of the dataset (Gómez-García et al., 2017; Mushtaq, Nazeer, Fayaz, & Gulzar, 2025).
Bibliometric maps
For simplicity of data processing, the bibliometric mapping is constructed using R Studio software, which has also been used to research a variety of scientific fields (del Río-Rama et al., 2020). According to Van-Eck and Waltman (2010), it is a software tool for creating and displaying bibliometric networks based on co-citation and co-authorship linkages with journals, researchers or individual publications. When it comes to visualization approaches, the intensity of the relationship between two keywords or between any pair of keywords that occur simultaneously (co-occurrence), is represented by a positive numerical number. Using network visualization, it may also be shown as notes of certain factors (color, circle size and connecting line thickness). The number of papers co-authored by two related nations served as a numerical indicator of the degree of international collaboration using keyword co-authorship analysis. Similar to this, the number of terms in co-occurrence analysis that contain two keywords together indicates the relative strength of the relationship between the author's keywords.
Main information
As shown in Table 1 using title and word citation, the Web of Science bibliographic database was examined to determine the increase in publications on employability-related research subjects between 2013 and 2023. Throughout the course of the project, 706 keywords from 50 published Web of Science articles were collected in order to perform co-occurrence analysis. Using the visualized keywords network approaches, a thorough overview of the literature was obtained with an emphasis on the relationships between keywords in each time period. There are 606 author appearances in all. Just four of them have written 3.16 single author papers, demonstrating the diverse character of this field of study. The topic's significance is demonstrated by the average number of citations per document (11.73).
Results and discussion
Publication and citation trends
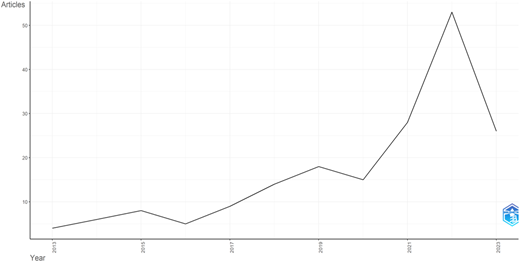
Figure 2 depicts “Annual Scientific Production,” which plots the number of articles published each year over a span of time. The x-axis represents the years, ranging from what appears to begin with 2013 through 2019, and the y-axis represents the number of articles, with increments that can be inferred but are not clearly visible in the image. The graph shows a general upward trend in the number of articles published annually, with a particularly sharp increase in 2019, where the production peaks. The significant rise in 2019 could indicate a particular interest in scientific research or an event that prompted a higher volume of publications. Without additional context or data, the reasons for the trends cannot be accurately determined. The symbol in the lower right corner suggests that the graph may have been generated using a software or platform specific to scientific or academic publishing.
Average citation per year
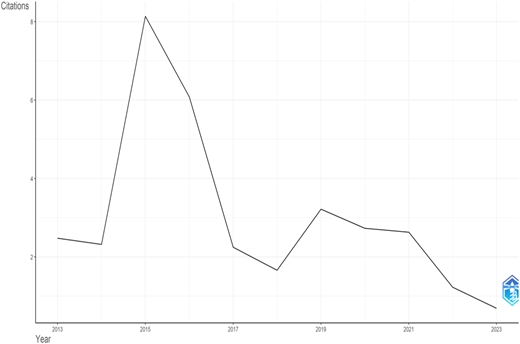
Figure 3 shows a line graph with the title “Average Citations per Year.” It presents data over a period from 2013 to around 2023 on the x-axis, which represents years, and the y-axis indicates the number of citations. The graph displays fluctuations in the average number of citations per year. There is a sharp peak around the year 2015, suggesting that articles from that year were cited much more frequently on average than in other years. This peak is followed by a decline and then a series of ups and downs, with a general downward trend towards 2023. This could reflect the impact or relevance of research over time, with the peak year possibly marking publications that were highly influential or coinciding with a significant scientific discovery or event that was widely referenced. The decline in citations over time could indicate a shift in research focus or the natural progression of scientific research where older articles gradually receive fewer citations as the field evolves.
Three field plot
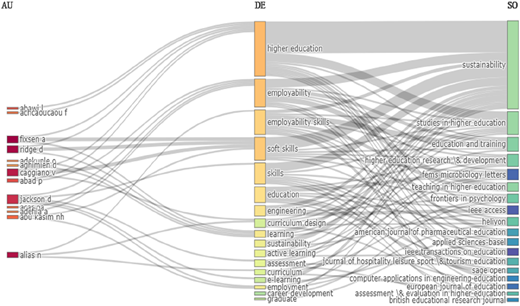
Figure 4 shows three field plot representing the following information:
AU (Author): On the left, there are labels which seem to correspond to different authors, as indicated by “AU”. Each author is connected to various subjects in the middle column.
DE (Descriptors): The middle column represents different descriptors or subjects associated with the authors' work. This could include areas of research focus or keywords from their publications.
SO (Sources): On the right, we have what appears to be sources or journals where the authors' work is published or associated with, as indicated by “SO”. The flow lines connect authors to their research interests and further link these interests to specific journals or sources. The width of the lines might represent the quantity or strength of the associations. An author with a wide line connecting to “higher education” suggests a strong association with that topic, which in turn has connections to several academic journals focused on sustainability and education. This kind of visualization helps in understanding the relationships between authors, their areas of study and the outlets where their work is featured or discussed.
Therefore it can be concluded, about 15 authors have been parallel in production which is the same for journals. These summarize the limitation for prolific authors as well as dedicated journals in the field of higher education, employability and outcome-based learnings. About the keywords, the top key words can be summarized in three major groups. Besides the employability and employment keywords, researchers have found a strong connection on higher education with entrepreneurship. None of the top authors in this list have produced any document so far connecting this keyword. However, for future research this specific field may guide to greater findings. The major keywords which are related to outcome-based learning are skill, work-integrated learnings, graduate attributes and curriculum. Finally, among the general topic, the three-field plot suggests that journals gave been producing documents on strategy and engineering education connecting the topic of this study.
Most relevant sources
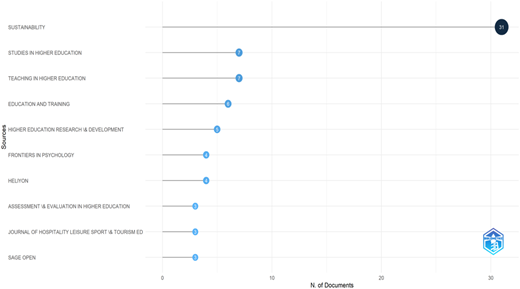
Figure 5 displays a horizontal bar graph titled “Most Relevant Sources.” The x-axis is labeled “N. of Documents,” which likely stands for the number of documents or articles, and the y-axis lists different sources, which seem to be academic journals or topics. Each bar represents the number of documents associated with each source, plotted as individual points on the graph. The point farthest to the right corresponds to the source “Sustainability,” indicating it has the highest number of documents (around 31) associated with it among the sources listed. The graph visually conveys which sources are most relevant based on the number of documents, suggesting that “Sustainability” is a significant topic or journal in this particular dataset. Other sources like “Studies in Higher Education,” “Teaching in Higher Education” and “Education and Training” also show notable numbers of documents but fewer than “Sustainability”. This kind of graph is useful for quickly identifying which areas of research or publication venues are most prevalent in a dataset.
Production over time
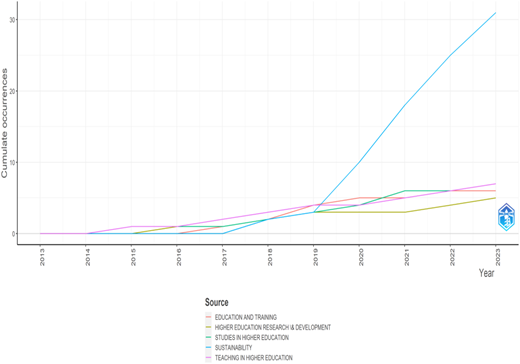
Figure 6 displays a multi-line graph titled “Sources” Production over Time,” which shows the cumulative occurrences (probably of articles or publications) for different sources from 2013 to around 2023. Each line represents a source, differentiated by color, and corresponds to the cumulative count of publications over the years: The blue line, representing “EDUCATION AND TRAINING,” shows a steady increase throughout the period and then a more pronounced rise from around 2020 onwards. The purple line, likely denoting “HIGHER EDUCATION RESEARCH & DEVELOPMENT,” also demonstrates a steady growth, but less steep compared to “EDUCATION AND TRAINING”. The yellow line for “STUDIES IN HIGHER EDUCATION” shows gradual growth. The green line for “SUSTAINABILITY” has a modest incline. Lastly, the pink line for “TEACHING IN HIGHER EDUCATION” reflects a steady, gradual increase. The graph indicates that “EDUCATION AND TRAINING” has seen the most significant growth in production over time, suggesting it may have become increasingly prominent or that more research and publications are being produced in this field. The overall upward trends suggest that academic output in these areas has been consistently growing.
Most relevant authors
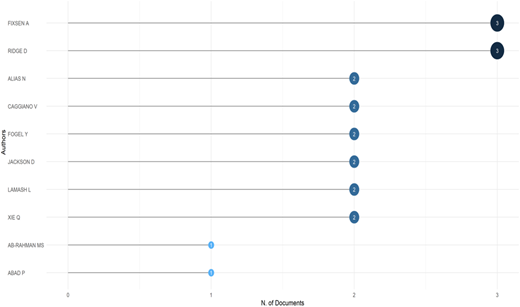
Figure 7 represents a horizontal bar graph titled “Most Relevant Authors.” The y-axis lists the last names and initials of various authors, while the x-axis indicates the “N. of Documents,” which likely stands for the number of documents or publications attributed to each author. The graph uses points to represent the number of documents for each author: The author with the last name “Fiksen A” and another with the last name “Ridge D” have the highest number of documents at three each. Several authors are shown to have two documents each. A few authors have a single document attributed to them. This visualization is used to display the productivity or relevance of authors within a particular field or data set, based on the number of documents they have published. Authors with more documents are typically considered more prolific or influential in that context.
Most local cited authors
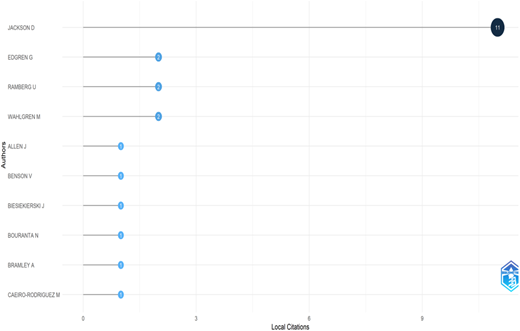
Figure 8 shows a horizontal bar graph titled “Most Local Cited Authors.” The y-axis lists various authors by their last names and initials, while the x-axis indicates the number of “Local Citations” each author has received. The graph provides the following information:
One author, labeled “Jackson D,” stands out with the highest number of local citations, marked by a point at eleven. Other authors are shown with varying numbers of local citations, less than the highest point but distributed across the scale from one to several citations. This visual representation provides a clear indication of which authors are most frequently cited within a given local or specific academic context, suggesting their prominence or influence in that sphere. Authors with more local citations are often considered to be more impact ful or significant in their contributions to the field.
Corresponding Author's countries
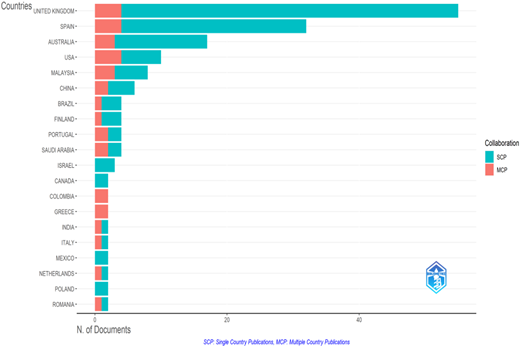
Figure 9 shows a horizontal stacked bar graph titled “Corresponding Author's Countries,” which represents the number of documents published by authors from various countries. Each bar is divided into two segments: SCP (Single Country Publications): Represented in red, this indicates the number of documents authored by researchers from a single country. MCP (Multiple Country Publications): Represented in cyan, this shows the number of documents that result from international collaborations involving authors from multiple countries. The United Kingdom has the highest number of documents, with a significant portion being MCP, suggesting a high level of international collaboration. Spain follows, with a balance of SCP and MCP, indicating a mix of national and international work. Other countries listed, such as Australia, the USA and Malaysia, also contribute a mix of SCP and MCP, with varying counts.
Countries production over time
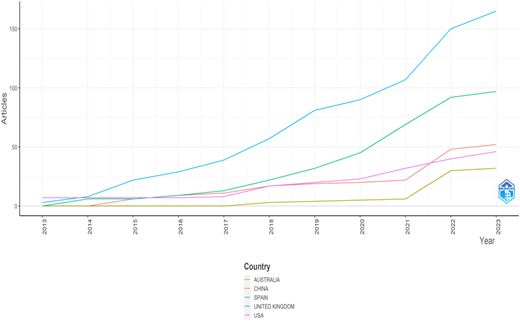
Figure 10 represents a multi-line graph titled “Country Production over Time,” which plots the number of articles produced by different countries from 2013 to around 2023. The lines represent the following countries, as indicated by the color-coded legend: Australia (red), China (green), Spain (purple), United Kingdom (yellow), USA (blue). The y-axis measures the number of articles, and the x-axis represents time in years. The graph shows the following observations:
The USA (blue line) exhibits the highest growth in the number of articles over time, with a particularly steep increase starting around 2017. China (green line) also shows a significant increase, surpassing the United Kingdom around 2018. The United Kingdom (yellow line) and Spain (purple line) show moderate growth. Australia (red line) has the least growth compared to the other countries depicted. This chart provides a comparative view of the research output of these countries over the given period, showing trends and growth in academic production.
Most global cited documents
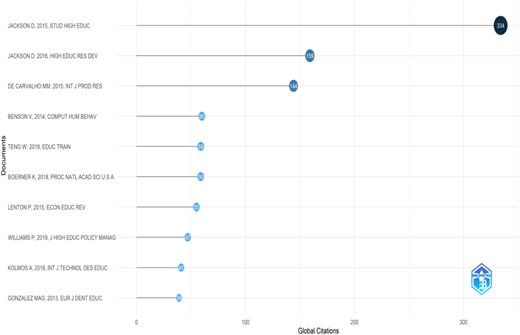
Figure 11 shows a horizontal bar graph titled “Most Global Cited Documents.” The y-axis lists various documents, presumably by their titles or perhaps by the first author's last name followed by the publication year and the source title abbreviated. The x-axis indicates the number of “Global Citations” each document has received. The graph is laid out as follows:
The document “Jackson, 2016, STUD HIGH EDUC” has the highest number of global citations, far exceeding the others with over 300 citations. Other documents are shown with varying numbers of global citations, distributed across the scale. This graph is useful for identifying which academic papers or documents have had the most impact globally, as measured by the number of times they have been cited in other works. Documents with a high number of global citations are often considered influential in their respective fields.
Most cited countries
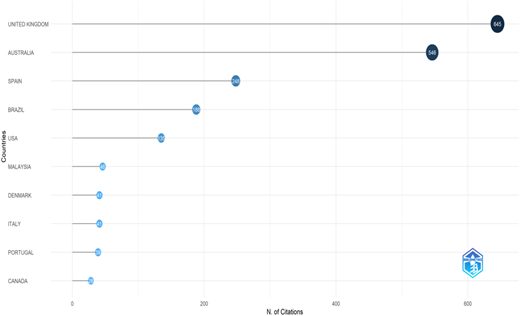
Figure 12 depicts a horizontal bar graph titled “Most Cited Countries.” The y-axis lists different countries, and the x-axis quantifies the “N. of Citations,” presumably indicating the number of citations from research papers or articles originating from those countries. The graph points out that:
The United Kingdom is the most cited country, with a significant lead of around 650 citations.
The USA is the second most cited, with slightly fewer citations than the United Kingdom.
Australia and Spain follow with a substantial number of citations, each around the mid-300s.
Other countries such as Brazil, Malaysia, Denmark, Italy, Portugal and Canada are also represented with varying lower numbers of citations. This visualization serves to showcase the relative impact or contribution of each country to the academic or research landscape, as reflected by how often their work is cited globally.
Most local cited references
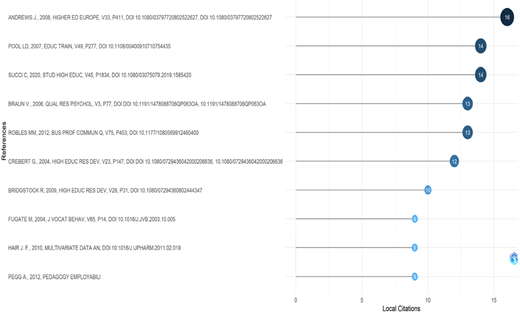
Figure 13 shows a horizontal bar graph titled “Most Local Cited References.” The y-axis lists various academic references, most likely by the first author's last name followed by the publication year and the abbreviated journal name, along with volume and page numbers or DOI (Digital Object Identifier) numbers. The x-axis indicates the number of “Local Citations” each reference has received within a specific data-set or research community. The graph uses points to indicate the number of citations: The reference “Andrews, 2008, HIGHER ED EUROPE” has the highest number of local citations, marked at 16. Several references have 11 to 14 local citations each.
The rest of the references shown have fewer local citations, down to the lowest marked number, which is 6. This visualization is used to display the local impact or relevance of specific academic papers within a particular field or data set, based on the number of times they have been cited by other works in the same local context.
Most relevant words
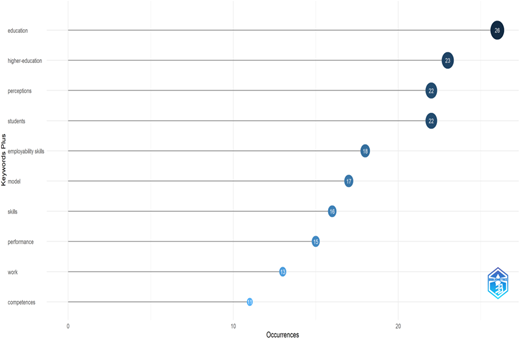
Figure 14 represents a horizontal bar graph titled “Most Relevant Words,” which displays a list of words on the y-axis and their respective occurrences on the x-axis. The graph points out the following information: The word “education” has the highest number of occurrences, around 28. “Higher-education,” “perceptions” and “students” each have over 20 occurrences. “Employability skills,” “model,” “skills,” “performance,” “work” and “competences” have fewer occurrences, ranging from approximately 4 to 17. This type of visualization is typically used to identify key themes or focus areas within a dataset, such as a collection of academic papers, articles or survey responses. The words with the most occurrences are generally considered the most significant or relevant within the context of the data analyzed.
Word cloud
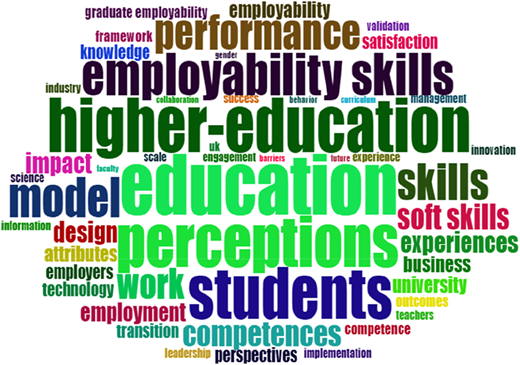
Figure 15 is a word cloud, a visual representation of text data where the size of each word indicates its frequency or importance in the source data. In this word cloud, the most prominent terms appear to be related to education and skills. Here are some observations: “Higher education” and “education” are central and very large, suggesting these are key themes. “Employability,” “skills,” “students” and “performance” are also quite prominent, indicating these are significant concepts associated with the central theme. “Soft skills,” “work,” “competences,” “perceptions” and “model” are of medium prominence. Other terms like “graduate employability,” “knowledge,” “attributes,” “employers” and “technology” are smaller but still noticeable, showing that they are part of the discourse but perhaps less frequently mentioned than the central terms. Overall, the word cloud suggests that the source data involves discussions or literature related to education, particularly focusing on employability, skills development and student performance.
Tree map
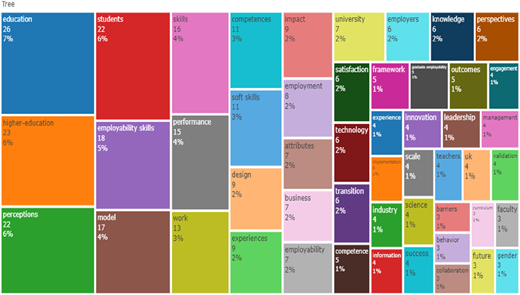
Figure 16 shows a tree map, which is a type of diagram used to represent hierarchical data with nested rectangles. Each rectangle's size and color correspond to different attributes such as frequency or a quantitative variable. In this treemap, the rectangles represent various terms with their corresponding counts and percentages, likely related to an academic or educational context.
Here are some key points from the treemap:“Education” (7%), “higher-education” (6%) and “perceptions” (6%) are among the largest rectangles, indicating these are the most frequently occurring or most significant terms in the dataset. ”Students” (6%), “employability skills” (5%), “model” (4%) and “work” (3%) are also relatively large, suggesting they are important but less dominant than the largest terms. Other terms like “skills,” “competences,” “performance” and “soft skills” appear with smaller percentages, ranging from 2% to 4%. There are numerous other terms with smaller sizes and lower percentages, such as “impact,” “university,” “employers,” “knowledge,” “perspectives” and more, each contributing to the overall dataset but with less frequency. The treemap provides a visual summary of the relative importance or frequency of each term within the data, offering insights into the main topics or themes that are being analyzed or discussed.
Words frequency over time
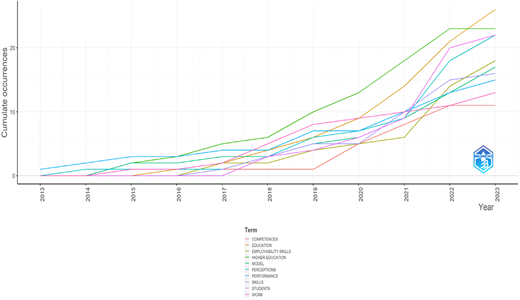
Figure 17 shows a multi-line graph titled “Words' Frequency over Time,” which tracks the cumulative occurrences of various terms from 2013 to around 2023. The terms, differentiated by color, are listed in the legend and include: Competences, Education, Employability Skills, Higher Education, Model, Performance, Perceptions, Skills, Students Work. Each line represents the trend of a specific term over time: All terms show an increasing trend in cumulative occurrences over the years. Some terms, such as “Education” and “Higher Education,” exhibit a notably steep increase in recent years, suggesting growing discourse or research activity around these topics. Other terms like “Skills,” “Work” and “Students” also show growth, but at different rates and trajectories. The y-axis measures cumulative occurrences, and the x-axis represents time in years. The graph provides insights into the prominence and evolution of these topics within an academic, research or publication context over the specified time frame.
Trend Topics
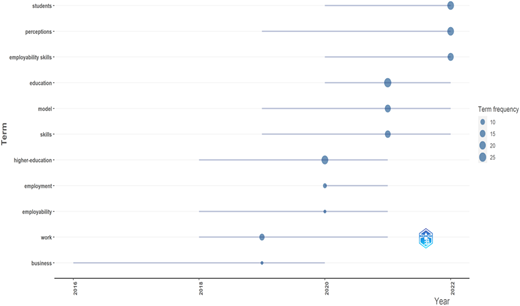
Figure 18 displays a bubble timeline chart titled “Trend Topics,” which visualizes the frequency of various terms over a span of years, specifically highlighting certain years like 2016, 2018 and 2021. Key points from the chart: Each horizontal line corresponds to a different term, such as “students,” “perceptions,” “employability skills” and so on. Along each line, the bubbles represent the frequency of the term in a given year, with the size of the bubble corresponding to term frequency – larger bubbles denote higher frequency. The terms “students,” “education” and “higher-education” show the largest bubbles, indicating these terms had the highest frequency in the years they are aligned with. “Employability skills” and “employability” also show significant frequencies but are slightly less than the terms mentioned above. “Model,” “skills,” “employment,” “work” and “business” are represented with smaller bubbles, suggesting lower frequency in comparison. The chart is useful for tracking the popularity or focus on specific topics over time within an academic, professional or research context. It helps identify trends and shifts in interest or relevance of certain topics.
Co-occurrence network
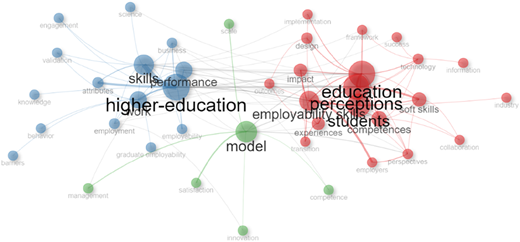
Figure 19 shows co-occurrence network graphically and visualize an underlying relationship between words, authors or documents creating clusters using any specific unit of documents. This study examines the 867 author's keywords with a condition of minimum number of occurrences in a paper for five times resulting in total 15 keywords that achieves the threshold. Figure 5 presents the co-occurrence network of authors' keywords along with 4 clusters, 37 links and 74 link strengths. Cluster 1 consists of the keywords like “employability,” “work-integrated learnings” “learning outcomes,” “generic skills” and “engineering education.” The highest occurrence was between employability and learning outcomes with 8 link strength. From cluster 1, the word employability alone has 11 links, 34 link strength and 41 occurrences. Cluster 2 consists of the words like “assessment,” “curriculum” “education” and “learning.” Cluster 4 consists of the words like “higher education,” “graduate attributes” and “employability skill.” Figure 5 reveals that cluster 2 is highly linked with cluster 4. Again, cluster 4 is mostly linked with cluster 1. It is evident that literature strongly presents the co-occurrences of employability with higher education and higher education with curriculum. Cluster 3 consists of keywords like “strategy, employment” and “entrepreneurship” the outcome of above three clusters. This image features a network graph that visualizes the relationships between various terms. Each node (circle) represents a term, and the size of the node suggests the term's prominence or frequency. The lines between nodes indicate associations or relationships between terms.
The key observations include: “Higher-education” and “education” are central large nodes, indicating they are major themes with numerous connections to other terms. “Students,” “employability” and “perceptions” are also large and centrally located, suggesting they are key topics and heavily interlinked with other concepts. “Model,” “skills,” “performance” and “competences” are medium-sized nodes, representing significant but less dominant themes. Smaller nodes like “innovation,” “management,” “business” and “satisfaction” are still connected within the network, showing they are part of the discourse but perhaps less frequently mentioned. The colors of the nodes and the thickness of the connecting lines could represent different types of relationships or the strength of the connections. Overall, this network graph is a visual representation of the relationships between concepts within a dataset, helping to illustrate how topics are interconnected within the discourse.
Thematic map
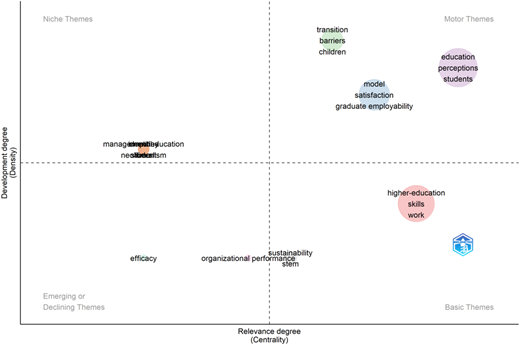
Figure 20 illustrates a strategic diagram or a thematic map, which categorizes themes based on two dimensions: centrality (relevance degree) and density (developmental degree).
Centrality (horizontal axis): Reflects how interrelated a theme is within the overall network. Themes towards the right are considered central (basic themes), indicating they are well-developed and pivotal within the field. Density (vertical axis): Indicates the internal strength and development of a theme. Themes towards the top are more mature and well-developed (motor themes), whereas those towards the bottom are either emerging or declining. The diagram is divided into four quadrants: Upper Right (Motor Themes): These are well-developed and central themes that could be considered the driving force of the field. Here we see terms like “education,” “perceptions,” “students,” “model,” “satisfaction” and “graduate employability.” Lower Right (Basic Themes): These themes are central but less developed than those in the Motor Themes quadrant. “Higher-education,” “skills” and “work” are categorized here, implying that while they are important, they may need further development. Upper Left (Niche Themes): These are well-developed but less central themes. They may represent specialized areas that are important to the field but not as interconnected with other themes. This quadrant is not visible in the image, so no themes are listed.
Lower Left (Emerging or Declining Themes): Themes in this quadrant are neither well-developed nor central. “Efficacy,” “organizational performance,” “sustainability” and “stem” appear here, which might be emerging areas that are gaining traction or older ones that are becoming less central.
This strategic diagram is a useful tool for analyzing the structure of a scientific field or a body of literature, identifying which topics are gaining or losing momentum and determining the focus of future research or strategy.
Co-citation network
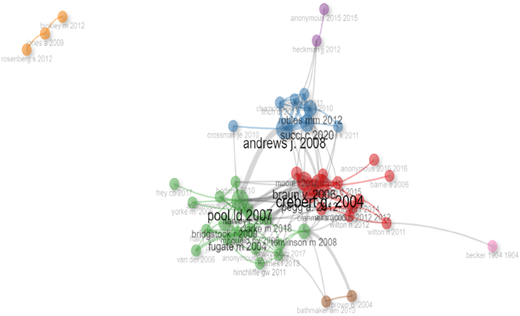
Co-citation network describes the relationship among the documents based on citations among themselves. If two documents have been cited simultaneously by a third document, this intellectual link is called co-citation. Figure 21 presents co-citation network in this topic based on authors connectivity, where each node (circle) represents a scholarly article or author, and the lines between nodes indicate citations or references between these works. The size of the nodes often correlates with the number of citations a work has received; larger nodes have been cited more frequently. In this network the nodes are color-coded, possibly to represent different clusters of related works or different time periods. The nodes of the same color that are grouped together may indicate they are from the same field or share a common research theme. “Andrews, 2008” is a prominent node with multiple connections, suggesting it's a significant work in this network. The layout shows how newer works (e.g. “anonymous 2015″) are connected back to older, foundational works (e.g. “Becker 1964”), indicating the flow of knowledge and influence over time. This type of visualization helps researchers and scholars to identify influential works, understand the interconnections between different research articles and observe the evolution of knowledge within a particular academic field.
Collaboration network
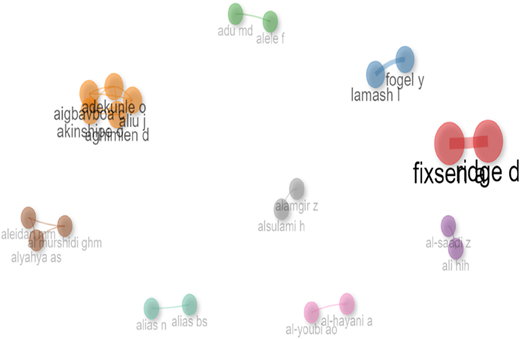
Figure 22 represents a collaboration network visualization, which shows connections (collaborations) between individuals, likely researchers or authors. Each node represents an individual, and the lines between nodes indicate a collaborative relationship, such as co-authorship on academic papers. Here are some observations about the network: The nodes are color-coded and clustered, which might represent different research groups or institutions. The node labeled “fixsen d” is significantly larger and more centrally located with many connections, suggesting this individual is a central figure in this network, possibly collaborating with many others. There are other smaller clusters and individual nodes that are less connected, indicating smaller or more isolated collaborative efforts. This visualization is useful for understanding the collaborative structure within a research community, identifying key figures and analyzing the dynamics of research partnerships.
In addition to revealing quantitative patterns, the bibliometric analysis also discloses evolving thematic and intellectual shifts in employability research within higher education. The steady rise in publications between 2013 and 2023 is an indication of an increasing institutional and policy focus on keeping education at par with skills that employers are looking for. The Indian National Education Policy (Ministry of Human Resource Development & NEP, 2020) and the global discussions on Industry 4.0 overlap with the sharp rise in publications around 2019, thus emphasizing the incorporation of soft and vocational skills into higher education frameworks.
The thematic mapping discloses a shift in the way employability is conceptualised thus going beyond descriptive patterns. While earlier studies mainly focused on generic and transferable skills such as teamwork, communication and problem-solving, the current clusters increasingly emphasize entrepreneurial mindset, emotional intelligence and digital competence as new dimensions of graduate readiness thus implying that employability research is moving from a static “skills possession” model toward a dynamic “career adaptability and resilience” paradigm which is consistent with global shifts toward lifelong learning and knowledge economies.
By analysing collaboration networks it is also revealed that there is a diversification of research leadership, with China, India, the United States and the United Kingdom emerging as significant contributors. The growth in multi-country publications showcases a leaning towards comparative educational frameworks and cross-national policy learning. This evolution highlights the globalisation of employability as a field of research, where knowledge exchange is shaped by shared challenges like unemployment, technological disruption and curricular modernisation.
Collectively, these results highlight the inevitability for HEIs to reconsider employability as a multi-layered concept that is a combination of digital, emotional and cognitive literacy. Thus, the bibliometric data is in support for the demand of competency-based curricula and sustainable employability methods by offering both a descriptive map of the literature and interpretive insights into the future paths of skill-based education.
The results were examined in relation to the guiding research questions of the study. The bibliometric patterns identified in this analysis such as the growth in publications, dominant research themes and influential authors and journals indicate a steadily expanding scholarly interest in the relationship between higher education and employability. These findings address the first research question by mapping the intellectual and publication trends in the field. Furthermore, the keyword co-occurrence and thematic clusters reveal that employability skills, higher education outcomes and industry–academia linkages represent the central research streams, thereby responding to the second research question related to the thematic structure of the literature. By linking these patterns to the broader discourse on skill development and graduate employability, the study highlights how the existing literature has evolved and where important research gaps remain. Overall, the integration of these findings provides a coherent basis for the conclusions of the study and supports the argument that future research should focus more strongly on practical skill development, interdisciplinary approaches and policy-driven employability frameworks.
In other words bibliometric studies are commonly used to map research landscapes, the present study contributes to the literature in several meaningful ways. First, it integrates global research trends on graduate employability with policy-relevant perspectives, particularly in the context of educational reforms such as (Ministry of Human Resource Development & NEP, 2020), which emphasizes skill development and vocational integration within higher education systems.
Second, the analysis highlights emerging thematic areas within the employability discourse, including emotional intelligence, entrepreneurship and self-efficacy, which are increasingly recognized as important psychological and behavioral determinants of graduate employability.
Finally, through bibliometric mapping and network analysis, the study provides a consolidated overview of influential authors, journals and collaboration patterns in the field, thereby offering a clearer understanding of the intellectual structure and evolving research directions within employability studies.
Conclusion
Employability skills in higher education are critical competencies that students need to acquire to successfully transition into the workforce (Jackson & Bridgstock, 2023; Clarke, 2022). These skills often include a combination of soft skills like communication, teamwork and problem-solving, as well as hard skills specific to the job or industry (Organisation for Economic Co-operation and Development OECD, 2023; Knight & Yorke, 2006). HEIs increasingly integrate these skills into their curricula through practical learning experiences, internships and industry partnerships to ensure graduates are well-equipped to meet the demands of employers and to thrive in their chosen careers (Singh & Sharma, 2024; British Council, 2023). As the job market evolves, so does the emphasis on lifelong learning and adaptability, making the continuous development of employability skills an essential component of higher education (Organisation for Economic Co-operation and Development OECD, 2023). This study delivers a thorough bibliometric analysis of employability research conducted in higher education from starting 2013 to 2023, thus disclosing both the quantitative growth as well as the thematic evolution of this field. The increasing number of publications and international collaborations highlight the growing global priority placed on keeping education at par with labour market demands. More importantly, the thematic and co-occurrence analyses specify a change from the traditional importance on generic soft skills such as communication, teamwork and problem-solving and toward the emerging areas of entrepreneurial thinking, emotional intelligence and digital literacy. The needs of Industry 4.0 and knowledge-driven economies are echoed in these changes, which denote a conceptual shift of employability from a static set of traits to a dynamic model of career adaptability and lifelong learning. The study also emphasizes how collaboration networks across nations and institutions are increasingly influencing the discourse of employability, thus showcasing a trend towards common worldwide approaches to skill-based education. HEIs need to integrate multi-dimensional employability competencies through curriculum revision, experiential learning and improved university-industry partnerships, as evident by the findings of the study. For policymakers, especially in the context of India's (Ministry of Human Resource Development & NEP, 2020), the results highlight the necessity of integrating skill development at all academic levels in order to ensure the future workforce is ready. The study not only maps the intellectual landscape of employability research but also gives interpretive insights that might direct both educational reform as well as policy innovation.
Therefore, it can be concluded that there is a strong emphasis on integrating employability skills into the higher education curriculum, and these skills are recognized as crucial for students' success in the job market (Tomlinson & Holmes, 2022). The data also suggest that perceptions around these skills – how they are understood by students, educators and employers are significant and likely influence educational strategies and outcomes (Clarke, 2022; British Council, 2023). Additionally, the presence of terms such as “soft skills,” “performance” and “competences” points to the various dimensions of employability that education institutions aim to address (Knight & Yorke, 2006).
Implications
The study's findings have important implications for educational practice, curriculum designers philosophy as well as policymakers. The study theoretically reinterprets employability as a dynamic, multifaceted concept that comprises of digital, emotional and cognitive literacy. This extended understanding of employability goes beyond human capital models toward an integrated perspective that puts great emphasis lifelong learning and adaptability. This study emphasizes that HEIs should go beyond traditional knowledge-based curricula and move towards imbibing structured experiential learning opportunities like internships, industry projects and problem-based learning, as suggested by the prominence of themes related to employability skills, curriculum design and work-integrated learning. The alignment between educational outputs and labour market expectations may be enhanced by including employability competences within academic programs rather than treating them as additional training. Using problem-based learning, industry engagement and experiential learning, HEIs should make employability oriented competencies like digital literacy, emotional intelligence and entrepreneurial skills a part of their curriculum design (Tomlinson, 2017; Eden, 2014). The growth of themes like career adaptability, emotional intelligence and entrepreneurial competencies shows that employability is increasingly becoming recognised as a multifaceted concept that goes beyond technical or disciplinary expertise. In order to promote creativity, resilience and self-efficacy in addition to technical knowledge, universities may need to adopt multidisciplinary teaching approaches.
Growing worldwide research networks as highlighted by the collaboration analysis indicate potential for cross-national learning in employability-focused educational approaches. Comparative methods that look at how various higher education systems incorporate industry engagement and skill development might be useful to institutions and policymakers.
The results highlight the significance of enhancing university-industry partnerships, creating competency-based curricula and setting up systems for continuous feedback between employers and educational institutions for policymakers, especially in settings like India where initiatives like the National Education Policy (Ministry of Human Resource Development & NEP, 2020) emphasize skill-based education.
The bibliometric mapping also highlights several unexplored research topics, such as the role of psychological resources like emotional intelligence and self-efficacy, the influence of digital competencies on employability and the efficiency of institutional strategies designed to improve graduate outcomes. To gain a deeper understanding of how employability programs are implemented and experienced in higher education systems, future research could integrate bibliometric methodologies with qualitative or mixed-methods studies.
Unlike prior narrative reviews that primarily summarize employability skills and institutional practices, this study provides a systematic bibliometric mapping of the intellectual structure and theoretical evolution of employability research, thereby identifying emerging themes, influential scholars and future research directions.
Limitations and future directions
This study provides valuable insights into the evolution of employability related research, several limitations must be acknowledged. Firstly, the analysis is restricted to documents indexed in the Web of Science (WoS), potentially omitting relevant research from other significant databases like Scopus or Google Scholar, leading to a narrowed scope of analysis (Paul-Hus & Mongeon, 2016). Future research can expand by including a multi-database approach (e.g. Scopus, ERIC) for a more comprehensive bibliometric landscape. Secondly, the bibliometric approach focuses on quantitative metrics (e.g. citation counts, keyword frequencies) and does not assess the qualitative depth of the studies reviewed. Qualitative content analysis of high-impact papers would also enrich understanding of contextual factors shaping employability. Although keyword co-occurrence and network visualizations are insightful, they may oversimplify complex thematic relationships. Further exploration into emerging dimensions like entrepreneurial mindset, digital literacy and emotional intelligence should be prioritized, especially considering the rise of Industry 5.0 (De Vos et al., 2021). Lastly, while the time frame (2013–2023) captures a decade of scholarly work, emerging trends post-2023 may not be reflected, possibly omitting current policy shifts like newer NEP implementations. Therefore, longitudinal case studies across global higher education systems may provide comparative perspectives on curriculum effectiveness Additionally, integrating self-efficacy and psychological readiness models into employability research, as suggested by Hamzah et al. (2021), can offer deeper insights into the psychological attributes that mediate educational and employment outcomes. The present study focuses specifically on employability within the context of higher education, it is acknowledged that closely related constructs such as work readiness, transferable skills and graduate competencies also form part of the broader discourse on labour market preparedness. Although these adjacent concepts are not examined in depth within the scope of the current analysis, their relevance to the employability debate is recognized. The study maintains a clearly defined focus on employability to ensure conceptual clarity and analytical consistency. Therefore, while the exclusion of these related constructs represents a minor scope limitation, it does not significantly affect the overall contribution of the study, which aims to map and analyse the existing scholarly landscape on employability in higher education.
Contribution
All the authors have equally contributed in the paper.