The research aims to analyze the consequences of disruption caused to shipping networks by geopolitical tensions by examining shipping network vulnerability and resilience using the case of the Red Sea crisis.
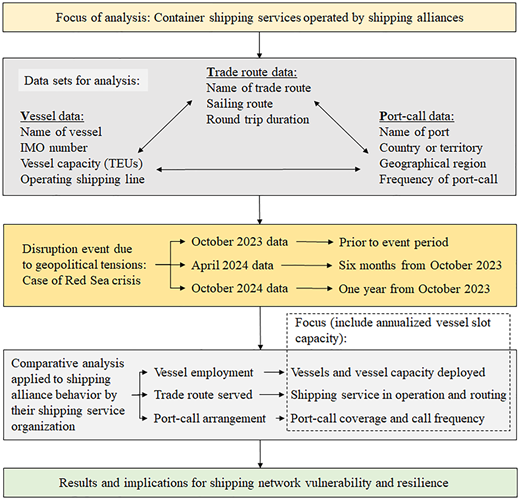
Our research proposes the Vessel-Trade route-Port-call (VTP) framework for analyzing from the supply-side perspective. The approach utilizes information from three crucial components of shipping services, which are vessels employed, trade route served and ports-of-call involved. The study examines shipping alliance behavior using shipping services as the unit of analysis.
Traditional major shipping lanes that go through the Suez Canal and Red Sea are vulnerable to disruption. While shipping connections are kept between geographical regions, many services switched to the Cape of Good Hope route. Most changes were made by April since the disruptions began in November 2023. Resilience in the shipping network is demonstrated by all three alliances deploying additional containerships and reducing port-calls to maintain their service frequency, with comparatively fewer changes to annualized vessel slot capacity offered. The most vulnerable port regions are those located in the Red Sea and Eastern Mediterranean.
Resilience strategies by shipping alliances from the perspective of shipping service, vessel employment, trade route and port-call offer practical implications for shipping lines, port managers, policy makers and researchers.
This research proposes an original framework to analyze shipping network resilience and vulnerability due to disruption caused by geopolitical tensions. Analysis using empirical data from the vessel, trade route and port-call perspectives offers new insights into shipping network vulnerability and resilience through the behavior of shipping alliances.
1. Introduction
Shipping networks are crucial to the world economy. They are key components of global supply chains and enable international trade to take place (Xu et al., 2020). Through shipping networks, countries are provided with maritime access to global markets. The reliability of shipping networks becomes crucial and bears important consequences for national economic growth and development (Ducruet et al., 2018). Within shipping networks, ports which handle the imports and exports of these countries and territories are important facilitators of cargo movements. Li et al. (2023) suggested that efficiency and productivity gains from competitive ports can cascade through these networks. However, the impact created by ports and shipping networks is not uniform. Ducruet and Notteboom (2022) observed that developments in global trade and supply chains have resulted in multilayered and polycentric characteristics of shipping networks. Wang et al. (2018) proposed container shipping lines to hold the key in such networks with their considerable influence on the seaborne segment of supply chains.
Shipping networks can be disrupted by various events such as extreme weather, natural disasters, economic recessions, terrorist attacks and accidents among others (Viljoen and Joubert, 2016; Wu et al., 2019; Yang and Liu, 2022). Such disruptions will vary by duration, magnitude and frequency of the event. The polycentric and multilayered arrangement of shipping networks meant that the effects of disruptions would differ across different ports. Huang et al. (2022) found that replacement with an alternative shipping trade route will have associated impacts, such as congestion that can be unfavorable to hub ports. Viljoen and Joubert (2016) suggested a reduction in transshipment activities while the network remained relatively intact. However, Yang and Liu (2022) opined that a failure in the dominant ports could weaken the resilience and functionality of the shipping network. Wu et al. (2019) simulated disruption to main shipping channels and proposed that sailing time would increase by an average of 4–9 days. An analysis of disruptions caused to shipping networks by events such as the COVID-19 pandemic further suggests implications from the spatial dimension, where ports most affected may be located considerably distant from the source (Dirzka and Acciaro, 2022). Poo and Yang (2024) further proposed adjustments to port-of-rotation and sailing route as the main strategies to maintain shipping network resilience.
The literature tends to emphasize the network model perspective when investigating disruptions to shipping and the implications regarding their vulnerability and resilience. The role of shipping alliances and the member shipping lines in terms of their actions and responses, which is usually not the focus of these studies, becomes an important area for investigation. Shipping alliances, through their member lines, hold the key to shipping network operation. Hence, understanding their behavior is an important subject that necessitates detailed investigation of the dynamics involved. For this research, we aimed to analyze the impact of disruption caused to container shipping networks arising from geopolitical tensions using the case of the Red Sea crisis. The crisis, which posed significant geopolitical risk to shipping networks, began in November 2023 with attacks by Houthis in Yemen (DIA, 2024) that subsequently forced many containerships to switch to the shipping route that goes by the Cape of Good Hope rather than the traditional Suez Canal. According to UNCTAD, monthly Suez Canal sailings fell by 41% between October 2023 and January 2024 (UNCTAD, 2024a). This disruption is unprecedented since the previous major canal closure, which took place in 1967. The Suez Canal sailing route is a vital passage for container trade between Asia and Europe, which totaled 23.0 million TEUs in 2023 (UNCTAD, 2024b) and ranks among the biggest globally by containers transported. Despite the significant impact of geopolitical tensions on shipping networks, there has been limited research.
The study aims to contribute to the literature in four areas. First, the research analyses the consequences of disruption caused to shipping networks by geopolitical tensions. This study focuses on shipping network vulnerability and resilience using the case of the Red Sea crisis. Second, the behavior of shipping alliances and the member lines through their operation of shipping services is a key focus of our analysis. It is important to understand the actions taken at the shipping line level. For this purpose, our research shall investigate the actions of the three container shipping alliances and their member shipping lines in their reaction to the crisis and impact on shipping networks that utilize the Suez Canal. Third, the analysis of the disruption shall focus on shipping services as the unit of analysis. This is different from other studies on shipping networks, which tend to focus on port-pairs or individual containerships. Our research further proposes the Vessel-Trade route-Port-call (VTP) framework for analyzing shipping network disruption, vulnerability and resilience. The framework utilizes information from three important components of shipping services, which are trade route served, vessels employed and port-call arrangement. Fourth, the study aims to offer useful implications for shipping lines, port managers, policy makers and researchers from the perspective of shipping network operation, vulnerability and resilience.
2. Literature review
Geopolitical tension is defined as the combination of military tensions between countries, trade disputes and threats of war and terrorist attacks, which presents a major impact on the international political system (Caldara and Iacoviello, 2022). It is associated with a climate of uncertainty that has international implications (Drobetz et al., 2021). Geopolitical tension and its associated uncertainties can disrupt shipping networks with corresponding negative effects on international trade costs through higher and more volatile freight rates and oil prices (Khan et al., 2021). Studies that investigated the implications of disruptions caused by military tensions to important maritime chokepoints included research that studied the Suez crisis of 1967–1975 (Feyrer, 2021), geopolitical concerns of the Panama Canal (Wu et al., 2019), impact from the Ukraine–Russia war (Srai et al., 2023) and impact from heightened risks of using the Suez Canal owing to tensions in the Middle East (Yap and Yang, 2024a). From the perspective of shipping network vulnerability, Fan et al. (2024) found terrorism to pose the highest risk for shipping routes, followed by piracy and military conflicts. The resilience of shipping networks also depends crucially on safeguarding port nodes against potential disruptions, which can be deliberately targeted (Mei et al., 2024). Chen et al. (2023) proposed that as ports attempt to cope with risks in their efforts to manage resilience, their role is often critical for maintaining the functional and structural integrity of shipping networks. Kotcharin and Maneenop (2020) further found that shipping companies lower their financial leverage as geopolitical tension rises. A decrease in fleet size will have implications for shipping network operations as coverage or capacity may be reduced. Such actions may further compromise the resilience capability and increase the vulnerability of the network.
Research on the topic of shipping network vulnerability and resilience has gained wider attention in the literature in recent years. These aspects are analyzed for shipping network adaptability and recovery capabilities when they are faced with disruptions. Methods used for examination included node degree and degree distribution (Crespo et al., 2014), network density and connectivity (Dixit et al., 2020), network efficiency and centrality (Meng et al., 2018), shipping route diversity (Zhang et al., 2022) and node redundancy (Wan et al., 2024). Notteboom et al. (2021) and He et al. (2022) highlighted that resilience and vulnerability are inherently time-dependent, where comparative analysis can be employed for different time periods. The authors conducted analyses for the impact on shipping networks in relation to the Global Financial Crisis of 2008 and the COVID-19 pandemic. The impact of disruptions to shipping networks caused by COVID-19 was also analyzed by Zis (2023) for the Suez Canal and Panama Canal, where the author suggested that canal fees could be an influential factor in route choice. On the use of Cape of Good Hope rather than the Suez Canal, Haralambides (2024) estimated that the route could incur approximately an additional 8,000 kilometers in sailing distance between Rotterdam and Shanghai and 12 more days of sailing time.
Analyses that focused on geographical regions could also be found in works which examined Europe (Liu et al., 2023), China (He et al., 2022), the Arctic (Yuan et al., 2020), the Regional Comprehensive Economic Partnership (Liu et al., 2024) and Maritime Silk Road (Yang and Liu, 2022). These studies underscored the important role of vessels and the impact of capacity being correlated with company performance (Lun and Marlow, 2011). The aspects of scale economies in vessel capacity employed (Yip et al., 2012), impact of vessels on schedule reliability (Notteboom, 2006) and vessel speed optimization (Elmi et al., 2022) were also examined. The studies further highlighted the aspect of adjustments to port-of-rotation or even port skipping as strategies to maintain and stabilize vessel schedules amidst disruptions to shipping networks.
Many studies have also considered both the role of vessels and ports within shipping networks. Verschuur et al. (2020) highlighted the fact that ports are situated in low-lying coastal and riverine locations coupled with the high concentration of vessel traffic, making them prone to disruptions, which can be natural or man-made. These disruptions are likely to result in simultaneous disruptions occurring at multiple ports. Calatayud et al. (2017) found a multilayered organization of shipping networks, which suggests that the impact of disruptions and degree of vulnerability will vary for different ports across networks. Huang et al. (2022) suggested that having backup hub ports in an extended hub-and-spoke network design can help to improve shipping network resilience while reducing its vulnerability. However, Xu et al. (2022) highlighted the complexity of shipping networks and the entrenched status of hub ports that could trigger cascading failures in the network, as alternative ports may not be able to accommodate the spillover effects from disruptions. In a study on port-to-port connections for global liner shipping networks, Wu et al. (2019) found that the impact of disruption to the Malacca Strait had the biggest impact on global supply chains, followed by the Suez Canal and Panama Canal. Achurra-Gonzalez et al. (2019) found that disruptions can have an even bigger impact on intra-regional connectivity as the effects cascade through the hierarchy of shipping networks. Verschuur et al. (2020) further proposed that ports are more likely to experience recovery in traffic volumes instead of being substituted.
Vessel Automatic Identification System (AIS) data has also seen increased usage in shipping network disruption analyses. Rousset and Ducruet (2019) deployed vessel information to study the effects of the Hanshin-Awaji earthquake on Kobe, Hurricane Katrina on New Orleans and the 9/11 attacks on New York City. Using a combination of vessel AIS data and liner service schedules, Dirzka and Acciaro (2022) analyzed vessel operations during the COVID-19 pandemic and found disruptions of shipping services as a means of risk mitigation to have a cascading impact, which led to other disruptions in shipping networks. Yap and Yang (2024b) showed the dynamic nature of shipping networks during the pandemic, where shipping lines often hold an influential role in the hierarchy of port-call structure within a geographical region. Viljoen and Joubert (2016), who also utilized AIS data, proposed that shipping lines are the most vulnerable among the stakeholders in shipping networks. Zhang et al. (2023) used AIS data, which showed shipping lines performing port-skipping to recover vessel schedules during the COVID-19 pandemic. Other vessel responses include speeding up and port swapping (Li et al., 2015). The authors opined that speeding up may not be sufficient to address major disruptions compared with port skipping and swapping. Wan et al. (2022) noted that differences in shipping network configurations may necessitate different approaches. Yap et al. (2023) highlighted the importance of shipping networks given their impact on trade access and economic performance, where maritime policies towards market contestability and port infrastructure hold important influences on network configuration and operation.
The literature highlights the close relationship between ports and shipping networks. The seeming symbiotic nature between the two aspects means that disruption in one aspect will have significant effects on the other. These effects will cascade through the network and affect multiple stakeholders across supply chains that connect one country or territory to another. However, the focus has been on the actions by individual vessels or connectivity between specific port-pairs or port regions. Even if the study considers the impact of geopolitical tensions, the role of shipping lines is usually neglected. Furthermore, the research generally neglected the role of shipping lines in the analysis of network resilience and vulnerability. This is a major deficiency given the substantial effects of shipping network disruptions on shipping lines. An important observation is that shipping lines often wield great influence in deciding the outcome for shipping networks with their responses. Our study acknowledges the central role held by shipping alliances and their member lines and the deliberate actions they take to create and shape shipping networks as they respond to shipping network disruptions. We further argue that the focus to be on shipping services as the unit for investigating shipping network disruptions, vulnerability and resilience. Vessels are operated and port-calls structured with the shipping service as the primary consideration (Yap, 2023). We aim to address these research gaps. Using the case of the Red Sea crisis, our research focuses on container shipping networks that utilize the Suez Canal prior to the disruption and the impact on them thereafter. The research framework is explained in the following section.
3. Research framework
The research framework for analyzing shipping network vulnerability and resilience arising from disruption is shown in Figure 1. The proposed VTP approach comprises three important components of a container shipping service, which are vessels employed, trade route served and port-call arrangement. The focus is on container shipping services, which are operated by shipping alliances as the unit of analysis. A container shipping service will comprise a single or a number of container vessels (Yap, 2023). Data for vessels employed comprises of information regarding the names of the vessels used, verified by their unique IMO numbers, capacity in terms of TEUs and operating shipping line. For the case of shipping alliance services, the smallest number of container vessels employed is 10 containerships. An example is the MD3 service operated by THE Alliance on the Asia-Mediterranean trade route. In October 2023, the service uses five container vessels, each from Hapag-Lloyd and Yang Ming. This service subsequently increased the number of container vessels employed to 15 ships by April 2024, with Yang Ming committing an additional five vessels. Container vessels in the container shipping service are employed on specified trade routes. Trade route data for the container shipping service will include information regarding the name of the trade route, sailing path and duration of a round trip. For the MD3 service, which operates on the Asia-Mediterranean trade route, the westbound (also known as the head haul) voyage connects from South Korea to Türkiye while the eastbound (also known as the backhaul) voyage returns from Türkiye to South Korea. The turnaround ports are Busan in South Korea, which is in Northeast Asia, and Ambarli in Türkiye, which is in the Eastern Mediterranean region. The total duration of a round trip was increased from 70 days in October 2023 to 105 days by April 2024 due to the requirement of avoiding the Red Sea and going around the Cape of Good Hope. The framework considers the third set of data, which concerns information regarding the port-of-call involved and includes the name of the port, associated country or territory, geographical region where the port is located and frequency of call by the shipping service. Container shipping service, which forms the core of shipping networks, will comprise containerships that are arranged to call at a set of ports. For the MD3 service, the ports-of-call in Asia are Busan, Ningbo, Shanghai, Shekou, Singapore and Kaohsiung. Ports-of-call in the Mediterranean are Ashdod, Ambarli, Evyap, Aliaga and Mersin. The service also calls at Jeddah in the Red Sea. Despite the Red Sea crisis, there was no change in the turnaround ports and frequency of port, which remained on a weekly basis. However, the number of port-calls was reduced from 14 ports in October 2023 to 12 ports by April 2024. Weekly port-calls at Jeddah, Ashdod and Evyap were substituted by calls at Izmit and Damietta. There was no further change in the port-of-rotation between April 2024 and October 2024. Hence, the framework presents a holistic assessment from the supply side perspective for shipping capacity operated by shipping alliance services.
The framework is applied to analyze the disruption caused by geopolitical tension in the form of the Red Sea crisis. An analysis is made of container shipping services that are operated by the three shipping alliances. Members of the three shipping alliances, which are the 2M alliance, Ocean Alliance and THE Alliance, accounted for more than 80% of the total containership capacity employed in 2023 and 2024 (Alphaliner, 2024). For this purpose, we construct data sets for the time periods of October 2023, April 2024 and October 2024, with each dataset comprising vessel data, trade route data and port-call data. The data set for October 2023 denotes the “prior-to-event” period given that the first attacks on shipping began in November 2023 (DIA, 2024). The second data set, which pertains to the period of April 2024, attempts to account for changes in container vessel routing after the crisis had begun and considers adjustments for a container vessel voyage round trip, which can take two to three months to complete. The analysis noted that changes in vessel routings by container shipping lines, which were initiated in November and December 2023, could take up to March 2024 to be completed. April 2024 also marks the “after-event-began” period, as well as being the sixth month counting from November 2023. The third dataset, which pertains to the period of October 2024, marks another six months, counting from May 2024 and a one-year period from October 2023. Distinguishing the analysis into two six-month timeframes further allows identification of which periods where most of changes occurred and whether shipping alliance services took immediate responses or adopted a “wait-and-see” approach and implemented changes in the later period.
The next step is to apply comparative analysis to analyze the behavior of shipping alliance member lines by their organization of shipping services in response to the disruption event. The analysis of resilience and vulnerability of shipping networks is made using three aspects, which are vessel employment, trade route served and port-call arrangement. The analysis of vessel employment focuses on the metrics of vessels and vessel capacity employed in shipping alliance services, while the investigation of trade routes served analyzes the operation and routing of alliance services. Examination of port-call arrangements should focus on the metrics of port-call coverage and frequency of these calls. The datasets developed for October 2023, April 2024 and October 2024 serve as building blocks for the application of comparative analysis. The analysis for vessel employment focuses on changes observed regarding the vessel capacity operated by shipping lines, including any variations in alliance operators and shipping services. A key aspect is to analyze changes in vessels and vessel capacity deployed in container shipping services. The vessel capacity metric is computed by the sum of vessels and data for their capacity in TEUs that are operated by the shipping services of the three alliances. Note that average vessel size is determined by total vessel capacity divided by the number of vessels involved. The analysis also includes the metric of annualized vessel slot capacity. To determine this figure, we begin by focusing on the amount that is deployed in a container shipping service j, which is represented as
where
denotes total annualized vessel slot capacity operating in shipping service j;
denotes frequency of port-call in a year for shipping service j;
denotes number of vessels operated by shipping line k in shipping service j;
represents capacity in TEUs for vessel v operated by shipping line k in service j.
A trade route will comprise of annualized vessel slot capacities that are deployed by all container shipping services that ply on it. As such, annualized vessel slot capacity deployed on a trade route is the summation for all shipping services j plying the trade route r. This is represented by
where
denotes total annualized vessel slot capacity operating on trade route r;
denotes frequency of port-call in a year for shipping service j on trade route r;
denotes number of vessels operated by shipping k in shipping service j on trade route r;
represents capacity in TEUs for vessel v operated by shipping line k in service j on trade route r.
Our analysis distinguishes between different trade routes operated by shipping services of the 2M alliance, Ocean Alliance and THE Alliance. The trade routes are determined by the ports-of-call and turnaround ports by individual services. Analysis of trade routes served focuses on changes observed regarding the continued operation of the service, duration of a round trip and sailing route taken by vessels employed in shipping alliance services for the trade route.
The analysis of port-call arrangement focuses on changes observed regarding coverage of ports, number of port-calls received, and frequency of these calls. The analysis will also investigate changes regarding weekly calls by alliance services at the ports and the vessel slot capacity involved. The weekly vessel slot capacity for all shipping services that call at port x is represented by
where
denotes total annualized vessel slot capacity that call at port x;
denotes frequency of port-call in a year for vessels in shipping service j on trade route r;
represents capacity in TEUs for vessel v operated by shipping line k in service j on trade route r;
equals 1 when shipping service j by shipping line k operates the vessel v on trade route r calls at port x and 0 otherwise.
Information for the October 2023, April 2024 and October 2024 datasets is extracted from the MDS Transmodal (2023, 2024a, b) containership database, which tracks shipping service, port-of-call, frequency of call and shipping line operator by individual container vessels. Data for October 2023 contained information for 5,784 fully cellular container vessels totaling 27.1 million TEUs in vessel capacity, whereas the respective figures for April 2024 are 6,023 fully cellular container vessels totaling 29.2 million TEUs in vessel capacity. Data for October 2024 contained information for 6,154 fully cellular container vessels totaling 30.1 million TEUs in vessel capacity. The extracted data for each period is validated by comparing with information available for vessel sailing and port-calls published on the websites of respective shipping lines and vessel sailings using AIS information tracked by MarineTraffic.com. The information for vessel sailing is also used to determine the route taken by vessels that are employed in the shipping alliance services. The AIS information collected during the periods of October 2023, April 2024 and October 2024 is used to complement and validate service schedules and vessel employment by the shipping alliance services. The database for October 2023 is also employed as a reference to identify those shipping services that used to pass through the Red Sea and Suez Canal. For these shipping services, their sailing route after the crisis had started shall be determined by comparing with the data for April and October 2024. The data for April and October 2024 are also used to identify any other alliance services that use the Red Sea route even with the crisis, as well as any new shipping services that were inaugurated.
4. Research findings
4.1 Vessel employment
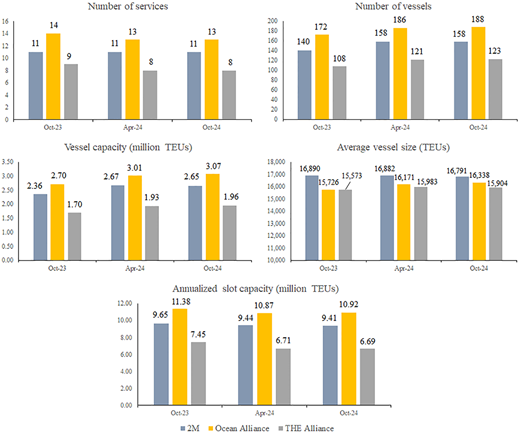
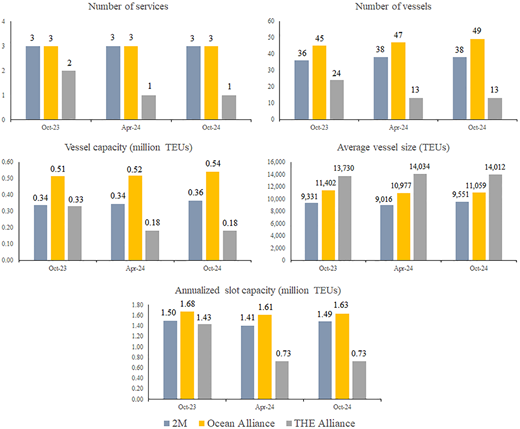
Results for vessel employment provide an overview of developments in capacity deployed in the alliance shipping networks. With reference to Figure 2, research findings showed 420 containerships involving 6.8 million TEUs of vessel capacity to use the Red Sea and Suez Canal route in October 2023. This shipping capacity was deployed in 34 alliance shipping services. Specifically, the period prior to the Red Sea crisis saw the Ocean Alliance, 2M alliance and THE Alliance operating respectively 14, 11 and 9 services. With the occurrence of the Red Sea crisis, which disrupted the traditional Suez Canal route, the most significant changes were seen between October 2023 and April 2024. In terms of services being operated, the period saw the suspension by the Ocean Alliance and THE Alliance of one service each. A total of 465 containerships were employed in the remaining 32 alliance services. Of this amount, 403 containerships involving 7.1 million TEUs of vessel capacity took the Cape of Good Hope route. This represented 86.7% and 92.7% of the total containerships and vessel capacity employed in alliance services.
All three alliances deployed more vessels and vessel capacity between October 2023 and April 2024, with the largest magnitude of increase observed for THE Alliance and 2M alliance. Vessels and vessel capacity operated by THE Alliance increased by 12.0% and 13.9%, respectively, whereas the increases for these parameters by the 2M alliance were 12.9% and 12.8% respectively. The increase seen by the Ocean Alliance was comparatively smaller at 8.1% and 11.2% respectively. The increase in vessels and vessel capacity is attributed to the longer sailing route that uses the Cape of Good Hope. The number of containerships added to alliance services that used this route ranged from one to five vessels. For example, the MD3 service operated by THE Alliance saw Yang Ming add five containerships totaling 63,500 TEUs in vessel capacity. Services that saw four containerships added included the Ocean Alliance’s FAL5 service and THE Alliance MD1 and MD2 services. Most of the services saw two to three containerships added. Despite additional vessels and vessel capacity being employed, the frequency of port-calls for shipping services was maintained on a weekly basis. However, the reduction in annualized vessel slot capacity was significant for THE Alliance, which declined by 9.9%. For THE Alliance, the reduction affected the EC4 and FE4 services. Similar observations were made for the Ocean Alliance’s FAL1, FAL7 and FAL8 services although the magnitude of reduction to annualized vessel slot capacity was smaller at 4.5% to 10.9 million TEUs by April 2024. The 2 M alliance also saw a reduction in annualized vessel slot capacity by 2.1% from 9.7 million TEUs in October 2023 down to 9.4 million TEUs in April 2024.
With reference to the same figure, the period between April 2024 and October 2024 saw relatively little change in the number of services, number of vessels, vessel capacity and annualized vessel slot capacity employed. Containerships using the Cape of Good Hope rose to 407 vessels, while the number of ships using the Red Sea and Suez Canal remained at 62. In terms of average size of vessels deployed, the three periods saw few changes with the 2M alliance registering the highest figure of 16,800–16,900 TEUs, followed by the Ocean Alliance at 15,700–16,300 TEUs, and lastly for THE Alliance at 15,600–16,000 TEUs. Overall, the Red Sea crisis saw the number of vessels and vessel capacity deployed in the remaining 32 services increase significantly for all three alliances. Resilience of the shipping network was seen in terms of this additional capacity deployed to maintain frequency at weekly calls for affected shipping alliance services, despite them having to use the longer sailing route of going via the Cape of Good Hope. The largest rate of increase was by THE Alliance. Nonetheless, despite the significant boost to vessels employed, THE Alliance continued to operate with the smallest capacity among the three alliances. The Ocean Alliance also remained as the largest operator with the most services and the biggest capacity.
4.2 Trade route served
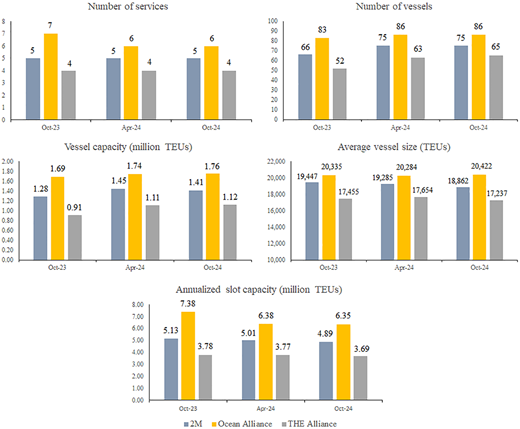
Results from trade routes provided insights into the specific deployment of vessels and changes made to alliance shipping networks with the Red Sea crisis taking place. The findings revealed shipping services that pass through the Suez Canal and Red Sea in October 2023 to comprise those that connect between Asia and Europe, Asia and the Mediterranean and Asia and the East Coast USA. Of the remaining 32 shipping alliance services that continue to work on these trade routes, all but five had switched to use the Cape of Good Hope by April 2024. There were no changes to the routing as of October 2024. For the Asia–Europe trade route, the period between October 2023 and April 2024 saw the total number of shipping services reduced from 16 to 15 (see Figure 3). The most significant changes also occurred during this period when the remaining alliance services switched to avoid the Suez Canal and Red Sea. This resulted in 14–28 additional sailing days for a service round trip from Asia to Europe and back to Asia. THE Alliance witnessed the biggest increase with 21–28 days of additional sailing (see Table 1). Shipping services operated by the 2M alliance and Ocean Alliance added 14–21 days in sailing duration for a round trip. Of the three alliances, the 2M alliance saw the biggest increase in the number of vessels and vessel capacity of 13.6% and 12.7%, respectively. This helped to keep annualized vessel slot capacity almost constant throughout the three periods. The same observation was made for THE Alliance, where an increase in vessel capacity due to longer sailing distances helped to maintain annualized vessel slot capacity at about 3.7 million TEUs. By comparison, the Ocean Alliance had suspended one service, which resulted in annualized vessel slot capacity offered by their remaining services declining by 13.6%. There were few changes in the period of April 2024 and October 2024. As of October 2024, the Asia–Europe trade route continued to see the largest amount of shipping capacity deployed with 226 containerships, which amounted to 4.3 million TEUs in vessel capacity and translated to 14.9 million TEUs in annualized vessel slot capacity. Specifically, the Asia–Europe trade route accounted for 48% of vessels and about 55% of vessel capacity and annualized vessel slot capacity deployed. The Ocean Alliance also continued to operate the largest number of vessels and vessel capacity among the three alliances.
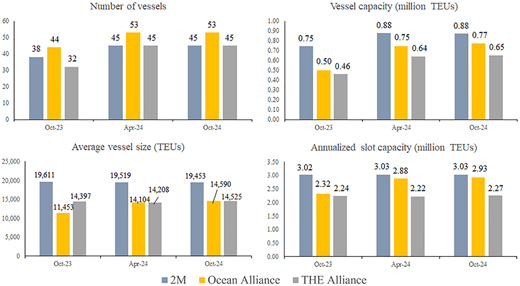
For the Asia-Mediterranean trade route, there were no changes in the number of shipping services operated throughout the period of analysis, with the Ocean Alliance deploying four services and three services each by the 2M alliance and THE Alliance. However, the Red Sea crisis saw all but one shipping service switch to use the Cape of Good Hope. The remaining service is the Ocean Alliance’s Phoenician Express, which is operated entirely by CMA CGM using 11 containerships. The service previously included containerships from COSCO Shipping and Evergreen in October 2023. The increase in the duration of a round trip for services that operate on this trade route ranged from 7 to 35 days. Again, the biggest increase was observed by THE Alliance, which saw 28 to 35 days added to each of their services. Additional sailing duration for services operated by the 2M alliance and Ocean Alliance was comparatively less, ranging from 7 to 21 days. As with the Asia–Europe trade route, the most significant changes were observed between October 2023 and April 2024. With reference to Figure 4, a major increase in vessels and vessel capacity was recorded by all three shipping alliances. An additional 29 containerships were added to the trade route, which involved 0.56 million TEUs in vessel capacity and 0.54 million TEUs in annualized vessel slot capacity. The Ocean Alliance was also found to deploy much larger containerships, which brought their average vessel size up to 14,104 TEUs by April 2024, an increase of 23.1% from 11,453 TEUs in October 2023. Notably, the annualized vessel slot capacity offered by the Ocean Alliance rose significantly for this trade route by 18.5% to 2.9 million TEUs by April 2024. This was unlike the other two alliances where additional vessel capacity was used to maintain their respective amounts of annualized vessel slot capacities offered. Few changes were observed for the period from April 2024 to October 2024. As of October 2024, there were 143 containerships involving 2.3 million TEUs in vessel capacity and 8.2 million TEUs in annualized vessel slot capacity operating on the Asia-Mediterranean trade route.
The remaining shipping capacity is deployed in alliance services that connect between Asia and the East Coast USA. With reference to Figure 5, the most significant change was the suspension of the EC4 service by THE Alliance, which took place between October 2023 and April 2024. This adjustment saw a major reduction in containerships and associated vessel capacity and annualized vessel slot capacity by 45–49% for the entity. THE Alliance operates the remaining EC5 service, which continues to go through the Suez Canal and Red Sea. Marginal increases in the number of vessels and vessel capacity were seen for the 2M alliance and Ocean Alliance for this trade route. Two shipping services operated by the 2M alliance and one service by the Ocean Alliance also continued to use the Suez Canal and Red Sea passage. The results further showed that the slight reduction in annualized vessel slot capacity between October 2023 and April 2024 was largely restored by October 2024. The average size of the containership also remained almost unchanged for all three alliances. Compared to the other two trade routes, additional sailing days for the duration of a service round trip were lower. The biggest increase was up to 14 days added for CMA CGM’s Columbus JAX service.
Results from the trade route perspective saw the cancellation of one service by the Ocean Alliance for the Asia–Europe route and another service by THE Alliance for the Asia-East Coast USA route. These changes took place between October 2023 and April 2024. Despite the service cancellation by the Ocean Alliance for the Asia–Europe trade route, resilience of the shipping connection between Asia and Europe is shown by having relatively little change in the amount of annualized vessel slot capacity offered, with all remaining services maintaining their frequency of weekly calls. The three alliances had deployed additional vessels and vessel capacity to maintain service frequency with longer sailing distances involved. However, the service cancellation by THE Alliance for the Asia-East Coast USA trade route saw a significant reduction in terms of annualized vessel slot capacity offered due to a net reduction of 11 vessels or 0.15 million TEUs in vessel capacity for the trade. Nonetheless, the traditional sailing path for the Asia–Europe trade route, which uses the Suez Canal is shown to be vulnerable to the Red Sea crisis as there were major changes to sailing paths taken with all 15 alliance services switching to use the longer Cape of Good Hope route. Of the ten shipping services that operate on the Asia-Mediterranean trade route, all but one also switched to use the much longer Cape of Good Hope route. For the Asia-East Coast USA trade route, three of the remaining seven services also switched to go via South Africa.
4.3 Port-call arrangement
Results for analysis of port-call arrangements similarly saw the most significant changes recorded between October 2023 and April 2024. With reference to Table 2, the shipping networks of the three alliances saw a net reduction of 54 weekly port-calls between October 2023 and April 2024 and another net reduction of 9 weekly port-calls from between April and October 2024. While the Ocean Alliance continues to operate the largest number of weekly port-calls at 158 as of April 2024, the alliance’s shipping network also witnessed the biggest decline of 30 weekly port-calls or 16.0%. The second largest number of weekly port-calls was made by shipping services of the 2M alliance. However, the entity also experienced a major reduction in the same period by 13 weekly port-calls or 8.6% to its network. THE Alliance, which had the smallest number of weekly port-calls, similarly saw a 9.6% decline to 103 weekly port-calls remaining as of April 2024. Our analysis on developments in port-call arrangements and associated impact on weekly vessel slot capacity for the Asia–Europe, Asia-Mediterranean and Asia-East Coast USA trade routes shall focus on the period from October 2023 to April 2024, given that most changes had occurred during this time frame.
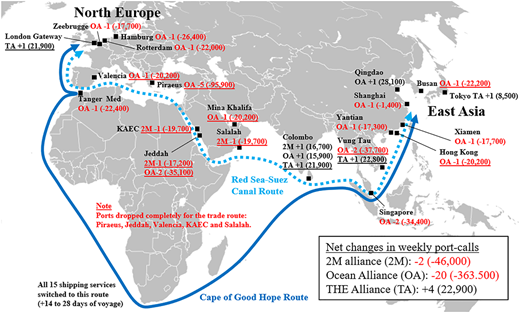
For the Asia–Europe trade route, the biggest reduction in weekly port-calls was observed for the shipping network of the Ocean Alliance, which fell by 23.0%–67 weekly port-calls by April 2024. With reference to Figure 6, the corresponding net decline in weekly vessel slot capacity was 363,500 TEUs or 20.8%. Rerouting of all remaining six services by the alliance for the trade route saw suspension of calls at Busan, Hong Kong, Vung Tau, Mina Khalifa, Jeddah, Piraeus and Valencia and affected 251,300 TEUs in weekly vessel slot capacity. Piraeus was the worst affected, where five weekly port-calls involving 95,900 TEUs in vessel slot capacity were stopped. For example, the port was dropped from the alliance’s FAL2 and FAL8 services. Vessel routing in these services sailed directly from Singapore to Rotterdam or Antwerp via the Cape of Good Hope, while they had previously included a stopover at Piraeus. Port-calls at Shanghai, Xiamen, Yantian, Singapore, Tanger Med, Zeebrugge, Rotterdam and Hamburg were also negatively affected. The impact of reductions seen with the shipping networks of the 2M alliance and THE Alliance were comparatively smaller. Calls at Jeddah, Salalah and King Abdullah Economic City (KAEC) were stopped by the 2M alliance, while THE Alliance added London Gateway, Vung Tau and Colombo to its Asia–Europe network. An example was the 2M alliance’s adjusted AE5 service, which substituted the ports of KAEC and Salalah with Colombo on its return voyage to East Asia from Tanger Med via the Cape of Good Hope. The port of Colombo became a key beneficiary of the Red Sea crisis, with each alliance initiating a new service call at the port. Colombo saw its weekly vessel slot capacity more than double from 40,500 TEUs in October 2023 to 95,000 TEUs by April 2024. The number of port-calls at the port also rose from two to five calls a week.
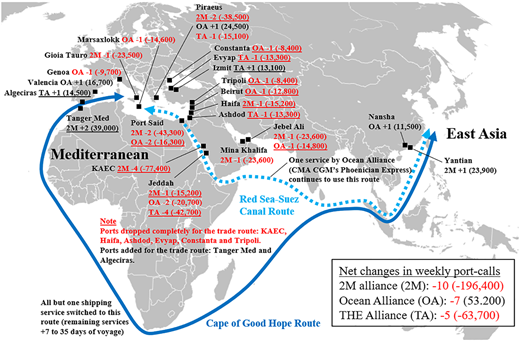
For the Asia-Mediterranean trade route, the magnitude of changes in weekly port-calls and vessel slot capacity was the biggest for the 2M alliance. The alliance’s shipping network saw a net reduction in weekly port-calls by 19.2% and weekly vessel slot capacity by 19.4%. With reference to Figure 7, port-calls at Jeddah, KAEC, Haifa and Piraeus were stopped and weekly calls at Jebel Ali, Mina Khalifa, Port Said and Gioia Tauro were negatively impacted. An example of adjustment can be seen by MSC’s Jade service, which dropped Port Said and Gioia Tauro on its westbound voyage from Singapore with the first port-of-call becoming Valencia in the Western Mediterranean region. The service also initiated calls at Tanger Med, with it being the last port-of-call in the Mediterranean before taking the Cape of Good Hope route to reach Singapore in Asia. The service had previously called at Port Said, KAEC, Mina Khalifa and Jebel Ali on its eastbound sailing before stopping over at Singapore. Tanger Med also became the last port-of-call in the Mediterranean for Maersk’s AE12 service before calling at Singapore. Ports that were dropped on the eastbound sailing for the service included Port Said KAEC and Jeddah. THE Alliance similarly suspended port-calls at Jeddah as well as Ashdod and Evyap and reduced the capacity deployed to Piraeus. An example is the MD1 service, which substituted Damietta and Jeddah on its eastbound voyage with Algeciras as the vessels switched to use the Cape of Good Hope. The overall net impact was a decline in weekly port-calls of 11.6% and weekly vessel slot capacity of 10.5%. An interesting development was seen by the Ocean Alliance where a net reduction in weekly port-calls was accompanied by an increase in weekly vessel slot capacity by 53,200 TEUs or a growth of 7.8%. This is attributed to the significant boost in vessel number and vessel capacity by 20.5% and 23.1%, respectively, especially with significantly larger vessels deployed by the alliance to the trade route, which rose by 48.3%. The figure shows weekly port-calls being suspended at many ports in the Eastern Mediterranean and Black Sea regions. However, the biggest reduction in weekly vessel slot capacity was seen at Jeddah, KAEC and Port Said, where suspension and/or reduction in port-calls respectively affected 78,600 TEUs, 77,400 TEUs and 59,600 TEUs. Key ports that benefitted from the crisis for the trade route included Tanger Med, which began to host services operated by the 2M alliance. Algeciras also began to receive calls from the shipping network of THE Alliance.
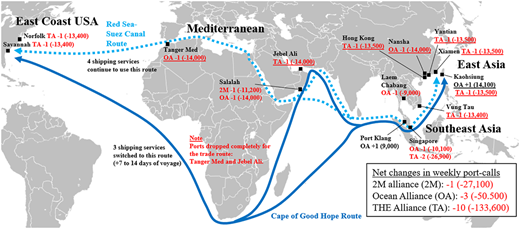
For alliance shipping services that operate on the Asia-East Coast USA trade route, the shipping network of THE Alliance was the most affected with weekly port-calls stopped for Xiamen, Yantian, Kaohsiung, Hong Kong, Vung Tau and Jebel Ali (see Figure 8). This development was due largely to the suspension of the EC4 service, which is jointly operated by shipping lines Hapag-Lloyd, ONE and Yang Ming. In total, a net reduction of 10 weekly port-calls and 133,600 TEUs in weekly vessel slot capacity was seen for the alliance. The shipping networks of the other two alliances saw comparatively fewer changes, except for weekly calls at Nansha and Tanger Med, which were removed by the Ocean Alliance. The port of Jebel Ali was also removed from the shipping network operated by THE Alliance due to changes in vessel routing by the remaining EC5 service, which switched to use the Cape of Good Hope. For the Ocean Alliance, Tanger Med was dropped from its Columbus service as vessels sailed directly from Colombo to Halifax via the Cape of Good Hope. The period from April 2024 to October 2024 saw comparatively fewer changes in port-calls and associated weekly vessel slot capacity.
Results from the port-call perspective saw reductions in weekly calls across all the three trade routes. The decline was most significant for the Ocean Alliance for the Asia–Europe trade route and 2M alliance for the Asia-Mediterranean trade route. The magnitude of reduction was the biggest for THE Alliance for connections between Asia and East Coast USA with a decline of 43.5% in port-calls. Results further showed that most of the changes occurred in shipping services between October 2023 and April 2024. Resilience from the port-call perspective showed that ports most affected by the reduction in weekly calls, based on reactions by shipping alliances and their member lines to the Red Sea crisis, are those in the Red Sea and Eastern Mediterranean regions. Comparison with shipping data between October 2023 and October 2024 showed that Piraeus, Jeddah, Valencia, KAEC and Salalah had been removed from the Asia–Europe trade route. KAEC was also dropped by the Asia-Mediterranean trade route, as were Jebel Ali, Mina Khalifa, Haifa, Ashdod, Evyap and Constanta. The ports of Jebel Ali, Tanger Med and Kaohsiung were also removed for shipping services that connect between Asia and the East Coast USA.
5. Discussion of implications
The Red Sea crisis represents the longest disruption to the traditional Suez Canal-Red Sea route since the Yom Kippur War of 1973. The Suez Canal has been used by container shipping services to connect between Asia and Europe, Asia and the Mediterranean, and some services that connect between Asia and the East Coast USA. The focus of the analysis is on responses adopted by shipping alliance services in the new shipping landscape. Our research offers four important implications from the perspective of geopolitical tensions posed to shipping network resilience and vulnerability for shipping lines, port managers, policy makers and researchers. First, the results showed that the traditional Suez Canal-Red Sea route, which offers the shortest path of maritime connection between Asia and Europe and the Mediterranean, is vulnerable. Disruptions caused by geopolitical tensions in the form of the Red Sea crisis forced many shipping services to divert to alternative routes. Only one out of the ten shipping services operating on the Asia-Mediterranean trade continued to use the Suez Canal-Red Sea route despite the crisis. Three out of seven remaining shipping services which connect Asia and East Coast USA, and all the remaining 15 Asia–Europe services were rerouted to use the Suez Canal. These changes to shipping service routings were in effect by April 2024 and remained in place as of October 2024, which is one year into the crisis. The research findings revealed that shipping lines undertook major adjustments to their shipping services within the initial months of the crisis. The changes that were put in place by April 2024 experienced few changes thereafter when the study analyzed shipping service information in October 2024. Results further showed that the Cape of Good Hope remains the preferred alternative route between Asia and Europe and the Mediterranean rather than other options such as going via the Panama Canal. Results also showed that there were no port-calls made in the regions of East Africa, South Africa and West Africa despite many shipping services passing through these areas.
Second, we saw different strategies employed by each shipping alliance to handle disruptions caused by the Red Sea crisis by the resilience perspective of their shipping networks. While service frequency was maintained with weekly port-calls, there was cancellation of the FAL7 service by the Ocean Alliance for the Asia–Europe trade route and the EC4 service by THE Alliance for the Asia-East Coast USA trade route. Despite deploying more vessels and vessel capacity, these suspensions significantly lowered the amount of annualized vessel slot capacity offered by both alliances on their affected trade routes. This was despite the Ocean Alliance deploying more vessels and vessel capacity for the affected Asia–Europe trade route. In contrast, the 2M alliance was able to maintain its service frequency and the amount of annualized vessel slot capacity offered with no cancellations of services for these trade routes. Third, the resilience perspective from port-call arrangements showed significant reductions in port-calls registered by all three alliances, particularly for connections to ports in the Red Sea and Eastern Mediterranean regions. Results showed that the number of port-calls in these regions had fallen from 55 in October 2023 to 23 by April 2024. The number of vessels, vessel capacity and weekly vessel slot capacity also fell respectively by 47.1%, 49.5% and 59.3% during this period. This suggests that the shipping alliances are prepared to sacrifice some port-calls to maintain service frequency by using the longer distanced Cape of Good Hope. This development also suggests that ports in the Red Sea and Eastern Mediterranean regions are most vulnerable to disruptions caused by the Red Sea crisis.
Fourth, the research presents the VTP framework as a feasible and useful approach for future research efforts in analyzing the impact of shipping network vulnerability and resilience due to disruptions caused to container shipping networks from the supply side perspective. The approach investigates three crucial components of container shipping services, which are vessels employed, trade route of operation and port-of-call involved. These components offer a thorough and comprehensive assessment from the supply side perspective. The research further emphasizes using container shipping services as the unit of analysis, given that they form the core of shipping networks and vessel deployment and port-calls are organized from the viewpoint of shipping services.
6. Conclusion and recommendations for future research
With the global economy and international supply chains highly dependent on container shipping networks, the impact of disruptions caused to shipping networks by geopolitical tensions becomes a major concern. Shipping network vulnerability and resilience have important implications from policy, industry and research perspectives. The impact of geopolitical tensions on disrupting shipping networks is manifested through the Red Sea crisis. Our research offers an original approach to analyze shipping network resilience and vulnerability due to disruption caused by geopolitical tensions. The proposed VTP framework considers three crucial components of container shipping services. The framework is applied to the Red Sea crisis and studies the impact on shipping services operated by shipping alliances. Our research offers new perspectives with empirical evidence drawn from the responses of shipping alliances and their member lines. Careful data preparation draws on information published by shipping databases, shipping line websites and AIS data for operating vessels. We further focus on the important aspect of shipping alliance member lines’ behavior, given that they are the main organizers and operators of shipping networks. This study makes a useful contribution to the literature with implications for the theoretical and practical dimensions of shipping network operation, resilience and vulnerability. We aim for the study to generate greater interest in understanding shipping networks by going beyond the traditional emphasis on vessel data and port-pair connections. For further research, we offer the following recommendations. Firstly, the study emphasizes shipping services that are operated by shipping alliances using snapshots taken for the three periods of October 2023, April 2024 and October 2024. The data are largely based on shipping service schedules with AIS data drawn from snapshots of vessel activity within each month. It will be useful to draw on AIS information on a continuous basis for the entire period of the study for a more thorough assessment. This will also enable accounting for the features of seasonal container shipping service operations. Second, the research is conducted from the supply side perspective of container shipping operations. Future studies could consider demand-side developments, which include actual containers transported as well as freight rate movements, to offer a more comprehensive assessment of the impact of disruptions to shipping by geopolitical tensions. Third, it is known that the structure of shipping alliances will change with Maersk and Hapag-Lloyd coming together to form the Gemini Cooperation. With a new alliance landscape taking place in 2025, future research could consider the impact of disruptions caused by geopolitical tensions on the new alliance shipping service organization, given the continuation of the crisis. Furthermore, future research can also consider the perspectives of non-alliance services. Accounting for these aspects could provide deeper insights into disruptions caused by geopolitical tensions and the impact on shipping network resilience and vulnerability.