The use of queueing network models was stimulated by the appearance (1975) of the exact product form solution of a class of open, closed and mixed queueing networks obeying the local balance principle and solved, a few years later, by the popular mean value analysis algorithm (1980). Since then, research efforts have been produced to approximate solutions for non-exponential services and non-pure random mechanisms in customer processing and routing. The purpose of this paper is to examine the suitability of modeling choices and solution approaches consolidated in other domains with respect to two key logistic processes in container terminals.
In particular, the analytical solution of queueing networks is assessed for the vessel arrival-departure process and the container internal transfer process with respect to a real terminal of pure transshipment.
Numerical experiments show the extent to which a decomposition-based approximation, under fixed or state-dependent arrival rates, may be suitable for the approximate analysis of the queueing network models.
The limitation of adopting exponential service time distributions and Poisson flows is highlighted.
Comparisons with a simulation-based solution deliver numerical evidence on the companion use of simulation in the daily practice of managing operations in a finite-time horizon under complex policies.
Discussion of some open modeling issues and encouraging results provide some guidelines on future research efforts and/or suitable adaption to container terminal logistics of the large body of techniques and algorithms available nowadays for supporting long-run decisions.
1. Introduction
Logistic processes in a maritime container terminal are defined around complex operations requiring careful decisions to allocate company resources and schedule their usage according to effective cost-performance choices and policies. From the outer level of the strategic choices in the long term to the inner level of the operational management in the short term, queueing networks are the natural conceptual model for bottleneck detection and quantitative evaluation of both system and user performance metrics under congestion. The successive “what-if” based optimization centered on a queueing network model can either be pursued by a simulation-based solution or an analytical solution.
Nowadays, several Windows-based frameworks for the development, verification and validation of simulators aimed at reproducing in great detail and even in continuous time the execution of specific operations are available for operation managers. On the contrary, no such frameworks are available for the (approximate) analytical solution of queueing networks tailored upon the domain of port logistics. Despite this, analytical models can provide useful insight and credible solutions when the terminal manager wants to evaluate, at the strategic level, the system as a whole. These solutions correspond to a first-order analysis, under stationary conditions, of performance metrics obtained from a queueing network model under the relaxation of some realistic features in resource allocation and activity scheduling that are not necessary at the strategic level. Here lies the role of analytical queueing networks: at the price of simplifying the model at hand, the manager could execute a fast “what-if” analysis to explore the benefits or the drawbacks on the long run of adopting some basic organizational choices. In particular, these choices could concern the number of cranes to be deployed along the quay or on the yard, accompanied by the integrated determination of the right number of vehicles for internal transfer of containers. To provide an accurate analytical evaluation of performance measures, the right attention should be paid to the adoption of open queueing networks under arrivals as renewals vs closed queueing networks and the adoption of exponential vs non-exponential assumptions for service times and interarrivals.
After this first modeling step, the queueing network at hand may require model refinements to match detailed organizational features of the real domain. This further step should drive the operation manager to switch to model resolution by means of discrete-event simulation and, thus, provide confidence intervals upon the expected values of the performance metrics of interest. Here simulation plays its proper role because of its exclusive capability of reproducing complex policies for resource allocation and activity scheduling even in a finite-time horizon and, therefore, highlighting effects on performance metrics in the system’s transient state. Thanks to visual simulation frameworks, the manager may also adopt continuous simulation to highlight further details of interest. An exhaustive review on simulation studies for port logistics can be found in (Dragovich et al., 2017).
Here we focus on the evaluation of average performance measures under queuing phenomena by means of analytical methods. The suitability and effectiveness of using analytical queuing approximations to get an approximate evaluation of terminal throughput, vessel sojourn time, internal vehicle round trip and container handling at berthing points and storage areas are worthy of investigation. Hence, the consideration of about 40 years of research results obtained in other application domains appears to be the first step to be taken.
Since the second half of the 1970s, queueing network models based upon the so-called class of Baskett-Chandy-Muntz-Palacios (BCMP) networks (Baskett et al., 1975) have been successfully applied to various real domains. Most of them have been conceived to support new designs and strategical decisions for both computer-communication systems (Graham, 1978; Lam and Wong, 1982a; Lam and Wong, 1982b; Balbo and Serazzi, 1997; Casale et al., 2014) and flexible manufacturing systems (Solberg, 1978; Stecke and Suri, 1986; Buzacott and Shanthikumar, 1993; Zijm et al., 2000; Manitz, 2015). Their analytical solution has been well appreciated for getting a first and fast response to alternative system configurations and management policies under examination (Bolch et al., 2006). Here we focus on the (relatively) new domain of maritime logistics which demands renewed research efforts because it is rich of both classical and non-standard queueing features that are difficult to address by analytical solution (Ulusçu and Altiok, 2009; Ulusçu and Altiok, 2013).
Despite some of these features, the analytical (stationary) solution of exponential closed queueing networks with load dependent servers to model traffic congestion has been used for evaluating the optimal number of internal vehicles with respect to the system throughput (Roy et al., 2016). Even isolated queues under Poisson arrivals and exponential services have been adopted in (Zhang et al., 2016) to support strategic decisions regarding the allocation of yard storage spaces under the (mixed) storage strategy of stacking both inbound and outbound containers in the same block.
In this paper, two specific queueing network models are presented to cope with modeling needs and quantitative evaluation of the two major logistic processes in a real container terminal of pure transshipment. The first queueing network is drawn from the more complex hierarchical model originally proposed and simulated by (Legato and Mazza, 2001) whose aim was to represent a complex port admission policy within the vessel arrival-departure process. Here it is retrieved and simplified to focus on the suitability of analytical approximate solutions under non-exponential service times and the first-come first-served (FCFS) discipline. The second queueing network model at hand for our current investigation on approximate analytical solutions is the one originally proposed by these authors in (Canonaco et al., 2008). This model was devoted to represent container discharge and transfer to storage yard blocks by means of a fleet of shuttle vehicles. It was solved by discrete-event simulation with the purpose of carrying out a “what-if” based optimization of the dynamic assignment of shuttle vehicles to quay cranes depending on the state of the crane (i.e. unfinished work).
The rest of the paper is organized as follows. Section 2 presents a critical discussion on the consolidated approximate solution methods available nowadays, but whose suitability and effectiveness for queueing models in port logistics has to be assessed. Section 3 describes two general queueing network models with a focus on their non-standard queueing features. Section 4 presents the numerical experiments carried out for the models once they have been tailored with respect to a real container terminal of pure transshipment. Conclusions are drawn in Section 5.
2. Literature review on analytical approximate solutions
A significant boost to the practical application of BCMP networks (Baskett et al., 1975) came from the celebrated mean value analysis (MVA) algorithm (Reiser and Lavenberg, 1980). It provided the exact analytical solution of open, closed and mixed queueing networks, once the initial difficulties, such as numerical stability, under load-dependent servers were solved (Reiser, 1981). The close relationship between MVA and BCMP networks was further consolidated by the mean value analysis load-dependent mixed (MVALDMX) algorithm for multiclass mixed (i.e. closed and open) networks under load-dependent service stations (Bruell et al., 1984).
Generally speaking, whenever a queueing network was refined to match the realistic details of a domain, it was (and still is) necessary to resort to the resolution by means of discrete-event simulation, to provide reliable confidence intervals on the expected values of the performance measures of interest. The major model features identified in almost forty years of applications as very difficult to handle are:
service interruptions and server vacations;
FCFS discipline under non-exponential service times or even exponentially distributed but class-dependent;
non-preemptive priority service disciplines for customers belonging to different classes;
fork and join mechanisms;
service blocking phenomena;
state-dependent routing of circulating customers; and
passive resources and population constrained sub-networks.
To manage these difficulties, approximate solutions for BCMP networks bearing one or more of the above non-standard model features have been proposed. The majority are commonly based upon network decomposition approaches aimed at isolating and analyzing in isolation the non-standard (i.e. non-BCMP) part of the queueing network under a proper representation of the customers arrival process to it. Observe that the basic case of non-standard features occurs with non-exponential service times under the FCFS service discipline. For this and other cases of interest, the so-called Norton theorem for queueing networks (Chandy et al., 1975; Balsamo and Iazeolla, 1982) is at the basis of network decomposition approaches for its capability of returning a flow-equivalent reduction of a given standard (i.e. BCMP) sub-network with a state-dependent server under exponentially distributed service times. Two out of the major successful applications of the flow-equivalent reduction refer to modeling synchronization mechanisms between customers/resources (Heidelberger and Trivedi, 1983; Liu and Perros, 1991; Baynat and Dallery, 2000; Ramakrishnan and Krishnamurthy, 2012) and population constrained sub-networks (Sauer and Chandy, 1981; Baynat and Dallery, 1993; Legato, 1993) where access to the sub-network can be regulated by a finite number of tokens or passive resources. Both of the above features have commonly occurred in computer and manufacturing systems domains, and are now likely to be just as important in the domain of maritime container terminals. For instance, the population constrained sub-network could well capture the representation of the port as a flow equivalent sub-system subjected to a port admission queue for incoming vessels; while the synchronization phenomenon could be useful to represent a transfer vehicle that first retrieves a container from a specific type of equipment (join) and then leaves it to another to stack it (fork).
Recently, interesting new contributions have appeared in the modeling and evaluation of both synchronization phenomena within fork and join mechanisms and population constrained sub-networks. The consolidated idea consists in analyzing one non-standard queueing station or even a non-standard queueing sub-network by “isolating” it under a proper characterization of the arrival process resulting from the remaining part of the original network.
This idea has been pursued by Sonmez et al. (2009) for fork and join queues. They resort to the flow-equivalent reduction of the sub-network complementary to the fork and join queue to subsequently solve the Markov chain underlying the so-reduced original network with state-dependent arrivals to the fork and join station. On the other hand, an alternative representation of arrivals by means of two-moment fixed-rate renewals has been proposed by Satyam and Krishnamurthy (2008), even though, once the queue length of the destination service station equals the size of the population from which arrivals occur to that station, the arrival process shuts down temporarily, as observed by Groessen et al. (2007). Hence, the matter that the arrival process to a destination queue or sub-network could be significantly influenced by the state of the sub-networks from which arrivals originate should receive greater attention.
As for a queueing network with population constrained sub-networks, let us first recall that in this case a special semaphore queue is placed in front of the population constrained sub-network. The semaphore regulates admission by imposing either a unique constraint for all the customer classes or a class-specific constraint to limit the in-process inventory. Here we may distinguish between two cases: Poisson arrivals are assumed for the (open) customer classes, whereas a pure delay infinite-server station with multiple service classes acts as a finite source for all the (closed) customer classes. Both of these modeling choices have been considered for modeling operating systems with multiple virtual memory partitions (Chandy and Sauer, 1978), as well as flexible manufacturing systems with several types of pallets (Solot and Bastos, 1988). To the latter case, besides (Legato, 1993) where the population source is a multiclass pure delay station and therefore the complete queueing network results as a closed one, some other papers have considered the open case under Poisson arrivals to the semaphore queue (Baynat and Dallery, 1996; Buitenhek et al., 2000). More recently, (Jia and Heragu, 2009) have provided a unifying view of previous approaches for population constrained subnetworks under external Poisson arrivals, renamed as semi-open networks. They introduce a basic queueing network made up of two tandem stations, solve its related Markov chain by specializing the consolidated matrix-geometric method and then adopt the flow equivalent approach to reduce general networks to the basic one. The multiclass version of these constrained population networks is covered by adopting the proposal in Baynat and Dallery (1996) for closed queueing networks with non-exponential service times. A few years ago, Satyam et al. (2013) reconsider the well-known approach by Whitt (1983) and investigate possibility of decomposing a closed, rather than open network under class-by-class constraints on the related populations. So, they resort to the renewal process approximation to model the internal flow of customers and capture these processes by evaluating the first and the second moment of the inter-renewals distribution function. The two-moment approximation has lately been adopted by (Roy and de Koster (2018) for modeling unloading and loading operations in port logistics. In the same year, a Markov-modulated Poisson process is proposed by Dhingra et al. (2018) to extend the analysis of a semi-open queueing network to face time-varying (external) truck arrivals at a maritime container terminal.
The discussion up to this point leads us to say that network decomposition into a set of special queueing stations or queueing sub-networks to be analyzed in isolation by resorting to the underlying Markov chain structure is still challenging. The approach deserves greater attention and specialization efforts for effectively supporting design and strategic decisions in a new exciting real domain such as maritime logistics. For this purpose, we claim that considering either a two-moment approximation, under fixed arrival rates, or a state-dependent exponential arrival process to whatever isolated station at hand, cannot be seen as a consolidated and quite “closed” research issue. The main contribution of this paper will be to analyze to what extent a decomposition approximation under fixed or state-dependent arrival rates may be suitable for the approximate analysis of the two queueing network models for port logistics introduced in the next section. Some numerical investigations presented later contribute to establish the suitability of selected approaches to the analytical approximate solution and, therefore, the extent to which they may support design and strategical decisions in port logistics.
3. Queueing network models
The two queueing network models examined in this section refer to the two major logistic processes in a container terminal of pure transshipment: the vessel arrival-departure process (Model 1) and the vehicle round trip process (Model 2). In a companion paper (Legato and Mazza, 2018), these two processes are at the basis of a model-driven DSS designed and solved by simulation for a real transshipment hub.
3.1 The vessel arrival-departure model
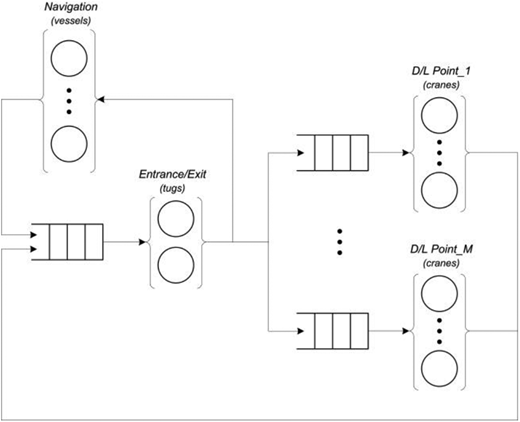
The queueing network for modeling the vessel arrival-departure process in a maritime container terminal is illustrated in Figure 1. The model is developed around the queueing representation of two basic waiting phenomena suffered by vessels: one for vessel admission to the port upon arrival in the roadstead and the other for vessel discharge/loading (D/L) operations once berthed. A pure delay station named “Navigation” station is adopted to capture the finite population of calling vessels as customers of the closed queueing network. Upon arrival, vessels are tugged through the water channel labeled as “Entrance/Exit” station to the appropriate berthing position. Here, in the so-called “D/L Point” stations, container D/L operations are carried out by one or more quay cranes. Once operations are completed, vessels are tugged back to the roadstead through the same “Entrance/Exit” by one or two available tugs.
In this network, a major non-standard modeling feature asking for revised/new approximate analytical solution methods can be highlighted immediately: the typical many-to-one server-to-customer (i.e. multiple cranes to the same vessel) assignment for the container D/L process. This feature is very difficult to cope with, while very challenging for queueing academicians. However, to our knowledge, no successful efforts have been provided yet. Looking deeper into the real situation, every server (crane) that is assigned to the customer (vessel) provides its own service under a different starting time, time length and ending time for that vessel and, while in service, it should also move coordinately to avoid collision and interference with other servers. For the time being, the analytical solution of the queueing network of Model 1 seems to be pursuable only by relaxing the many-to-one assignment of servers to customers and assuming independent parallel cranes, each acting on its own section of the vessel and, therefore, resulting as independent parallel service stations. This stated, we will exploit the possibility of solving the closed model in Figure 1, under non-exponential service times in stations with no limited waiting space and the FCFS discipline, by adopting the two-moment parametric decomposition approximation approach implemented in the queueing network analyzer (Whitt, 1983).
In Whitt’s approach, a queueing network with single-server stations is approximated as a set of individual isolated GI/G/1 queues. The method solves a series of balance equations to approximately match the first and second moments of the arrival and departure processes at each queue. Then, assuming that the arrival process to each queue is a renewal process, performance metrics at each queue are computed using approximation formulas for the GI/G/1 queue. Twelve years later, in (Whitt, 1995) the same author warned researchers on the use of his formula. It should not have been used to compute the second moment of the approximate departure process from a given station without carefully considering the effect of the utilization factor at that station, as well as the factor at the destination station. We are unaware of any significant follow-up to the problems issued by Ward Whitt (personal communication 2013). So with our numerical experiments in a later section we investigate to what extent a two-moment-based characterization, under fixed (average) rates, of both the external customer arrival flow (i.e. vessel flow at the entrance station) and the internal arrival flow of customers (i.e. vessel flow at the D/L points) from one station to another is reasonably accurate and, thus, appropriate.
3.2 The vehicle round trip model
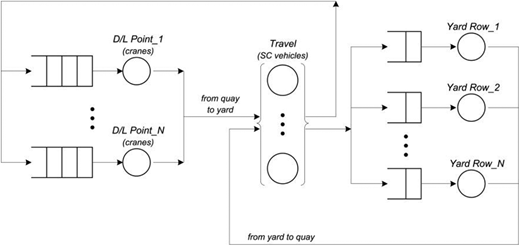
The queueing network for modeling the vehicle round trip process in a maritime container terminal of pure transshipment is illustrated in Figure 2. In this terminal, shuttle vehicles called straddle carriers (SCs) are assumed to perform both container transfer between the quay and the yard and handling operations on both the quay and yard storage area. According to the current practice in the maritime container terminals of our interest (www1.eurogate.de/en/EUROGATE/Terminals), the yard is organized in blocks of containers, each divided into rows that reach at the most three containers of height.
The model is developed around the queueing representation of a finite number of SCs that travel back and forth between the “D/L Point” stations on the quay and the “Yard Row” stations on the yard. In the former, service consists in container discharge/loading from/on vessels by quay crane-servers; in the latter, it consists in container stacking/retrieval performed by SCs when they pass through their target yard row-servers. SCs pick up containers from a “D/L Point” or “Yard Row” station and choose a path within the so-called “Travel” station to set the containers down in the corresponding destination station. This flow of SCs between the quay and the yard affects the throughput of the pure delay “Travel” station adopted to represent the travel time of any given SC. The fleet of circulating SCs corresponds to the customer population and, therefore, the queueing network model for the vehicle round trip process is a closed one.
Observe that using a pure delay station to capture travel times clearly obliges the modeler to first assume independence among servers at the pure delay station (i.e. no interference among circulating vehicles) and then conduct a preliminary evaluation of the related traffic conditions along the internal reticular paths chosen by the vehicle driver within the typical Manhattan-like layout of the storage blocks in the yard. In other words, adequate input data for setting the pure travel time as a delay at the corresponding station is required before running the model. This setting is required every time the number of vehicles circulating in the yard changes. In our experience, the terminal’s operations manager pays special attention in fixing the number of circulating vehicles, as well as the yard areas they must cover simultaneously to limit not only congestion, but also conflicts among vehicles. In particular, for security reasons, the access to a yard row can be locked by the simultaneous presence of another SC that is carrying out its own container stacking/retrieval operations in an adjacent row. To our knowledge, no analytical approximations from the queueing literature are available to quantify the above locking phenomenon. On the other hand, neglecting this phenomenon and calculating an upper bound for the real (average) system throughput together with a lower bound for the (average) queue lengths remains a valuable outcome for the fast approximate analysis of the queueing network in Figure 2. So, we will focus on the approximate analysis of a non-exponential closed queueing network with a single class of customers under random routing among stations with no limited waiting space and the FCFS discipline.
This could be accomplished by resorting to a decomposition procedure based on (Marie, 1979; Yao and Buzacott, 1986; Akyildiz and Sieber, 1988) for an accurate approximate analysis. The procedure, later referred to as state-dependent exponential decomposition (SDED), is based on the following two assumptions for each station of the closed network:
an artificial arrivals flow process exists – as a state-dependent pure birth process (SDPB) with rate λ(n), n = 1.N, where N is the network population – which is equivalent to the true arrival process – state-dependent non-renewal (SDNR) – offered to the same station by the complementary sub-network; and
an artificial services flow process exists – as a state-dependent pure death process (SDPD) with rate µ(n), n = 1.N, where N is the network population – which is equivalent to the true service process realized by the same station in the original network.
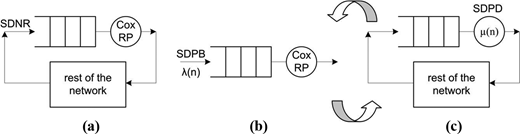
The iterative procedure is illustrated in Figure 3 and is summarized as follows. The non-exponential station (i.e. the Cox-distributed renewal service process) in the original network (a in Figure 3) is first solved in isolation under state-dependent arrivals (b in Figure 3) that should reproduce internal arrivals supplied by the rest of the network. It is then replaced by a flow-equivalent exponential station (c in Figure 3), so the closed queueing network at hand can be solved by the MVA algorithm for BCMP networks. The iterative refinement of the artificial exponential station within the network is achieved through the iterative refinement of the state-dependent exponential arrival rate λ(n) for the non-exponential, but isolated, service station. This is accomplished by a fixed-point procedure whose convergence is not formally stated. Observe that the initial value of λ(n) is obtained by short-circuiting the non-exponential station in the original network (a in Figure 3) and computing the related throughput rate.
Figure 3.The SDED procedure
4. Numerical experiments
In this section, we first focus on the queueing network in Figure 1 (Model 1) featuring two non-exponential single-server D/L stations under the FCFS discipline. The goal is to evaluate the possibility of solving it as an open queueing network under non-exponential services and renewal inter-arrivals at each station, according to the two-moment decomposition method. Then we move to the queueing network in Figure 2 (Model 2) featuring two non-exponential single-server D/L stations under the FCFS discipline, a pure delay station with normally distributed delays and four exponential single-server Yard Row stations under the FCFS discipline. The goal is to evaluate the possibility of solving it according to the previously described one-moment state-dependent decomposition method SDED.
The rationale of facing the non-exponential features in two different closed queueing networks with two alternative methods can be explained as follows. The two-moment fixed-rate decomposition method, featuring the possibility of describing non-exponential inter-arrivals, seems more appealing when related to Model 1. This because, in normal operating conditions, arrivals generated by the fixed population of independent calling vessels at the Navigation station are not expected to be affected to a great extent by the number of vessels already in the actual port system (Entrance/Exit station and D/L Points). So, the resulting arrivals could be well described by a fixed-rate flow by further using the second moment of inter-arrivals. Vice versa, the closed queueing network in Model 2 acts as a closed loop system where the cycling customers correspond to the relatively limited number of vehicles allocated to the round trip process being modeled. Hence, interactions between the two different sub-systems (D/L Points and Yard Rows) of the whole queueing network are expected to be better captured by state-dependent inter-arrivals.
For sake of completeness, let’s remark that in the analytical solution of both of the above study cases, the operational management of incoming entities, whether they be vessels or internal vehicles, excludes any non-random assignment policy of to-be-berthed vessels to D/L points, as well as internal transfer vehicles to pairs of pick-up and set-down points. The approximate analytical results are compared against discrete-event simulation of the respective queueing networks.
4.1 Numerical experiments for Model 1
For illustrative purposes, a network with just two D/L points supplied by the same finite-source (i.e. pure delay) station is considered in the first set of numerical experiments. On the basis of two given population levels of calling vessels belonging to a shipping line – one small (8 vessels every 72 hours) and the other large (32 vessels every 72 hours) – we are interested in an accurate estimate of the average queue lengths at a couple of D/L Points. Vessels are only serviced by one of the D/L Points, according to the FCFS discipline. Different average service times are set in different scenarios to verify whether or not the approximate analytical solution holds in different operating conditions, i.e. low or high utilization of D/L Points.
The complete summary of the data setting is given in Table I. Precisely, according to real data in our possession, we assume that the first D/L Point is subjected to a significant service time variability and use a hyper-exponential distribution (coefficient of variation CV > 1) to model it. Then, for purposes of comparison, we model the second D/L Point with a hypo-exponential distribution (CV < 1) to represent the possibility (target condition) of more regular service times with the same average duration. Inter-arrivals and inter-departure processes are approximated as renewal processes and characterized by a mean and coefficient of variation. Our aim is to verify to what extent Whitt’s formula (Whitt, 1983) for queue length evaluation is reliable. Clearly, owing to the simplicity of the network topology there is no need to set-up any procedure for computing average internal arrival rates to the D/L points at hand.
In the first set of experiments, simulated queue lengths (Sim. in Table II) are compared to approximated ones by Whitt’s analytical formula (An. Whitt in Table II), under both bottleneck (case a with a 0.99 utilization factor) and non-bottleneck (case b with a 0.39 utilization factor) conditions assumed to occur at the Entrance/Exit station.
In the second set of experiments, further comparisons are carried out between simulation (Sim. in Table IV), Whitt’s formula (An. Whitt in Table IV) and the original closed queueing model with exponential service times (An. EXP in Table IV), therefore solved by the MVA algorithm. Experiments are performed under balanced-intermediate utilization (case c with a 0.65 utilization factor) and balanced-high utilization (case d with a 0.95 utilization factor) of the two D/L points, as summarized in Table III. In these cases, we properly set the input parameters to obtain 0.65 and 0.50 as resulting utilization factors at the Entrance/Exit station. This setting avoids both the quasi short-circuit effect at the Entrance/Exit station (occurring at low utilization levels) and the quasi Poisson renewal departures from the same Entrance/Exit station (occurring at high utilization levels).
The sample results reported in Tables II and IV show that Whitt’s formula may be considered reliable when applied to stations under a rather low utilization factor and rather deterministic (hypo-exponential) service distribution shapes. So, Whitt’s approximation seems to well suit container terminal facilities bearing automated services with negligible interruptions, manual interventions and so on.
Observe that in Table IV the column “An. Whitt” has been intentionally omitted in the Queue Length (d) case, owing to its very poor performance. Taking a deeper look here, results on Queue Length point out that as the utilization factor of any station to be analyzed in isolation increases, then the shape of the service distribution, as accounted by its first two moments, becomes less important. In this case, the one-moment approximation could simply be adopted in a closed queueing model, thus resorting to the classical MVA.
To complete our analysis on Whitt’s approximation, we have also considered the popular open approximation formulas available from literature to evaluate the Number In (N) as a function of the Utilization (U) and the CV of both the arrivals and services (CA and CS, respectively) as summarized here:
due to (Gelenbe, 1975 and Mitzlaff, 1997);
due to (Whitt, 1983);
due to (Kouvatsos and Almond, 1988).
To our knowledge, no similar comparisons on a two-moment based approximate analysis of basic queueing stations in isolation are available in literature. Hence, experiments have been carried out under the input data summarized in Table V.
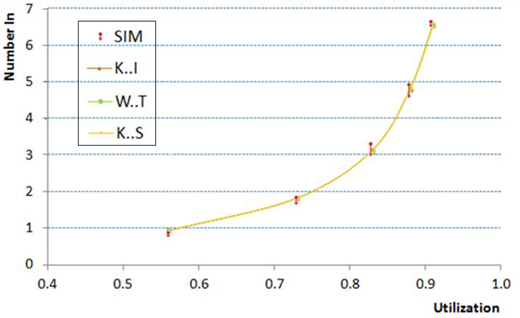
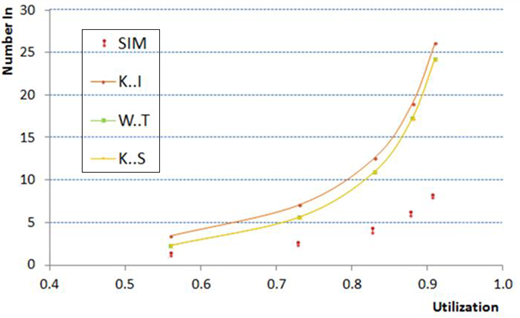
For each of the above formulas, respectively referred to as [K.I], [W.T], [K.S], we easily found values of CA that return estimates of the “Number In”. These values are indistinguishable, yet all contained in the 90 per cent confidence intervals computed via simulation for D/L Point_2, as one may recognize from Figure 4. Unfortunately, neither the above, nor other values of CA can be found to provide a satisfactory matching for D/L Point_1, as shown in Figure 5. Here the estimates of the “Number In” are still quite close from one another, yet all outside the 90 per cent confidence intervals computed via simulation. On the other hand, the common Entrance/Exit station that supplies both of the D/L Points with its departure flow does not allow us to fix different values for the CV of the same flow under a Bernoulli mechanism of flow decomposition.
Our conclusion is that all the open formulas evaluated perform in a quite indistinguishable way under hypo-exponential services and in very good agreement with simulation results (90 per cent confidence intervals). But the same formulas exhibit an unsatisfactory performance when applied to hyper-exponential service stations. In the domain of port logistics high variability of services could be expected, especially with human-operated resources in low-automated facilities.
4.2 Numerical experiments for Model 2
The accuracy of the approximate analytical solution of Model 2 through the previously described one-moment state-dependent decomposition method SDED is now investigated. To this end, we set the number of service stations and the service distribution features as follows: two (identical) non-exponential single-server D/L Points under the FCFS discipline, a pure delay station with normally distributed delays and four (identical) exponential single-server Yard Row stations under the FCFS discipline. According to the CV (ranging from 1.5 to 2.0) estimated from real data on services at D/L Points, a hyper-exponential distribution (defined by a Cox-2 distribution) is appropriate to capture the significant variability on service times mainly caused by unscheduled equipment interruptions. As for service times at the Yard Row stations, an exponential shape is chosen with average value (2 min) corresponding to the average time spent by any given SC when driving through a yard row and performing container handling operations in a target storage slot. As for the pure delay station modeling the pure travel time of the SCs, we are well confident that, under the traffic conditions we have experienced at a real container terminal, a normal distribution with mean 5 min and standard deviation 1 is reasonable for the fleet of our interest: 12 man-guided SCs. The realistic setting of the remaining input data pertains to the average service time at each D/L station: it ranges from 2 to 4 min. When used in our numerical experiments, the overall data setting also accounts for the normal operating conditions. In our experience: the utilization level of any yard row ranges in the order of 20-30 per cent, which intends to prevent the locking phenomenon from becoming significant; vice versa, the utilization level at any D/L Point should range in the order of 60-80 per cent, which intends to prevent the lack of straddle carriers beneath the crane-server that would lead to crane starvation.
The effectiveness of managing hyper-exponential services at D/L Points by the SDED iterative solution procedure is investigated for the four instances whose settings have been described above. Convergence has been reached within a few iterations. Numerical results on throughput, queue length and utilization for each station are reported in Tables VI-IX and compared with the 90 per cent interval estimates returned by multiple simulation runs of Model 2. The SDED results for the queue length deviate from the corresponding interval estimates as soon as the value of the coefficient of variation goes from 1.5 to 2. However, the deviation is in the order of 10-15 per cent which, from a practical point of view, still provides a first-level approximation in supporting new designs and managerial decisions. So, we may consider these results encouraging: acceptable results can be achieved by using the SDED procedure to solve a closed model under non-exponential service times under the FCFS discipline.
As for a final remark on the SDED methodology, observe that dealing with a multi-class population of customers could be interesting given the possibility of clustering the fleet of SCs into separate groups dedicated to different origin-destination pairs. However, extending the SDED procedure to multiple classes of customers is prevented by the computational cost of both the underlying multiclass MVA and the Markov chain based analysis of the non-exponential station in isolation. Nevertheless, we are confident that resorting to class aggregation followed by decomposition, even under an iterative fixed-point procedure such as the ones proposed in (Legato, 1993; Baynat and Dallery, 1996; Satyam et al., 2013), could be effective and, thus, worthy of further investigation.
5. Conclusions
The analytical approximate solution of closed queueing networks devoted to modeling logistic processes in maritime container terminals has proven to be worthy of renewed research efforts. The main issue focused in this paper is the effectiveness of using two alternative approaches. The first is a constant-rate two-moment decomposition approach within a fixed-point iteration procedure aimed at returning an “equivalent”, but open network. The second is a one-moment state-dependent rate approach within a fixed-point iteration procedure aimed at returning an “equivalent”, but closed network. Both approaches share the common idea of managing non product form features detected in the original queueing network by capturing these features in an “isolated” artificial station, which is then amenable to be solved by the underlying Markov chain. To support our discussion, a sample of encouraging numerical results has been obtained with respect to two general closed queueing network models that may cover the two main logistic processes in a pure transshipment maritime terminal. Our investigations on closed networks with a single class of customers lead to the following conclusions. The two-moment based approximation is surely appropriate for evaluating system oriented performance measures under rather deterministic service distributions (i.e. CV < 1) and low-to-intermediate (server) utilization factors (i.e. from 30 to 60 per cent). The SDED approach may also have a good accuracy in evaluating user-oriented performance measures, under rather variable service distributions (i.e. CV > 1) and an intermediate-to-high (server) utilization factor (i.e. from 60 to 90 per cent). Finally, it is quite evident that both the above approaches have to resort to class aggregation techniques (i.e. many-to-one or many-to-two) to cope with the practical solution of multi-class open or closed queueing networks.