The purpose of this study is to explore the impact of CO2 emissions produced by container trailer operations on the climate-warming environment and to calculate the different operating modes of cross-port trailers at container terminals.
This article employs integrated methodologies, including the carbon footprint (CF) calculation method and gray relational analysis. The “CF calculation method” primarily utilizes an export container operating trailer to transport containers from the container terminal based on an activity-based approach. “Gray relational analysis” mainly compares two traditional container terminal modes based on the operational efficiency assessment criteria.
The improvement of container trailer operational efficiency is related to factors such as transportation distance, speed limit, road conditions, loading conditions and operating efficiency and other factors.
We analyzed the overall performance of the two container yard operation modes through a gray relational analysis of three key factors: operation time, energy cost and carbon emissions. The gray correlation ranking order is TT> RT.
From the perspective of CF, we can understand which operating modes can better meet the requirements of green port operations and provide improvement suggestions for achieving energy conservation and carbon-reduction targets.
The empirical examination revealed that using enterprise ERP, big data, 5G and artificial intelligence algorithms can enhance the operating efficiency of container trailers and improve energy-saving and carbon-reduction outcomes.
The empirical findings provide energy-saving and carbon-reducing green transportation logistics operation alternatives and countermeasures for areas or operating models with higher carbon emissions, which can serve as a reference for future container terminals, trailer companies and government authorities.
1. Introduction
1.1 Research motivation
The shipping industry is one of the significant sources of greenhouse gas (GHG) emissions, accounting for 3.9% of global CO2 emissions (1.26 billion tonnes of CO2). Among all GHGs, CO2 emissions account for more than 99% of the total GHG emissions from various port operations, so this study explicitly involves CO2 emissions (Chowhan et al., 2012). The transportation sector relies most on fossil fuels, accounting for 37% of CO2 emissions. Maritime transport emits about 940 million tons of CO2 yearly, accounting for about 3% of global emissions. A significant increase in global shipping activity has exacerbated the production of toxic pollutants. In recent years, shipping emissions have received heightened attention in developed countries due to global climate change. In developing countries, researchers are making considerable efforts to solve this catastrophic and urgent problem (Hussain et al., 2022).
International Association of Ports and Harbors (2010) believes that many GHGs have been confirmed to impact global climate change. Among them, the GHGs related to port operations mainly include CO2, methane (CH4) and nitrogen dioxide (NO2). As a logistics and transshipment center, the international commercial port gathers not only various forms of transportation but also a variety of industrial and logistics activities. These activities will cause exhaust emissions, such as CO2, NOx, SO2 and PM. Regarding air quality and control, the role of ports can be divided into two parts. The first part is local air quality control, which may focus on reducing PM, NOx and sulfur because they threaten human health. The second part is about the effects of GHG (CO2) emissions on global climate change (Zhang et al., 2000).
Regarding the sources of GHG emissions in the port area, according to the World Ports Climate Initiative (WPCI) in 2010 guidelines, the port area is mainly divided into three categories:
Scope 1: Port direct source. These emission sources are under the direct control and operation of the port authority and include port-owned fleet vehicles, vehicles owned or leased by the port authority, buildings (e.g. boilers, furnaces, etc.), port-owned and operated cargo handling equipment, port management and any other emission source owned and operated by the agency.
Scope 2: Port indirect sources. These sources include electricity purchased for buildings and operations owned by the port administration. Tenants' electricity and energy purchases are not included.
Scope 3: Other indirect sources. These sources generally relate to tenant operations, including ships, trucks, cargo handling equipment, railroad locomotives, port vessels, tenant buildings, tenant-purchased electricity and commuting (trains, private cars, public transportation, etc.) for Port Authority and tenant employees.
The International Maritime Organization's (IMO) ambitious goal of reaching net zero by 2050 is well known in the industry, and the IMO Greenhouse Gas Strategy 2023 sets out two indicative checkpoints that IMO will use to measure the likelihood of success. Compared with 2008, total annual GHG emissions from international shipping will be reduced by at least 20% by 2030, and efforts will be made to reduce it by 30%. Compared with 2008, annual GHG emissions from international shipping will be reduced by at least 70% by 2040, and efforts will be made to reduce them by 80%. The European Parliament has approved legislation requiring nearly all newly sold trucks to be zero-emissions by 2040. According to the guidance, manufacturers must gradually reduce the average emissions of new trucks, with a target of 45% reduction by 2030, 65% reduction by 2035 and 90% reduction by 2040. Transport and Environment predicts that EU targets will result in about 31% of new trucks and buses sold in 2030 being zero-emissions, rising to 77% by 2040. By 2040, 30% of heavy-duty vehicles in Europe are expected to be zero-emissions (Transport and Environment, 2024). Trailer GHG emissions belong to Category 3 mobile sources. How to save energy and reduce carbon emissions to meet the goals of green ports has become an important research topic.
1.2 Research purpose
The shipping industry produces approximately 1,260 million tons of CO2 emissions, accounting for approximately 3.9% of global carbon emissions, making it an important source of CO2 emissions (Jurong Port, 2011). Levelton Consultants’ (2006) research affirms that from the container terminal supply service chain, ships are the main source of exhaust emissions, accounting for 62% of fine particulate matter (PM2.5) emissions, 60% of nitrogen oxides (NOx), 92% of sulfur oxides (SOX) and 50% of CO2 emissions from a typical container. Cargo handling equipment is the largest future source of emissions, emitting 31% of particulate matter, 22% of nitrogen oxides and 36% of CO2.
IAPH (2010) believes that one of the policy decisions made in the carbon footprint (CF) planning process mainly depends on the detailed level of data obtained. Therefore, the activity-based approach can be used to calculate CF emissions using detailed original data. Liao et al. (2010) believe that the activity-based emission model usually uses CO2 emissions from container transportation. Jurong Port (2011) also affirmed that the activity-based method uses detailed and actual data sources and can better reflect the current situation of the port industry.
Wiedmann and Minx (2007) argued that there are clear differences between the “CF” used by the general public and academic circles and proposed a scientific definition based on accepted accounting principles and modeling methods. A CF is the amount of gas emissions related to climate change and human production or consumption activities; however, there is no consensus on how to measure or quantify it.
CF is a measure of CO2 emissions from burning fossil fuels. In the case of business organizations, it is the result of daily operations, direct or indirect emissions of CO2. This may also reflect the products or commodities representing fossil energy that reach the market (Grubb and Ellis, 2007). A “CF” is the total amount of CO2 and other GHGs emitted over the entire life cycle of a process or product. It can be expressed as one gram of CO2 equivalent per kilowatt-hour of electricity generation (gCO2eq/kWh), producing other GHGs that have different impacts on global warming (Parliamentary Office of Science and Technology, POST, 2006).
Chowhan et al. (2012) considered trailers to be the second largest source of SCOPE 1 emissions. Using LNG tanks in trailers can reduce carbon emissions by up to 24.26%. Liao et al. (2009) advocated a calculation formula for the CO2 emissions of container trailers and adopted an activity-based method to estimate these emissions. Chen et al. (2013) proposed a queuing-based bi-objective model to optimize truck arrival patterns to reduce truck emissions at container terminals in a low-carbon economy. Ierland et al. (2000) considered the number of import and export containers in the hinterlands to compare CO2 emissions from trucking and intermodal transport.
Container terminals serve as pivotal nodes in global trade, facilitating seamless cargo transfers across maritime, land and inland transport networks (Xiang et al., 2025). Their operational efficiency profoundly influences the speed and cost-effectiveness of global supply chains (Xiang et al., 2024). Okşaş (2023) took Turkey's Anbari Container Port as a case. The activity-based method was used to estimate the carbon emissions of the vehicles in the port. The carbon emission value per TEU in 2021 was calculated as 0.011335 tCO2e/TEU. Kim et al. (2004) advocated the assumption that container trailers generate 0.3864 kg CO2/TEU over a distance of 4 km between the container terminal yard and the port hinterland.
This paper uses the CF analysis method based on the data provided by the container trailer company and the terminal operating company at Kaohsiung Port. It is combined according to the different operating modes of the container terminal, which is divided into gate station operation mode (manual operation mode), container yard operation modes (TT and RT), gantry crane operation modes (single lift operation, double lift 20-foot containers), external trailer (ET) operation (including operation time (referring to the gate area to the container yard area) and idle time (gate area and container yard area) and internal trailer (IT) operation (including operation time (referring to the container yard area to the berth area) and idle time (container yard area and berth area). The paper aims to calculate the overall carbon emissions of the ET and IT from the perspective of CF.
Deng (1992) first proposed gray theory analysis, which mainly aimed at the uncertainty and incomplete information in the system, to conduct relational analysis and model construction within the system and to use prediction and decision-making methods to explore and understand the architectural relationships within the system. Zhang et al. (2000) argued that statistical and probabilistic methods are traditionally used to analyze large amounts of data; however, such data are often difficult to obtain and the available information is limited (poor information). Therefore, gray theory can be applied to poor information processing.
Secondly, another method uses gray relational analysis to identify the IT and ET operation areas with higher carbon emissions based on the CF method, which employs expert questionnaires to analyze the problem and calculates the relative ranking of the operational values through gray relational analysis.
The growth of maritime container trade volume and the frequent berthing of ships require container terminals to shorten the ship turnaround time. As the main production tool of container terminal, the reasonable allocation of equipment resources is conducive to minimizing the ship turnaround time and the operating cost of container terminal (Tang et al., 2026; Li et al., 2025) claimed that recent studies mainly use simulation tools to evaluate the performance of different handling systems, apply optimization models to obtain optimal equipment configurations and utilize optimization theory, queuing theory and simulation-based optimization methods to optimize operational processes in both traditional and automated terminals.
Yang (2017) conducted a CF analysis and a gray relational analysis to calculate the green operating performance between two traditional container terminals. A CF analysis was used to calculate CO2 emissions per container for two different container terminal operating models, using data from various areas collected from shipping companies or terminal operating companies at the port of Kaohsiung. Gray relational analysis is then used to determine the ranking order of different container terminal operating models based on the green port assessment criteria of working time efficiency, energy consumption and CO2 emissions.
The paper adopted similar approaches to CF analysis and gray relational analysis from the Yang (2017) paper; previous research computed the green operation efficiency between two traditional container terminals using various container-handling equipment and trailers. The paper harvested the academic and practical contributions. In terms of academic contributions, the paper found that improvements in container trailer operational efficiency are related to factors such as transportation distance, speed limit, road and loading conditions and operating efficiency.
In terms of practical contribution, this paper focused on the comparison of green operation efficiency for container trailers, including inside trailers and outside trailers, between two different traditional container terminals. The empirical findings provide energy-saving and carbon-reducing green transportation logistics operation alternatives and countermeasures for areas or operating models with higher carbon emissions, serving as a reference for future container terminals, trailer companies and government authorities.
The empirical findings offer energy-saving and carbon-reducing alternatives and countermeasures for green transportation logistics operations in areas or models with higher carbon emissions, serving as a reference for future container terminals, trailer companies and governments to plan and construct green container terminal operating models. Therefore, the issues that this paper aims to explore are generally the following points:
Use literature review to highlight the current development status of container trailers at the port of Kaohsiung, including container trailer operation modes, and container trailer problems and countermeasures.
Analyze the advantages and disadvantages of carbon emissions of container trailers operating at two container terminals from the perspective of CF.
Use gray relational analysis to compute the ranking of energy-saving and carbon-reducing countermeasures for container trailers operating at two container terminals.
Provide container trailer companies, terminal operating companies and the government with formulating response strategies for energy conservation and carbon reduction.
2. Literature review
2.1 Container trailer carbon footprint literature
As the interface between sea and land transportation, ports play an essential role in the international logistics chain. Therefore, the essential functions of port logistics include transportation and cargo transshipment services in the port and further provide transportation and warehousing, circulation processing, information processing and other integrated logistics services (Xie and Lin, 2014); efficient logistics activities will help the overall international trade go more smoothly.
In the maritime industry, container and bulk cargo transportation differ not only at sea but also in the way their road transportation operations are conducted. Due to the considerable differences in government regulations and business nature, truck container freight and bulk cargo have begun to separate. Container freight has statutory business items, and trade association organizations gradually changed to operate independently under the name of the “truck container freight industry.”
The container freight industry can be divided into four operating processes and service types, which are briefly described as follows (Yang et al., 2016):
Shipside operations: It is a dockside operation process, which refers to the loading and unloading containers during transportation between terminals and container yards. Work with the loading and unloading equipment used to transport containers from ships to container terminals or move containers from container terminals to ships for loading. The primary sources of customers are shipping companies, which are large scale and usually have specific service companies working for them.
Container moving operation: It refers to the transportation operation of containers between terminals. It operates within the port and moves the containers from the terminal to the following designated terminal for re-export or transshipment. The primary sources of customers are shipping companies, which are large in scale, few in number and highly competitive.
Transshipment operations: It refers to the hauling of containers at ports such as Keelung Port, Taichung Port and Kaohsiung Port or the hauling of containers to and from container terminals in commercial port areas. The primary sources of customers are shipping companies. The business volume is large, but the number of companies is negligible. There are usually specific service companies.
CY (Container Yard) container transportation operations: It is a transportation operation between the client and the port, traveling between the client's factory or warehouse and consigning import and export cargo containers to the port, container distribution center or client. Due to the large number of customers and complex customer industries, CY container transportation operations are also relatively complicated and trivial. The customers are factories or warehouses, which are small in scale and large in number, resulting in fierce competition and an almost perfectly competitive market.
The so-called CF refers to the amount of CO2 and other GHGs emitted throughout the entire life cycle of a process or product (UK POST, 2006). CF is quantified using indicators such as global warming potential, representing the amount of GHGs contributing to global warming and climate change. CF is defined on a land basis, and CF represents the land area required to sequester CO2 emissions from atmospheric fossil fuels through afforestation (De Benedetto and Klemes, 2009).
Wiedmann and Minx (2007) believe that CF is a measure of the total amount of CO2 emissions caused directly or indirectly by an activity or a product during the accumulation life stage, including individuals, groups, governments, enterprises, organizations, processes, industrial sectors, etc. The total amount of CO2 is physically measured in mass units (kilograms, tons, etc.), so conversion to area units (hectares, square meters, square kilometers, etc.) is impossible.
The CF calculation measures the CO2 emissions from production sites, company-owned vehicles, business travel and waste to landfill (BP, 2007). A method to estimate a product's carbon equivalent GHG over its entire life cycle, from the production of raw materials used in the production process to the sale of the final product (excluding emissions from use).
The trailers idling in the container yard will not only cause low container yard turnover efficiency, lower overall container yard operating efficiency, waste waiting time and energy consumption for trailers but also increase CO2 emissions. Therefore, some scholars have provided solutions to solve the problem of idle trailers. For example, Chen et al. (2013) proposed the ship-dependence time zone. They believed that waiting for trailers at the gate station for a long time would reduce the container terminal's efficiency and produce severe air pollution. The author uses the vessel-dependent time window method to control the arrival time of trailers at the container yard and solve the congestion problem at the gate station. Giuliano and O'Brien (2007) believe that container yards, highway traffic jams, client delays and other factors are the main causes of trailer delays.
Zhao and Goodchild (2010) used a heuristic algorithm to evaluate trailer arrival time information to reduce container processing time for import containers and improve container yard operational efficiency. Sharif et al. (2011) used the EI Faro model to analyze the problem of trailers waiting idle at container terminal control stations. The authors believe that if a trailer dispatch station can be set up and the trailers are brought according to the time provided by the container site, the control of trailers at the container terminal can be reduced – gate station traffic jam.
Gao et al. (2010) quoted Bender's decomposition basis method to analyze the scheduling problems of terminal trailers and container terminal equipment and improve the efficiency of container yard operations. Van Duin and Geerlings (2011) argue that this article uses a quantitative analysis of port operation energy consumption and related CO2 emissions. This study provides insights into port container handling and transshipment processes and calculates the contribution of these processes to CO2 emissions. Chen et al. (2013) used a three-stage algorithm to analyze the interaction between gantry crane and trailer transportation. They found that the simultaneous allocation of different ships to the trailer group can reduce the situation of empty trailers. Lai et al. (2013) referred to the Clarke and Wright algorithm to analyze the optimal route planning for trailers to transport containers from the port area to the importer or exporter to transport the containers to the port area. Nossack and Pesch (2013) used the time window problem generated by all deliveries, pick-ups and return containers and introduced a two-stage heuristic solution to analyze the vehicle sequencing problem of trailers in composite transportation.
Karakas and Kocaoglu (2021) based on multistage solutions, including discrete simulations, integer linear programming and multi-objective optimization methods. The multi-objective optimization method is used, combined with the importance weight obtained by AHP analysis. Handle yard allocation and internal transportation issues in a way that establishes an optimal trade-off between internal truck movement times and environmental goals. The uncertainty caused by irregular vehicle queues at the yard or gantry crane area was successfully solved. The opinions of managers involved in decisions regarding the “time environment dilemma” are weighted and included in the optimization model. Karakas et al. (2021) claimed that internal truck time efficiency could be improved by 27.8%–42.8%, and CO2 emissions could be reduced by 30.1%–70.3% across five scenarios.
According to Tian (2015), container truck transportation operations can be classified into container transfer operations within the port area, interport transshipment container operations and import and export entire container cargo transportation operations (refer to Table 1). This article mainly focuses on entire container transportation operations, and the trailers are divided into ITs at the container yard and ETs outside the container yard. The calculation is mainly based on the CO2 emissions generated during the export of the entire container. The ET operation refers to the “import and export full container cargo transportation operation.” The exporter entrusts the ET to transport the entire container from the exporter's factory near the port to the two designated container ports (containers using TT and RT truck operation modes, respectively; IT operations refer to container moving operations within the port area; the IT transports containers from the container yard to the ship's berth area to wait for shipment.
Therefore, this paper's scope of container trailer operations is a comparative analysis of the operational efficiencies of TT and RT operation modes, mainly based on the operational benefits of external and ITs entering and exiting the container terminal. The operational efficiencies include container trailer operation time, energy costs and carbon emissions.
Port container terminals include many logistic activities, transportation equipment, various related industries and supply chain activities (Yang, 2017). Logistics activities are an efficient and vital link in international trade. Logistics activities will help smoothen the overall flow of international trade. As Taiwan's most prosperous international container port, Kaohsiung Port is a significant indicator of Taiwan's container transportation. According to research by Chen (2016), when container trucks are at various container terminals in Kaohsiung Port, more than half of the time is spent waiting instead of operating, which means that there is still much room for improvement in the logistics level of the port area, which has lowered overall operational efficiency. It is time-consuming. It was found that 50%–90% of idle time comes from waiting for the gate to operate. The stagnation time before entering the terminal control point is the most severe link that affects the trailer logistics of the entire port area.
With the development of the Internet of Things and the mature application of logistics information technology, the logistics information platform of the Internet of Things has become a vital development link. The port information platform supports logistics companies' information systems by collecting, analyzing and processing public information at ports. It collects a large amount of primary data, processes it and provides information for container trailer operators and container yard operators.
2.2 Problems with container trailer operation
In order to explore the problems faced by external and ITs in transportation operations, we interviewed container trailer operators in the Kaohsiung area from June to July 2024. One expert was the general manager of an ET company, and another expert was the general manager of an IT company providing outsourced service for dedicated container terminals in the Kaohsiung area and gave a brief explanation of the problems encountered by container trailers:
Problem of APP diversification: Cargo owners have their own apps, and container terminal and trailer companies also have apps that need to be integrated. However, many problems will be encountered during the integration process, such as network, program and field problems. Countermeasures: We need to integrate the truck company APP and the cargo owner APP and submit the information to the terminal so that trailer drivers can find the container in advance to alleviate waiting time.
Trailer waiting time problem: Trailer waiting time can be attributed to several reasons, including that the driver waits for the gate station, the driver waits or picks up the container, the trailers queue up at the hanging container at the dock, waiting to enter the gate station of the container terminal, customers are loading and waiting nearby and the trailers are stuck on the road.
Traffic congestion problem: Reasons for traffic congestion in the container terminal: (1) Operation efficiency of the terminal (2) Operation efficiency of the container yard (3) Container handling efficiency in a cargo owner's factory. Additional reasons for the low operating efficiency of the container terminal: (1) Slow crane movement, (2) Poor movement traffic lines, (3) The site needs to be bigger and (4) There are too many containers stored in the container terminal.
Problems with electric vehicles: Reasons: (1) Insufficient battery life: If the battery life is relatively short, you can do short-distance transportation. On average, if you want to do long-distance transportation, on average, you have to run at least 400 to 500 km a day for long-distance transportation. If you do not have enough battery life, it cannot operate. Then there is still time for charging, and if you find a charging pile and build it yourself at the venue, it is better. (2) Charging stand settings: There is a charging time, and if you find the charging stand and build it yourself at the site, it is better. However, you need to set it up, and you need a lot. If you have 10 cars being used today and need to be charged together, you must use so much power. (3) Efficiency of charging stands: The calorific value is much different from that of ordinary small cars. If you want to charge quickly, you must have a high voltage, but you need such large power equipment.
Carbon tax and inventory problems: Reasons for carbon tax and inventory: (1) Carbon inventory is required first, and carbon rights must be standardized. (2) The government's method for calculating CF is to first look at how much carbon emissions are used and then how much green energy is used. If the green energy is not enough, our company needs to levy a carbon tax or sell carbon rights to other companies.
Operating cost problems: The impact of rising fuel prices, workforce, vehicles and equipment. Countermeasures: (1) Adjust freight costs 2 – cost assessment. For example, rising fuel prices, workforce, vehicles and equipment can only affect freight if we are all fuel costs; if it rises to a certain level, freight will be adjusted. There is also the first cost consideration, many of which are competing; that is, everyone will see who can survive, and then if you cannot hold on, you may be eliminated.
Schedule dispatching system: The present system still uses a manual schedule method. The driver's dispatching and receiving work order can be done automatically using the app, but the dispatching decision of which container terminal the driver should be sent to still needs to be done by humans.
Information system problem: When the computer company modified the program, the orders were messed up and the entire salary calculation record had to be redone. Problems with the network, the program and its formats differ from those written by the information system.
3. Research methods
3.1 Carbon footprint calculation method
The CF calculation formulas recently collected for container terminals can be roughly divided into the overall CF calculation formula of the container terminal equipment and trailer carbon emission calculation formula in the following:
CEFIC (2011) adopts the activity-based approach using the following formula:
If calculated using the fuel consumption
Jurong Port (2011) believes that the general formula for calculating CO2 emissions is Emissions = energy or fuel consumption (kWh, liter, or tons) x emission coefficient (kg CO2e/kWh, kg CO2e/liter or kg CO2e/ton).
The estimation method for emission calculations follows the general form of the vehicle emission estimation equation (Vanek et al., 2014):
Driving emissions are estimated from driving speed and distance and are expressed in grams per mile (g/mi). Idle emissions are expressed in grams per hour (g/hr) and are estimated with the engine idling when the vehicle is stationary (Starcrest Consulting Group and LLC, 2020).
Liao et al. (2010) pointed out that trailer CO2 emissions are calculated by multiplying the trailer activity intensity (ton-km) by the trailer emission coefficient (155 g/ton-km).
E: Trailer carbon emissions; T: Number of containers moved (tons); L: Representative distance (km); K: Trailer emission coefficient = 155gCO2/ton-km.
Herbert Engineering Corporation (2011) assumes that HDDV transports a 40-foot container and runs 300 miles at average highway driving speed. The fuel consumption of the fundamental trailer is 533 gallons of fuel/mile, and the CO2 emission coefficient is 3,164 kg of CO2/mile. Tons of oil, the CO2 emission formula of the trailer is
E: Trailer carbon emissions; EF: Trailer emission coefficient (g/mile) = trailer fuel consumption (g/mile) × cargo oil-based emissions (kg emissions/kg oil).
The truck transportation efficiency is 0.54kgCO2e/TEU-km, which is equivalent to the railway transportation efficiency of trucks (0.17kgCO2e/TEU-km) and 1/5 of an 8,500 TEU-class container ship (0.10kgCO2e/TEU-km).
Mckinnon and Piecyk (2009) suggest that trailers' average CO2 emission factor is gCO2/tonne-km.
Chen et al. (2013) proposed a queuing-based bi-objective model to optimize truck arrival patterns to reduce truck emissions at container terminals in a low-carbon economy.
Truck arrival coordination reduces the total waiting time of trucks (the second objective of Phase 1), thereby reducing idling emissions from trucks. Note that this study focuses on trucks running idling and not emissions while driving. The latter depends on the terminal layout and cannot be significantly reduced through the coordination of truck arrivals. Reduced truck idling emissions can be estimated by the formula where e is the engine idling emission coefficient matrix (Starcrest Consulting Group, LLC, 2020).
Kim et al. (2004) advocated that it is assumed that a container trailer produces 0.3864 kg CO2/TEU within a distance of 4 km between the container terminal yard and the port hinterland. The calculation method is to add the carbon density of the container trailer to 4.83 E03 kg CO2/t/km times the average weight of a 20-foot equivalent unit of 20 tons/TEU (Kim et al., 2004). The carbon emissions of container receipt and delivery CDCNTR, R are calculated as shown in the following formula.
Liao et al. (2009) advocated the calculation formula for container trailer CO2 emissions and adopted an activity-based method to estimate CO2 emissions. Activity intensity (ton-kilometers) is calculated by multiplying the distance and the number of containers, and CO2 emissions are estimated by multiplying the activity intensity and the emission factor.
The paper adopted the CF calculation method to compute one export container movement from the perspective of container trailers involving the operation of handling equipment, including an ET and IT, and one export container's CF in a container terminal can be represented as total CO2 emissions by the two types of handling equipment. We consequently propose the use of the following formula to quantify the CF of one container movement:
where
TCO: Total CO2 emissions from all equipment (kg)
AE: Average energy cost of one piece of equipment (kWh/L)
CC: CO2 emission coefficient (kg)
ET_CO: Total CO2 emissions from ET (kg)
ET_AE: Average energy cost for one ET (kWh/L)
ET_CC: CO2 emission coefficient (kg) of ET
3.2 Gray relational analysis
According to the definition of gray theory, the traditional gray correlation degree represents the degree of correlation between two sequences and is a qualitative analysis. It mainly uses the correlation degree between discrete sequences to show the correlation degree of different sequences as a qualitative analysis method. This method's most prominent feature is that it can use the gray correlation value of each sequence for sorting. In gray relational analysis, the function of the identification coefficient is mainly to compare the background value and the object to be measured. The value of the identification coefficient is 0.5, but to increase the difference in results, it can be adjusted according to actual needs. It is known from the actual mathematical proof that the change in the identification coefficient will only affect the relative numerical value of the gray correlation degree but will not affect the ranking of the gray correlation degree (Wen et al., 2006).
Gray relational analysis is a data processing method used to determine the degree of correlation between influencing factors in a system with uncertain information (Deng, 1992). To overcome the restrictions of a small sample size, gray relational analysis can be used to group the initial evaluation indicators and select the most representative indicators (Wang et al., 2004; Liu et al., 2008).
Yang (2017) argued that gray relational analysis determines the ranking order of different container terminal operating models based on the green port assessment criteria of operation time efficiency, energy consumption and CO2 emissions. The paper adopted the same green port assessment criteria to compare two different handling modes from the perspective of container trailers at the Kaohsiung port.
Using traditional methods, Deng derived the first gray relational-grade formula by meeting all four axioms, which are divided primarily into two parts (Wen et al., 2006):
Gray relational coefficient
where
ζ is the distinguishing coefficient, and ζ∈
Gray relational grade: the mean of gray relational coefficient
Since, in general, the weights of different factors are not equal, we extend the foregoing equation to
where is the weighting of each factor and
ς: distinguishing coefficient
The main purpose of ς is to adjust the difference between . While ς can be assigned any desired value, it is usually assigned a value of 0.5. It has been shown in a mathematical proof that a change in the value of ς will not change the rank of the gray relational grade.
Order of gray relational rank
After the gray relational grade has been calculated, we can rank the sequence in accordance with the value; this procedure yields the gray relational rank.
For reference sequences and inspected sequences , where
if then we find that with the reference sequence , the gray relational rank of is greater than that of .
3.3 Data collection and assumptions
The so-called “CF calculation method” is based on the actual data provided by the shipping companies that lease dedicated terminals in Kaohsiung Port. Mainly through two international container terminal companies at the Kaohsiung Port, the paper collects the data from container terminal companies (A) with TT operating mode and terminal operating companies (B) with rail transtainer (RT) operating mode. The study was conducted from July to August 2024 to collect raw data, including interviews with two heads of container terminals at the Port of Kaohsiung.
Regarding the container-handling equipment and the configuration of the two container terminals, Company A currently leases two piers measuring 640 m in length and 520 m in width, totaling 32,800 m2 (equivalent to 33.28 ha). The pier draft is −15 meters, accommodating a maximum of 16,000 TEU type container ship. Regarding container terminal facility configuration, entry and exit at the gate are subject to manual control, including document collection and container inspection. The container-handling equipment at the container terminal consists mainly of TTs, totaling 22 units. The total number of gantry crane facilities is 6, 4 of which can double-lift 20-foot containers.
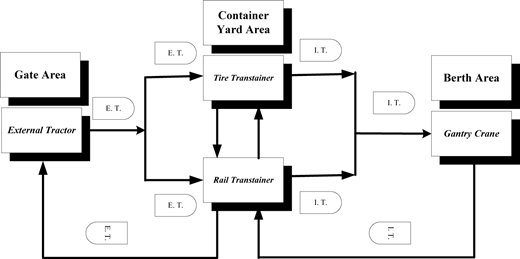
Company B currently leases two piers measuring 760 m in length and 302 m in width, totaling 230,000 m2 (equivalent to 23 ha). Pier draft is −14.5 m, accommodating the maximum 20,000 TEU type container ship. Regarding container terminal facility configuration, entry and exit at the gate are subject to manual control, including document collection and container inspection. The container handling equipment at the terminal is mainly rail-type gantry cranes (rail transtainer), totaling 18 units. The total number of gantry cranes is 6, which can single- and double-lift 20-feet containers (refer to Figure 1).
Figure 1 shows the work process of two different container terminals.
ET(GA)-ET(CY:TT)-ET(GA)-IT(CY:TT)-IT(BA:GC)-IT(CY:TT)
ET(GA)-ET(CY:RT)-ET(GA)-IT(CY:RT)-IT(BA:GC)-IT(CY:RT)
Since the research topic involves different combinations of container terminal operating modes and different scenario analysis parts, we collect data on container terminal operating modes and collect information from a container terminal company (A) that adopts a TT operating mode. The following results were obtained from the data collection of the terminal operating company (B) using the RT operating mode.
Firstly, set the situational assumptions.
The container terminal area is divided into gate, container yard and berth areas.
The gate area is operated manually. The gantry crane category in the berth area is divided into single-lifting and double-lifting 20-foot containers.
The yard cranes are mainly container handling equipment, including RT and TT.
An export container is transported into the gate area via an ET. After entering the gate, the container is handed over to the yard crane and then leaves.
The IT goes to the yard crane to pick up an export container, delivers the container to the gantry crane for shipment and then leaves.
4. Empirical analysis and findings
4.1 Carbon footprint analysis
To clarify the measurement definition of trailer terminologies comprising “operation time,” “idle time,” “total time” and “turnaround time,” the aforementioned measurement definitions are illustrated in the primary. In effect, according to the different operating modes of the container terminals, which are divided into gate station operation modes (Gate Area), terminals (Container Yard Area) equipment operation mode (TT and RT), Berth Area gantry crane operation mode (single lift operation and double lift 20-feet containers), IT operation (including “operation time” [referring to “The turn-around time” from the container yard area to the berth area] and “idle time” [the container yard area and the berth area]) and the ET operation (including operation time [referring to the turnaround time from the gate station to the container yard area] and “waiting time” [the gate station and container yard area]), the CF calculation method calculates the overall carbon emissions and lists the advantages and disadvantages of carbon emissions.
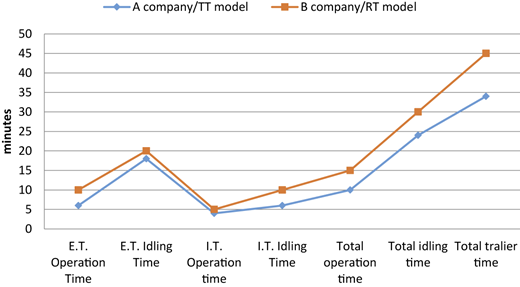
According to the data collected and provided by the two container terminal companies analyzed in this study, the travel time from the gate area to the container yard at Company A is 6 min, while the average idle time is 18 min. 75% of the total time. In the case of Company B, the idle time of ETs accounts for 66.67% of the total time. The operation time of ITs from the container yard area to the berth area of Company A is 4 min, and the idle time of the IT is 6 min. Therefore, the idle time of the ITs accounts for 60% of the total time. In the case of Company B, the idle time of the ITs accounts 66.67% of the total time. The operation time of ETs in the container yard of Company A is 10 min, and the idle time of ITs is 24 min. Therefore, the idle time of ITs accounts for 70.59% of the total time. In the case of Company B, the idle time of the ETs account for 66.67% of the total time (refer to Table 2 and Figure 2).
Overall, as shown in Table 3, the total operation time of Company B is 45 min, which is 11 min longer than the total operation time of Company A, which is 34 min. This may be attributed to the fact that the container volume of Company B is twice that of Company A. The scope of the site is similar. However, the container handling volume exceeds the load capacity, which can easily cause congestion problems at the container terminal. In addition, the loading and unloading operations of larger ships are more time-consuming. However, the idle time of trailers in Company A and Company B is more than 60%. Therefore, how to facilitate the trailer's idle time reduction and operational efficiency improvement has become a research topic pertaining to energy saving and carbon reduction.
The trailer energy cost and CO2 emissions are calculated based on the operation time. The calculation method is briefly explained as follows:
According to Tables 4 and 5, how many miles can the trailer travel? 1 liter of urban fuel consumption = 2.5 kilometers. 1 liter of long-distance fuel consumption = 3–4 kilometers. 1/2.5 = 0.4 liters/km. According to company A's regulations on the container yard trailer limit, if the speed is 20 kilometers per hour, then every minute = 20/60 = 0.33 kilometers per minute. On July 8, 2024, China Petroleum Corporation announced that the diesel price was NT$26.5/liter. The Taiwanese Environmental Protection Bureau announced that the CO2 emissions from diesel used in trailers are 2.67 kg/liter.
Company A (TT Container Terminal)
Trailer operation time: 10 min (IT operation time) + 24 min (ET operation time) = 34 min (total trailer operation time).
Energy cost of trailer: 34 min × 0.33 kilometers/minute = 11.22 kilometers, 11.22 kilometers × 0.4 liters/km = 4.488 liters, energy cost is 4.488 liters × 26.5 TWD/liter = 118.932 TWD
Trailer CO2 emissions: 4.488 liters × 2.67 kg/liter = 11.982 kg.
Company B (RT Container Terminal)
Trailer operation time: Company A, for example, 15 min (IT operation time) + 30 min (ET operation time) = 45 min (total trailer operation time).
Energy cost of trailer: 45 min × 0.33 kilometers/minute = 14.85 kilometers, 14.85 kilometers × 0.4 liters/km = 5.94 liters, energy cost is 5.94 liters × 26.5 TWD/liter = 157.41 TWD
Trailer CO2 emissions: 5.94 liters × 2.67 kg/liter = 15.860 kg.
This paper uses the CF to calculate the carbon emissions of trailers at cross-port container terminals based on the principle of the activity-based method. The analysis mainly uses empirical data provided by experts from trailer companies and container terminal companies engaged in the Kaohsiung Port Area as the basis for analysis. Issues related to energy saving and carbon reduction of container loading and unloading facilities are considered. The analysis is based on the operation time, energy cost and carbon emission of the two container yard operating modes in the table.
The brief description is as follows:
Operation time: From the perspective of container trailer operation time, the operating efficiency of each export container produced by two different container yard operating modes, in order of ranking, is RT (45 min) > TT (34 min). This shows that the operating efficiency of TT container terminal trailers is higher than that of RT container terminals. The reason the RT container terminal has a longer operation time can be summarized as follows: (1) Distance: The actual distance between the gantry crane and the yard crane. (2) Speed limit: The speed limit inside the terminal. (3) Road conditions: whether there are obstacles or traffic jams. (4) Loading status: whether a container is loaded and the weight of the container. (5) Operation efficiency: related to the driver's proficiency, the efficiency of the dispatching system and other reasons. Therefore, if RT container terminal operators need to achieve the goal of green terminals, improving the operating efficiency of terminal equipment and trailers and reducing trailer idle time have become critical issues.
Energy cost: In terms of energy costs, the energy costs incurred by each export container in two different container terminal operation modes are RT (129.91 TWD) > TT (81.68 TWD) in order of ranking. Due to the higher operating efficiency of the TT container terminal, the operation time (including operation time and idle time) of ETs for picking up or delivering containers and internal and external transport, loading and unloading of containers is shorter than the total trailer time of the RT container terminal, so it is calculated as diesel fuel consumption costs are low. However, the idle time of ETs at the TT container terminal is still high; therefore, reducing the retention time of ETs will become an important issue.
Carbon emissions: In terms of carbon emissions, the carbon emissions produced by each export container in two different container yard operation modes are RT (15.86 kg) > TT (11.982 kg) in order of ranking. The carbon emissions of trailers are mainly related to the operation time, including trailer operation time and trailer idle time. In particular, Company A and Company B have trailer idle time problems. The total idle time of Company A's trailer accounts for 70.59% of the total trailer time, which is higher than that of Company B at 66.67% of the company’s trailers. Of course, Company A's trailer idling problem mainly comes from ETs. On the other hand, Company B's trailers' idling time mainly comes from internal and ETs.
Furthermore, the total operation time of RT container terminal trailers is longer than that of TT container terminal trailers; therefore, both energy costs and carbon emissions are higher. Both TR and RT operate two terminals, which are similar in size. However, why is the trailer’s operation time different? This may be because the terminal configuration and operation model are different. Therefore, if RT container terminal operators want to reduce carbon emissions, they must explore the right solution to deal with the aforementioned two issues for the purpose of carbon reduction.
4.2 Gray relational analysis
According to the overall analysis of two container terminal operation modes (including TT and RT) using gray relational analysis, as shown in Tables 6–8, operation time, energy cost and carbon emissions are used to evaluate green container terminals. It was found that the gray relation sorting is TT(1) > RT(0.601). Based on the gray relational analysis, reference values are adopted. In terms of operation time, energy cost and carbon emissions, this paper takes the smaller reference value as a principle to improve operating efficiency and reduce energy cost and carbon reduction goals. After gray relational analysis, TT ranks first regarding operation time, energy cost and carbon emission, and RT ranks second.
4.3 Green operational strategies of energy saving and carbon reduction for container trailers
Based on the analysis of container terminal operation times, energy costs and carbon emissions, the energy-saving and carbon-reducing response strategies for container trailer operators and container terminal operators are provided as follows:
In terms of operation time, the operating efficiency of each export container in two different container yard operating modes is RT (45 min) > TT (34 min) in order of size. Generally speaking, TT's operating efficiency is higher than RT's, and it is more maneuverable and can handle container loading and unloading operations in different areas. RT uses electricity and more prominent equipment, and its moving speed is less flexible than TT. Hence, the operation time is longer, regardless of whether internal and external towing requires longer operation time or idle time.
Gate automation speeds up entry and exit operations: TT and RT, container terminal gates, use manual operations. RT container terminal trailers entering the gate require container inspection (2) + document inspection (1) = 3 min, medium TT Container Terminal Container Inspection (2 min) + Document Inspection (4) = 6 min); the difference between the two is mainly in the document inspection and entry. Since Company B adopts semi-automated gate operations, document inspection can be reduced from 4 min to 1 min. Therefore, the gate automation can improve the efficiency of the gate operation.
Artificial intelligence in transportation route planning: Transportation route planning uses digital technology and artificial intelligence technology to improve trailer operation time and idle time, such as the newly developed intelligent cloud transportation system “OptETruck” by the Singapore Port Authority, which can recommend optimized transportation routes in real time. The number of empty trucks is expected to be reduced by more than 50%, and CO2 will be reduced by 9.6 million kilograms annually (itnews, 2024).
Digital submission of containers: When a traditional truck driver picks up or returns a container to a container yard, the driver needs to inform the container's location through a written process when passing through the gate. The Busna Port Authority’s (2025) use of the Hi-Pass “electronic pick-up list” accelerates trailers entering the port container terminal to pick up containers and receive electronic receipts to replace the past paperwork, promoting the digitalization of the port and the realization of intelligent ports.
A radio frequency identification device tracks the trailer's location: Pier 3, operated by the Hanjin Busan New Port Corporation (HJNC). When a truck (trailer) transporting a container enters, Pier 3, a radio frequency identification device (RFID) is used to track the vehicle's real-time location (Shenghua, 2015). In particular, when the trailer is parked at a designated location, 42 automated rail mounted gantry cranes (ARMGC) transfer the containers to the trailer by remote control operation.
In terms of energy costs, the energy costs incurred by each export container in two different container yard operation modes are RT (129.91 TWD) > TT (81.68 TWD) according to the order of size.
TT refits or introduces electric energy: Because TT uses diesel and other vehicles use electricity, the energy cost is higher and the carbon emissions are higher than other vehicles using electricity. For example, the E-TT operation mode can save 27.52% of the CF of each container compared with TT. This is consistent with Yang and Chang (2013) who advocated that converting TT to E-TT operation can reduce the amount of CO2 by 27%, and other concepts coincide. Converting TT into E-TT aligns with the trend of green port operation models.
Introduction of electric trailers: The Port of Long Beach (2026) has set the goal of achieving zero emissions for all cargo handling equipment by 2030 and a zero-emission trailer fleet by 2035. About 17% of the port's cargo-handling equipment is electric, making it the largest fleet in the USA. The port announced receiving a $30.1 million grant from the US Department of Transportation to deploy the largest fleet of manually operated, zero-emission cargo handling equipment in the USA at a single marine terminal and $159.7 million to purchase zero-emission trailers, charging and hydrogenation infrastructure.
Diversified environmentally friendly energy input: To make the operation of trailers in container yards more consistent with the green environmental protection requirements of the port area, the port area management agency will require the purchase age and exhaust standards of container trailers. The government also encourages trailer operators to introduce environmentally friendly vehicles. For example, Seattle in the USA encourages the use of gasoline–electric hybrid or electric vehicles for trailers, and Qingdao Port claims that it is the world's first “hydrogen + 5G” intelligent ecological terminal by developing hydrogen energy–driven solutions to provide large ports with refueling of equipment required for operations, pioneering hydrogen-powered crane technology and systems. The system reduces carbon emissions by approximately 3.5 kilograms and 0.11 kilograms of sulfur dioxide per TEU (PR newswire, 2022).
In terms of carbon emissions, the carbon emissions produced by each export container in two different container yard operation modes are RT (15.86 kg) > TT (11.982 kg) in order of size.
Analyze the overall analysis of the two container yard operation modes through gray relational analysis and analyze the three factors: operation time, energy cost and carbon emissions. The gray relational ranking is TT > RT, mainly because the TT Container Terminal has a higher operating efficiency, which is lower than that of the RT Container Terminal in terms of operating time, energy cost and carbon emissions.
The gray relational analysis adopts the minimization principle, so the gray relational ranking of TT is better than that of RT. Therefore, if the RT Container Terminal needs to improve its operational performance, it must adjust the existing container terminal operating model and improve the efficiency of trailer operations to reduce energy consumption and CO2 emissions.
RTs and electric TTs can be considered green cargo handling equipment due to their significant contributions to working efficiency, energy saving and CO2 reduction. This study supports the assertions of Lazic (2006) and Clarke (2006) that automatic and semi-automatic cargo-handling equipment are suitable for green container terminals.
Cargo handling equipment with electric power was confirmed superior advantages than other traditional equipment from viewpoints of working efficiency, energy saving and CO2 emission in the port logistics industry; however, some issues are awaiting further discussion for labor expenditure reduction, misguiding cost mitigation and idling speed of external tractor for picking and delivering container. The paper proposes a series of issues for academic themes, such as idling vehicle time reduction issue, revision issue of existing operating system to remote control system or laser remote sensing technology, etc.
5. Conclusions and suggestions
This paper focuses on the CF generated by an export container entering the container terminal, passing through the gate, container yard and berth areas and finally being shipped. Of course, it also involves analyzing the container from three perspectives: operational time efficiency, energy costs and carbon emissions. The areas of the terminal and the operation modes of trucks and container-handling equipment are relatively incompatible with the business concept of green container terminals, so we need to explore countermeasures.
After empirical analysis, the study reached the following conclusions:
A green container terminal should be designed to harmonize container terminal operations with the ecological environment by balancing operational efficiency, energy conservation and carbon reduction.
The improvement of container trailer operation efficiency is related to the following factors such as distance (actual distance between bridge crane and gantry crane), speed limit (speed limit inside the terminal), road conditions (road conditions, whether there are obstacles or traffic congestion), loading conditions (whether a container is loaded, and the weight of the container) and operating efficiency (the proficiency of the driver, the efficiency of the dispatching system) and other factors.
To enhance the operating efficiency of container trailers, trailer operators and container terminal operators should plan a suitable operating model based on the above factors, aiming to reduce operation time, lower energy consumption and reduce carbon emissions.
Calculate the container terminal operating mode combination based on the CF method. Regardless of container-trailer operation time, energy costs and carbon emissions, the RT container terminal data are greater than the TT container terminal data. This is mainly because the RT Container Terminal docks larger ships, up to 20,000-class ships. On the other hand, the largest ship at the TT Container Terminal is a 16,000 TEU-class ship. In addition, RT's average annual container-handling capacity is 1.1 million TEU, compared to TT Container Terminal's average of 500,000 TEU. It is about twice the container-handling volume, so it consumes more operational time.
The suggestions for academia, government development policies and industrial sectors are described in order as follows:
Implication of academic research: Empty containers are not included in the scope of this article's study. Since empty containers are lighter, trailer transportation is more efficient than transporting heavier containers, in terms of time, energy consumption and carbon emissions. However, if empty containers need to be accounted for, the container handling model will become more complex. For example, in the case study of Kaohsiung Port Company A, the average trailer turnover time for all heavy container trailers in 2020 was 13.55 min, while the average trailer turnover time for empty containers was 10.46 min. The emptying time can be reduced by 3.09 min. In the future, we can analyze the trailer operation efficiency ratio across different container terminal operating modes for empty and heavy containers. It will help improve the operational efficiency of container terminals.
Implications of government development policies: According to Yang and Shen (2013), who advocated a green port performance analysis from the perspective of energy saving and carbon reduction compared with Diesel fuel-TT and electricity-TT, it was found that electric TT can save 86.60% of energy and 67.79% of CO2 emissions. Therefore, this article believes that the government should legislate or formulate incentive measures to encourage container terminal operators to upgrade their container-handling equipment to meet environmental protection requirements, convert TTs to electric ones or purchase hybrid-energy TTs to achieve energy-saving and carbon-reduction goals in green ports.
Implications for the industrial sector: Container trailer companies can use GPS and ERP to track vehicle movements. Take a container trailer company in Kaohsiung as an example. It has hundreds of vehicles. The main functions of the GPS fleet management system installation are to track vehicle movements and monitor driver behavior. Moreover, it understands fuel consumption levels. At the same time, through enterprise ERP, big data, 5G and AI algorithms, the operating efficiency of container trailers can be enhanced and energy-saving and carbon-reduction effects can be improved.
Ethics statement
We confirm that we have reviewed and adhered to the Ethics in Publishing guidelines, as well as the Ethics Policies of the journal.
Data and code availability statement
The data that support the findings of this study are available from the corresponding author, upon reasonable request.