


The present research aims to develop a Terminal Competitiveness Index (TCI) applied to the container terminals located in the Hamburg – Le Havre range, which is an area characterised for its intense container activity. The main components of the TPCI are productivity, foreland connectivity and infrastructure.
To construct the index, the Benefit-of-the-Doubt and the Common Set of Weights methods in Data Envelopment Analysis are used to obtain a common weighting scheme for the evaluation of container terminals.
Results show that connectivity and terminal efficiency are the most important factors for terminal competitiveness. The TCI has identified that APM Terminals Maavslakte II (Rotterdam), ECT Delta (Rotterdam) and MPET (Antwerp) turned out with the highest competitiveness score.
Container terminals play a key role in today’s marketplace since they are the main infrastructure responsible for loading and unloading the containers full of intermediate and final goods. Therefore, the competitiveness of such terminals is crucial for shipping lines and importing and exporting companies, influencing their cost and schedule reliability. However, there is scarce literature studying the competitiveness of container terminals since the focus to date has been on ports as units of analysis. The terminal approach used allows the analysis of the competitiveness of terminals belonging to different ports but also between those located in the same port.
1. Introduction
Over the last decades, ports around the world have experienced intense changes that have put pressure on their adaptive capacity and their competitiveness. Among them, the transition from tool and public governance models to the landlord model is considered of high relevance due to their effect on port efficiency (Cano-Leiva et al., 2023). This new scenario opened the access to private terminal operators to take part in port operations through terminal concession agreements (Ferrari et al., 2015).
This fact brought a new horizon in which the several container terminals located in the same port may easily be managed by different private terminal operators, competing among them to attract the shipping line’s port calls. Indeed, this process turned the point from ports to terminals with regard to operational activities, increasing in this way the intra and inter-port competition. Since then, terminal operators have been focused on improving port competitiveness through investing in terminal facilities and equipment to increase the annual number of container handled. For this reason, measuring terminal and port competitiveness has become a crucial topic in recent years, drawing the attention of researchers, managers and policy-makers worldwide.
From academia, port competitiveness has been analysed by using several approaches to date. Most previous research on this topic has concentrated on identifying key competitiveness factors by examining port choice decisions (Martínez-Moya and Feo-Valero, 2022) and port competition (Parola et al., 2017) from the perspective of various users. However, the development of composite indexes based on ports' current performance as a quantitative measure of port competitiveness remains largely unexplored. Existing composite indexes tend to analyze specific competitiveness factors individually, such as connectivity (Jiang et al., 2015; Martínez-Moya et al., 2024a, b) or efficiency (Tongzon, 1995; Merkel, 2018) at the port level. Thus, there is a lack of papers that seek to aggregate several competitiveness factors into a single measure to provide a global evaluation of the port competitive position.
Furthermore, regarding the unit of analysis, despite the crucial role played by terminals in improving the competitiveness of ports, little attention has been paid to them in previous studies. In fact, the growing but still limited number of papers aiming to develop competitiveness indexes is still focused on ports as units of analysis, i.e. only Souza et al. (2023) studied terminal competitiveness. Indeed, existing studies on container terminals are centred on evaluating their technical efficiency (Li et al., 2021). Nevertheless, the development of competitiveness indexes based on the current performance of terminals has not yet been widely explored.
Therefore, in an effort to fill this gaps, the present research aims to measure container terminal competitiveness by constructing an index, which is applied to the major container terminals located in the Hamburg –Le Havre range. This case study deserves especial attention. In recent decades, substantial investment initiatives have been undertaken within this range of ports, with the objective of establishing new container terminals or expanding the operational capacity of pre-existing facilities, such as Rotterdam (APM Terminals Maavslakte II). This process has intensified competition among terminals due to the increased availability of alternatives for shipping lines and their alliances when choosing a terminal. As a result, terminal operators are under greater pressure to improve their competitiveness.
To construct the index, the Benefit of Doubt (BoD) method in Data Envelopment Analysis (DEA) utilises a Common Set of Weights (CSW) to aggregate various competitiveness factors into a single measure. In this regard, the variable infrastructure, foreland connectivity and productivity are included in the index to assess the competitive position of the container terminal under study.
Our results have important implications for policy-makers and port and terminal managers. The Terminal Competitiveness Index (TCI) developed here can be used as a benchmarking tool which provides useful information to managers related to inter-terminal competition, supporting their decision-making on the implementation of new measures to improve their relative competitiveness. Moreover, the TCI provides managers with a tool to assess the intra-port competition, i.e. competition between terminals located in the same port, and the degree of implementation of measures to enhance their competitiveness score.
Thus, the present research makes two main contributions: first, the development of a terminal competitiveness index, which allows the analysis of intra- and inter-terminal competitiveness; and, second, the application of the index to the study of the competitiveness of the major container terminals located in the Hamburg – Le Havre range.
The rest of the paper is structured as follows: Section 2 describes the literature review of the port competitiveness variables under study; Section 3 presents the research context; Section 4 details the methodology used for the weighting scheme; Section 5 reports the main results; Section 6 provides the discussion; Section 6 presents the main conclusions of the study.
2. Literature review
2.1 Review of port competitiveness factors
From an academic perspective, in the field of maritime studies, port competitiveness is considered a multidimensional concept (Parola et al., 2017), as it is built on the ability of port authorities and private business operators to perform value-added activities (Yeo and Song, 2006). One of the most extensively researched subtopics in this area focuses on identifying the drivers of port competitiveness, which is closely linked to port choice research (Parola et al., 2017). These studies aim to determine the factors or criteria that influence port users’ behavior when making port choice decisions (Martínez Moya and Feo Valero, 2017).
However, the performance of these factors alone is not the sole determinant of port selection. The differing perceptions among shipping lines, shippers, and freight forwarders also significantly influence the weight assigned to each port competitiveness driver (Feo-Valero and Martínez-Moya, 2022).
Accordingly, the present research draws on port choice literature, using port competitiveness drivers to construct the proposed composite index. The Terminal Competitiveness Index (TCI) aims to measure the competitiveness of container terminals by focusing on the factors considered by shipping lines in their port choice decisions. The better a terminal performs in these factors, the more competitive it becomes, increasing the likelihood of being selected by a shipping line.
So far, the studies focused on measuring port and terminal competitiveness by developing composite indexes are still scarce. Table 1 shows the main studies focused on measuring port competitiveness by constructing an index.
List of papers proposing a port competitiveness index
| Authors | Unit of analysis | Application | Methodology | Variables |
|---|---|---|---|---|
| Abbes (2015) | Port | 14 North and West African ports | PCA |
|
| Kammoun and Abdennadher (2022) | Port | 30 European ports | DEA for efficiency variable and PCA |
|
| Kim (2016) | Port | 10 Chinese and Korean ports | Entropy Weights TOPSIS |
|
| Munim et al. (2022a, b) | Port | 5 Asian ports | Analytic Network Process |
|
| Munim et al. (2022) | Port | 1 Asian port | Confirmatory Composite Analysis |
|
| Nayak et al. (2024) | Port | 12 major Indian ports | PCA |
|
| Souza et al. (2023) | Terminal | 20 Brasilian terminals | K-means algorithm and Hierarchical cluster |
|
| Wang and Yeo (2019) | Port | 10 Chinese ports | AHP and Consistent Fuzzy Preference Relation Method (CFPR) |
|
| Yang and Chen (2016) | Port | 3 Asian ports | AHP and Gray relational analysis |
|
Source(s): Own elaboration
Among the previous studies on port competitiveness, it is surprising the little attention has been paid to the role of container terminals in the competitiveness of ports. In this regard, Souza et al. (2023) is the only study we have identified measuring the competitiveness at the terminal level for container cargo. The authors evaluated the major container Brazilian terminals and classified them into three main groups by using Hierarchical Cluster methodology. The results evidenced the operational limitations of some terminals, which require urgent measures from policy-makers oriented to enhancing terminal infrastructure.
In contrast, the large majority of papers aimed to develop competitiveness indexes using the port as a unit of analysis. To do so, Table 1 shows that studies in this field have commonly employed the Analytic Hierarchy Process (AHP) and Principal Component Analysis (PCA) as main methodologies.
Regarding the competitiveness factors to be included in the index, it is worth highlighting that the large literature contributing to port choice has identified port charges, port efficiency, port infrastructure, shipping connectivity, geographical location, port service quality, hinterland connections and digitalisation as the most important determinants (Martínez-Moya and Feo Valero, 2017; Parola et al., 2017). The majority of these mentioned factors have been used as main components in studies aiming to develop indexes (Table 1).
2.2 Research gaps
The first gap identified is related to the unit of analysis under study. The composite indexes based on the competitiveness of terminals have not yet been widely explored by previous studies. Given the crucial role played by terminals in today’s marketplace, measuring their competitiveness is deemed essential to provide valuable inputs for port and terminal managersin decision-making. Moreover, this approach allows the competition analysis between terminals located in the same port.
The large majority of papers published to date are focused on ports in Asia, so the study of other areas specialised in container traffic —such as the Hamburg – Le Havre range—is of great interest. This area is considered an interesting case to study because of the fierce competition between the large number of container terminals managed by some of the top private operators.
In terms of methodology, there are alternative approaches to AHP and PCA that ensure the uniqueness of weights and constituting a Pareto-optimal solution. One such methodology is the Common Set of Weigths (CSW) method, which is used in the present research for the objective selection of the weighting scheme and it is considered a critical issue in the construction of indexes.
3. Research context
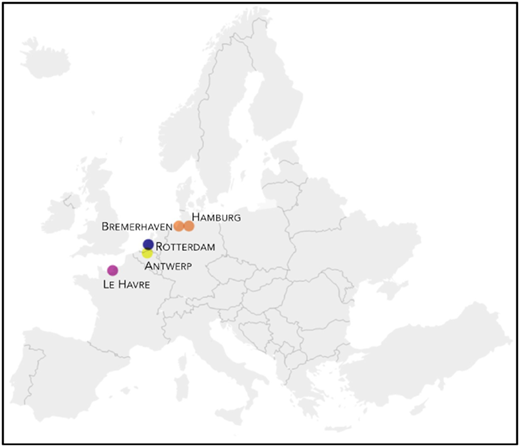
The Hamburg - Le Havre range is a group of ports located mainly in the Netherlands, Germany, Belgium, and France. In terms of container traffic, the most relevant ports are Hamburg, Bremerhaven, Rotterdam, Antwerp, and Le Havre, all of them included in our sample. (see Figure 1)
Apart from some of the largest European ports, in this area we can find some of the top container terminal operators. In the last decades, shipping lines and terminal operators have invested in container terminals to improve port operations to meet the demands of shipping lines in terms of infrastructure, equipment and ship turnaround time. As an indication of how important these variables are to guarantee a high degree of schedule reliability, in recent decades, shipping lines have been developing dedicated terminals around the world to seek control over berths (Notteboom, 2006). For this reason, some of the key shipping lines and their associated terminal operators have invested in huge terminals located in Northern and Western-European countries as intermodal platforms for their logistics and commercial operations, like for example APM Terminals and TiL. It is worth highlighting the key role played by the integration of shipping companies as terminal operators. Their involvement as terminal operators not only helps boost efficiency from a hub perspective, but also guarantees continuity and stability in port throughput. This means that port authorities have room to develop their strategic plans in the context of some certainty as well as ensuring the consolidation of the supply of shipping services in the port.
Moreover, some of the top container terminal operators not associated with a shipping line have invested in terminals located in said area, such as Hutchinson Ports, DP World and PSA.
In our case, the criterion used to select the terminals for the study was an annual port throughput over 1 million TEU. In doing so, we have included the largest container terminals in the Hamburg – Le Havre range. Table 2 shows the ports and container terminals under study and the terminal operators who manage such infrastructure.
Terminal operators’ statistics, 2019
| Ports | Terminal | TEU (000) | Terminal operators |
|---|---|---|---|
| Antwerp | DP World Antwerp Gateway Terminal | 2.109 | DP World |
| MSC PSA European Terminal (MPET) | 6.600 | PSA and TiL | |
| PSA Antwerp Europa Terminal | 1.232 | PSA | |
| PSA Antwerp Noordzee Terminal | 1.111 | PSA | |
| Bremerhaven | North Sea terminal | 2.994 | Eurogate and APM Terminals |
| MSC Gate Bermerhaven | 1.500 | Eurogate and TiL | |
| Hamburg | Container Terminal Altenwerder | 2.092 | HHLA |
| Container Terminal Burchardkai | 2.600 | HHLA | |
| Eurogate Container Terminal Hamburg | 4.364 | Eurogate | |
| Le Havre | France Terminal | 1.502 | DP World |
| Terminaux de Normandie | 1.000 | TiL | |
| Rotterdam | APM Terminals Maavslakte II | 2.323 | APM Terminals |
| APM Terminals Rotterdam | 1.911 | APM Terminals | |
| ECT Delta | 5.300 | Hutchinson Ports | |
| ECT Euromax | 2.793 | Hutchinson Ports | |
| Rotterdam World Gateway | 1.921 | Rotterdam World Gateway |
Source(s): Own elaboration. Information from Port Authorities and Terminal Operators’ websites. Terminal TEU data were collected from Drewry
The case of the Hamburg – Le Havre range is an interesting case to study because of the high concentration of large ports very close to each other (maximum distance of 1,000 km) that end up in an intense competition among them. In recent decades, due to this competition, port managers and terminal operators have invested in different dimensions of ports and terminals to enhance their competitiveness. In this regard, since being able to offer a sufficient level of operational handling capacity ensuring the provision of efficient and competitive services is essential, the development of large-scale port infrastructure has been the dominant strategy of most Western-European container ports (Rashed et al., 2018). Thus, over the last two decades, the different investments made in the ports of the Hamburg-Le Havre range [1] have allowed the average occupation rate to be reduced from 93% in 2004 to 67% in 2018 (van Hassel et al., 2020).
4. Methodology and data
4.1 Methodology
Table 1 illustrates that various methodological approaches have been employed in prior research to estimate a competitiveness index for ports. Such indices inherently involve integrating multiple indicators into a composite measure. In this scenario, the assignment of weights to each variable is crucial, as it determines the “importance” of each variable within the index. DEA offers significant advantages here. In this regard, researchers have demonstrated the advantages of using DEA and its variations for constructing composite indexes (Nardo et al., 2005; Adler et al., 2002; Savić and Martić, 2017; Cherchye et al., 2007). This approach has been applied to a wide range of topics (Cherchye et al., 2008; Charles and Díaz, 2017; Martín et al., 2017; Lan et al., 2022; Milanović et al., 2022; Martínez-Moya et al., 2024a, b; Feo-Valero et al., 2024).
Firstly, it constructs an efficient production frontier using the data (inputs and outputs) of the evaluated units, thus allowing the integration of multiple inputs and outputs in forming the competitiveness index. Secondly, DEA allocates weights to each variable endogenously through linear programming, optimizing them to maximize the competitiveness index. However, this method poses a challenge for cross-unit efficiency comparisons using traditional DEA models, as performance assessments are based on unit-specific weight sets, rendering such comparisons ineffectual. The CSW approach addresses this issue by applying uniform weights to the variables across all evaluated units (Contreras, 2020). Consequently, in this study, DEA models that assume a common set of weights (DEA-CSW) could prove highly beneficial, enabling a clear ranking of terminals and potentially enhancing the acceptability of the benchmarking process by ensuring all terminals are compared under identical conditions (Martínez-Moya et al., 2024a, b; Feo-Valero et al., 2024). Furthermore, the competitiveness index, being a composite index, exclusively incorporates outputs. In this regard, Cherchye et al. (2007) introduced the Benefit-of-the-Doubt (BoD) approach, a variant of the DEA that assumes a unitary input level for all evaluated units. Therefore, the BoD method is particularly apt for assessing the competitiveness of terminals, as all indicators constituting the index are outputs, reflecting the operational characteristics of the terminals.
In the first stage, we estimate the BoD-DEA model, which allows for an objective selection of the weights assigned to each of the decision-making units (DMUs) (Charnes et al., 1978; Cherchye et al., 2007):
where denotes the weight assigned to each of the DMUs (j) using the outputs or values assigned to each of the indicators (K) for each DMU: take values ranging between 0 and 1.
Yet, in the BoD-DEA model of this kind, every DMU is assessed based on its unique optimal weighting scheme. This represents a disadvantage for comparative analyses, as it seems unjust that identical components receive varying weights in the assessment of different DMUs (Adler et al., 2002; Contreras, 2020).
Hence, to overcome this drawback, a subsequent step involves estimating the DEA model under CSW conditions (Cook and Kres, 1990; Wu et al., 2016). This is done to establish a uniform basis for evaluating all DMUs. Consequently, each DMU is assessed using an identical weighting profile, facilitating the comparison of scores across all ports.
Introduced by Wu et al. (2016), the CSW method employed in this study utilizes a max-min model along with two algorithms for common weight assignment. Initially, the max-min model, coupled with algorithm 1, is applied to produce an identical set of weights for all DMUs. However, this solution may not be singular, leading to multiple alternative solutions. Subsequently, algorithm 2 is utilized to ensure that the generated common set of weights is unique and converges to a Pareto-optimal solution. These elements collectively contribute to ensure that the evaluation yields satisfactory results for all DMUs and enables superior discrimination compared to traditional DEA models.
In the use of the CSW, each DMU has its own upper and lower efficiency targets. On the one hand, the upper efficiency target for a DMU is its Constant Returns to Scale efficiency when its optimal weights are selected. On the other hand, the lowest efficiency of a DMU is reached when it is forced to use a set of weights that is the most favourable for another DMU and the least favourable for the DMU in question.
Finally, the CSW model is formulated as a single-objective problem in model (2):
where denotes the objective function to maximise the satisfaction degree [2]; and are the weights assigned to the outputs and inputs, respectively; and are the outputs and inputs of the included in the model, respectively; and constitute the maximum and minimum score obtained by each , respectively; denotes the slack of the first constraint of the maximum score; is the slack of the second constraint of the minimum score; is the total number of DMUs.
When the single-objective problem is solved, it is possible to generate a set of common weights. However, it does not guarantee a unique solution for said weights, which is why the second algorithm is used to reach a Pareto-optimal solution (Wu et al., 2016) (3):
4.2 Data
In our case, we focus on the quantitative variables [3] more linked to terminal operations to measure their current performance:
Terminal efficiency: we use the variable crane productivity measured as the terminal throughput (total number of TEU handled by the terminal in 2019) divided by the number of ship-to-shore cranes in each terminal (Martínez-Moya et al., 2024a, b). This performance indicator used by terminal operators is critical to minimise the vessel berthing time to meet the demands of the shipping lines (Dragović et al., 2023). The number of cranes was collected from Port Authorities and terminal operators’ websites and terminal container throughput from the Drewry report in 2020.
Terminal infrastructure: the variable is measured as the container berth length divided by the number of containers quays at the terminal. Although this variable has traditionally been studied in port competitiveness indexes by including some physical facilities of the ports concerned [4], we opted to study infrastructure using the number of quays and their length. Given that the size of container ships has been increasing dramatically in recent decades, this variable makes a difference in enabling the allocation of the largest container vessels that put pressure on terminals’ equipment and infrastructure (Cordeau et al., 2007; Rozar et al., 2022).
Port connectivity: this variable is measured by using the Port Liner Shipping Connectivity Index [5] (PLSCI) produced by UNCTAD (UNCTAD, 2021). One concern related to this variable is that it is measured at port and not at terminal level, being the latest the unit of analysis in the present research. Port connectivity refers to how well one origin port connects to others in the maritime transportation network, and that port’s ease-of access and attractiveness in terms of being reached by regular liner services (Jiang et al., 2015). Given that some of the terminals under analysis can be classified as transhipment or at least have a percentage of transhipment cargoes, connectivity is deemed essential for them. In this regard, a high level of port connectivity ensures efficient feeder services to distribute the TEU to various regional destinations (Lirn et al., 2004; Munim et al., 2022).
Table 3 shows the descriptive statistics for the three outputs of the 16 container terminals included in our sample, with 2019 as the reference year.
Descriptive statistics of the sample
| Port | Container terminal | Productivity | Infrastructure | Connectivity |
|---|---|---|---|---|
| Antwerp | DP World Antwerp Gateway Terminal | 150.6 | 1,710 | 90.56 |
| MSC PSA European Terminal (MPET) | 173.7 | 3,680 | 90.56 | |
| PSA Antwerp Europa Terminal | 136.9 | 1,180 | 90.56 | |
| PSA Antwerp Noordze Terminal | 79.4 | 1,225 | 90.56 | |
| Bremerhaven | North sea terminal | 166.3 | 1,800 | 63.84 |
| MSC Gate Bermerhaven | 125 | 1,220 | 63.84 | |
| Hamburg | Container Terminal Altenwerder | 173.3 | 1,400 | 76.11 |
| Container Terminal Burchardkai | 145.5 | 950 | 76.11 | |
| Eurogate Container Terminal Hamburg | 99.6 | 2,080 | 76.11 | |
| Le Havre | France Terminal | 150.2 | 1,400 | 62.3 |
| Normandie | 90.9 | 2,100 | 62.3 | |
| Rotterdam | APM Terminals Maavslakte II | 232.3 | 1,500 | 95.04 |
| APM Terminals Rotterdam | 136.5 | 1,600 | 95.04 | |
| ECT Delta | 155.9 | 3,600 | 95.04 | |
| ECT Euromax | 174.6 | 1,500 | 95.04 | |
| Rotterdam World Gateway | 120.1 | 850 | 95.04 |
Source(s): Own elaboration
5. Results
The CSW was estimated [6] for the 16 major terminals located in the Hamburg-Le Havre range.
Table 4 shows the weights for the components resulting from the estimation of the CSW. Recall that among the objectives of the present research, finding the unique set of weights that constitute a Pareto-optimal solution (Wu et al., 2016) is deemed essential to enable a common base for the evaluation of the container terminal competitiveness.
CSW optimal weights
| Variables | |||
|---|---|---|---|
| Productivity | Connectivity | Infrastructure | |
| Common weights | 0.12344 | 0.87206 | 0.00449 |
| % of total weight | 12.34% | 87.20% | 0.46% |
Source(s): Own elaboration
Looking at the weights, connectivity is ranked as the most important variable for the competitiveness of major container terminals in the Hamburg – Le Havre range. This variable is especially relevant for terminals with a higher share of transhipment cargo and for those labelled as transhipment terminals (Lirn et al., 2004; Munim et al., 2022a, b [7]), such as MSC PSA European Terminal (MPET). In this regard, the level of connectivity influences the capacity supplied and the time required for the transhipped container to reach its final destination country (Jiang et al., 2015). In addition, a higher level of connectivity provides shipping lines with more flexibility to manage their transhipment cargo by having more shipping connections to distribute the containers efficiently.
Moreover, it is worth highlighting the role of terminal efficiency, which turns out to have the second highest weight. In our case, measured as crane productivity, this performance indicator is crucial for shipping lines when they come to making strategic terminal choice decisions. This variable is strongly linked to ship turnaround time: the higher the productivity is, the less time the vessel spends at port. This has important implications for shipping lines in terms of the time spent by the vessel at berth and consequently the terminal handling cost. Needless to say that productivity has become even more relevant in recent years due to the its relationship with ship size (Souza et al., 2023). Indeed, the largest vessels require more TEU movement per ship, needing these terminals to have a higher crane productivity ratio.
Finally, in terms of port infrastructure, its lower weight in the TCI can be explained by the good endowment of physical facilities of the terminals considered in our sample. This may be caused by recent expansion of the existing infrastructures and their capacity in the ports located in this area (van Hassel et al., 2020). Consequently, they all have terminals that can accommodate the call of large vessels (Souza et al., 2023).
The results of the TCI are presented in Table 5.
TCI scores and ranking
| Terminal | Score |
|---|---|
| 1. APM Terminals Maavslakte II (R) | 1 |
| 2. ECT Delta (R) | 0.9999 |
| 3. MSC PSA European Terminal (MPET) (A) | 0.9886 |
| 4. ECT Euromax (R) | 0.9397 |
| 5. APM Terminals Rotterdam (R) | 0.9038 |
| 6. DP World Antwerp Gateway Terminal (A) | 0.8897 |
| 7. Rotterdam World Gateway (R) | 0.8582 |
| 8. PSA Antwerp Europa Terminal (A) | 0.8553 |
| 9. PSA Antwerp Noordzee Terminal (A) | 0.7969 |
| 10. Container Terminal Altenwerder (H) | 0.7951 |
| 11. Container Terminal Burchardkai (H) | 0.7490 |
| 12. Eurogate Container Terminal Hamburg (H) | 0.7440 |
| 13. North Sea Terminal (B) | 0.7125 |
| 14. France Terminal (LH) | 0.6692 |
| 15. MSC Gate Bermerhaven (B) | 0.6474 |
| 16. Terminaux de Normandie (LH) | 0.6339 |
Note(s): (A) = Antwerp; (B) = Bremerhaven; (H) = Hamburg; (LH) = Le Havre; (R)= Rotterdam
Source(s): Own elaboration
The TCI results show that APM Terminals Maavslakte II (1) is the most competitive container terminal in the Hamburg – Le Havre range, closely followed by ECT Delta (0.9999) and MPET (0.9886). We use the comparison between APM Terminals Maavslakte II and ECT Euromax as an example to help with the interpretation of the TPCI score: APM Terminals Maavslakte II is 6.03% more competitive than ECT Euromax, so the latter would have to increase its outputs (especially, port productivity) by 6.03% to reach the competitiveness level of APM Terminals Maavslakte II.
When inter-port competitiveness is analysed, the importance of connectivity in the TCI is crucial to reach a high competitiveness score. In this regard, the terminals located in the ports of Rotterdam (95.04 PLSCI score) and Antwerp (90.56) have a competitive advantage over the others, since they are the best connected ports in our sample, followed at some distance by Hamburg (76.11). Therefore, APM Terminals Maavslakte II, ECT Delta (both in Rotterdam) and MPET (in Antwerp) are the top container terminals in the TCI ranking with the highest port connectivity score.
However, these three terminals are also among the top performers in the other variables included in the TCI. Regarding the variable crane productivity, APM Terminals Maavslakte II is ranked as the most productive container terminal, followed by ECT Euromax and MPET. After them, we find the Container Terminal Altenwerder (Hamburg) and North Sea Terminal (Bremerhaven) in the ranking, but their lower performance in port infrastructure and connectivity penalise their competitiveness score. In terms of infrastructure, MPET and ECT Delta are the terminals with the largest berth length per number of quays, which is crucial for the allocation of large vessels at berth.
Furthermore, in terms of intra-port competitiveness, Table 6 shows the ranking of the most competitive terminals within each port.
TCI scores and ranking for intra-port competitiveness
| Ports | Terminals | Score |
|---|---|---|
| Antwerp (Std. dev. 0.08) | 1. MSC PSA European Terminal (MPET) | 0.9886 |
| 2. DP World Antwerp Gateway Terminal | 0.8897 | |
| 3. PSA Antwerp Europa Terminal | 0.8553 | |
| 4. PSA Antwerp Noordzee Terminal | 0.7969 | |
| Bremerhaven (Std. dev. 0.05) | 1. North Sea Terminal | 0.7125 |
| 2. MSC Gate Bermerhaven | 0.6474 | |
| Hamburg (Std. dev. 0.03) | 1. Container Terminal Altenwerder | 0.7951 |
| 2. Container Terminal Burchardkai | 0.7490 | |
| 3. Eurogate Container Terminal Hamburg | 0.7440 | |
| Le Havre (Std. dev. 0.02) | 1. France Terminal | 0.6692 |
| 2. Terminaux de Normandie | 0.6339 | |
| Rotterdam (Std. dev. 0.06) | 1. APM Terminals Maavslakte II | 1 |
| 2. ECT Delta | 0.9999 | |
| 3. ECT Euromax | 0.9397 | |
| 4. APM Terminals Rotterdam | 0.9038 | |
| 5. Rotterdam World Gateway | 0.8582 |
Source(s): Own elaboration
In this case, the variable connectivity takes the same value for all the container terminals located within a port, so differences in the TCI score relies only on productivity and infrastructure components.
First of all, it is worth highlighting the different levels of variability observed in the competitiveness levels of the different terminals at the intra-port level. Thus, while in the case of the ports of Antwerp and Rotterdam, the differential between their most and least competitive terminals is 0.19 and 0.14 points, respectively, in the case of the remaining ports said differential is 0.06 (Bremerhaven), 0.05 (Hamburg) and 0.03 (Le Havre). The highest heterogeneity in the levels of intra-port competitiveness occurs in the case of the Port of Antwerp, whose TPCI score has a standard deviation of 0.08. From the perspective of the port authorities, homogeneity in the level of competitiveness across terminals can also be considered a strategic objective, so that in case of saturation / capacity shortage on the part of any of the leading terminals, the remaining are well positioned to be an alternative to the shipping line, thus preventing them from choosing to move to another of the leading terminals located in their neighboring ports.
In the case of the Port of Antwerp, MPET achieves the highest score due to its significantly superior values in terms of productivity and infrastructure compared to the other terminals within the port. Similarly, in the Port of Bremerhaven, North Sea Terminal stands out as the most competitive, boasting higher levels of productivity and terminal infrastructure endowment compared to the other terminals.
However, in the remaining ports, the most competitive terminal is not as evident since the one with the highest productivity performance does not necessarily align with the one offering the longest berth. In this scenario, the greater weight assigned to the productivity variable makes the difference in determining the terminal’s final ranking position. In the case of Hamburg, despite Eurogate Container Terminal Hamburg having the best infrastructure, Container Terminal Burchardkai and, notably, Container Terminal Altenweder lead the rankings due to their higher productivity. In Le Havre, the France Terminal holds the top position owing to its superior productivity performance, despite the Normandie Terminal having a significantly longer berth. Finally, in the Port of Rotterdam, despite the differences in infrastructure between ECT Delta and others, APM Terminals Maasvlakte II emerges as the most competitive, thanks to its significantly higher productivity. In this instance, being a state-of-the-art, modern terminal equipped with advanced loading and unloading equipment and technologies, it achieves exceptionally high levels of productivity.
6. Discussion
After analysing the results, TCI scores show large differences between ports with regard to competitiveness both in terms of inter- and intra-port competitiveness.
In this regard, having a high competitiveness level is essential for terminals in order to increase their container throughput and make their business profitable. To achieve this, they need to attract the cargo generated by shippers and, simultaneously, the shipping services offered by shipping companies to their facilities. In our case, as analysed in the TCI, competitiveness can be improved by implementing measures to enhance the performance on connectivity, productivity, and infrastructure. In the case of the latter factor, the time horizon for action is more extended, and the benefits of its improvement are seen in the medium and long term. Therefore, in the short term, terminals should focus their efforts on improving connectivity and productivity as key variables for enhancing their short-term performance. Regarding connectivity, this is considered an exogenous variable by terminal managers to boost their competitiveness score, since it is the result of the measures oriented to attract the shipping lines’ calls to the terminal [8]. Therefore, terminal efficiency becomes crucial not only due to the gains in productivity but also because of the effects it has on connectivity and port costs.
In general terms, the efficiency of container terminals is influenced by the decisions undertaken at strategic, operational, and tactical levels, which determine the productivity of terminals across five key areas: berth, quay, transport zone, storage yard, and terminal gate. Examples of these influential factors encompass the latest innovations incorporated in quay cranes, terminal layout and container stacking systems and the adoption of automated technology in container terminals (Kon et al., 2021).
From the user’s perspective, terminal efficiency is one of the most relevant determinants of the port choice decisions of shipping lines (Martinez Moya and Feo Valero, 2017). Indeed, shipping lines prefer to call at terminals that offer efficient operations, as it minimizes vessel turnaround times and allows for more frequent services (Périco and da Silva, 2020). Moreover, efficient terminals can provide cost-effective services, including lower handling fees that can result in cost savings for shipping lines (van Hassel et al., 2020). Therefore, since said variable is a key factor of terminal competitiveness, port managers and terminal operators need a precise tool to evaluate it. This would enable them to evaluate whether the investments made to enhance terminal competitiveness have achieved their objectives, reflected in an improvement in the score and position in the ranking.
7. Conclusions
In recent decades, assessing the competitiveness of ports has emerged as a crucial concern. Although researchers have devoted significant effort to identifying the factors that determine competitiveness, there has been a limited number of studies that comprehensively evaluate these factors on a global scale. Additionally, there has been insufficient focus on assessing the competitiveness of individual terminals within ports, despite the fact they are the key player in the container handling operations.
Therefore, the main contribution of the paper is to developed the TCI to measure the competitiveness of the major container terminals located in the, integrating productivity, infrastructure, and connectivity as main components. Methodologically, the BoD-DEA-CSW approach used ensures an objective selection of the weights assigned to each of these dimensions. The use of this methodological approach guarantees that the weights used are unique and constitute a Pareto-optimal solution.
The terminal-approach used enables the analysis of the competitiveness among terminals in different ports, but also the intra-port competition between those terminals located in the same port. On the one hand, regarding the inter-terminal competition, the results show that terminals leading the competitiveness ranking are APM Terminals Maavslakte II, ECT Delta and MSC PSA European Terminal. On the other hand, the identification through the TCI of the leading terminals belonging to the same port and their differential with respect to the rest of the units and their evolution over time could allow conclusions to be drawn about the catalytic effect that these leaders may or may not be playing in their port environment.
The second contribution relies on the application of the TCI to container terminals located in Hamburg-Le Havre range. The assessment of competitiveness at the terminal and not port level is especially relevant in environments like the one considered here, with ports very close to each other and in which location is therefore not a differentiating factor.
The main limitations of this study are that variable cost is not analysed due to issues of data availability and that the connectivity indicator is only available at the port level and not at the terminal level. Moreover, the TPCI is only calculated for one year, 2019. The study of the TPCI over a longer period and the inclusion of additional geographical areas with different casuistry would allow us to delve deeper into the role that different dimensions play in the competitiveness of port terminals. As both a limitation and an area for further research, the efficiency of container terminals could be included as a component of the index by measuring inputs and outputs related to terminal operations.
This research was supported by the Generalitat Valenciana through the Conselleria de Educacion, ´ Universidades y Empleo (UE) through Grupos Emergentes (CIGE/2022/133), and by the Project PID2022-136805OB-I00, funded by MCIN/AEI/10.13039/501100011033/FEDER, UE.
Notes
Maasvlakte II in Rotterdam, Deurganckdock in Antwerp (+9.8 M TEU from 2005), CT4 in Bremerhaven (+3M TEU from 2009) and Port 2000 project in Le Havre (+1.85 M TEU from 2005)
Wu et al. (2016) introduce the concept of the degree of satisfaction of a DMU with respect to a weighting profile, measured as the distance from the DEA efficiency ratio to the efficiency ratio determined with the CSW.
One of the main factors determining the competitiveness of transhipment ports is the port charges and terminal handling cost. However, due to the restricted access to this data, we have not been able to include it in the TPCI.
Some factors such as number of berths, entrance channel, terminal area, warehouse area, draught, etc (Kim, 2016; Nayak et al., 2024; Souza et al., 2023). In our case, the infrastructure data was collected from Port Authorities and terminal operators’ websites.
PLSCI includes 6 variables that reflect shipping connectivity at port level: (1) The number of ship calls per week; (2) total deployed TEU capacity offered at the port; (3) The number of regular liner shipping services; (4) The number of liner shipping companies that provide services; (5) The average size in TEU of the ships deployed by the scheduled service with the largest average vessel size; (6) The number of other destination ports connected. Previous studies used the Liner Shipping Connectivity Index developed by UNCTAD (Abbes, 2015; Kammoun and Abdennadher, 2022) and the weekly frequency in long distance services (Souza et al., 2023).
The software MaxDEA was used to estimate the TCI.
In their recent study on the competitiveness of the port of Chittagong, Munim et al. (2022a, b) identified that connectivity was the most important factor for carriers, ranking above port service quality and port cost.
Such as terminal efficiency, terminal handling cost or infrastructure (Martínez Moya and Feo Valero 2017).

