


This paper investigates the announcement effect of shipping sale-and-leaseback (SLB) transactions. As an emerging source of financing, a growing deal of interest has been paid to the SLB. However, little is known about a variety of aspects of SLB transactions in the shipping industry. In this regard, this study examines the stock market reaction to the SLB announcements of shipping firms and their impact on shareholders' wealth.
A sample of 15 shipping SLB deals commenced by publicly listed Korean shipping companies during 2009–2023 are examined in this research. The announcement effect is measured by abnormal returns (AR) of their stocks based on the event study analysis.
It is found that the AR on the shipping SLB announcement date is, on average, −0.84% while there is no statistical significance. However, the results indicate that shareholders of shipping companies engaging in large-sized SLBs can experience positive AR around the announcement date.
This study is the first attempt to investigate the announcement effect of SLB transactions on the shipping industry and their impact on shareholders' wealth. The findings in this research can offer implications for the financing decisions of shipping companies and investment decisions of stock investors.
1. Introduction
In an industry that is characterized by uncertainty in income and asset value, financing and investment decisions could dictate the survival of a company. Indeed, financing has played a critical role in running a shipping business, and securing low-cost funds contributes to gaining competitive edge. According to Stopford (2009), capital costs account for 39% of the total cost for operating a bulk carrier. The shipping industry has traditionally met its funding requirement from bank financing in the form of loan agreements. In a rough estimation, it is widely accepted that three-fourths of the external financing of shipping companies comes from bank loans.
While there had been a gradual shift in diversifying funding sources for the period 1990 and 2000s when a number of shipping companies tapped the global capital market by listing on stock exchanges (Grammenos and Papapostolou, 2012), issuing high-yield bonds (Grammenos and Arkoulis, 2003) and raising ship funds (Drobetz and Tegtmeier, 2013), the landscape of shipping finance has drastically changed since the global financial crisis in 2008. In response to the credit crunch during the postcrisis period, many banks had reduced their exposure to the shipping industry (Gong et al., 2013) that was experiencing unprecedented freight market collapse triggered by a severe setback in the global economy.
A substantial part of the gap between the funding required by the shipping industry and bank credit provision in the post-crisis period was filled with capital granted by state-backed financial institutions, and this phenomenon was especially remarkable among export-credit agencies (ECAs) in the East Asian countries such as, China, Japan and South Korea (Korea hereinafter). For instance, according to data released by Petrofin Research, credit lending of the Bank of China to shipping had increased from $13.2bn in 2011 to $20bn in 2016 [1].
The role of credit facilities to shipping companies provided by state-backed institutions is also significant in Korea. As the world's 10th largest economy in terms of nominal gross domestic product (GDP) [2] is open to international trade with a trade-to-GDP ratio of 69.7%, averaged for the period of 2005–2020 [3], and the vast majority of its exports and imports are serviced by maritime transport [4], shipping is a major pillar of the Korean economy. In this regard, state-backed financial institutions (for example, Export–Import Bank of Korea, Korea Development Bank and Korea Trade Insurance Corporation) have introduced several financial-aid programs and provided the required capital to domestic shipping firms. As a result, the share of the public sector in the Korea's domestic shipping finance market read 90% in 2015, which is diametrically opposed to that in the pre-crisis period (Chun et al., 2017).
Among a variety of financial services provided by public financial institutions, this study pays particular attention to the sale-and-leaseback (SLB) program of the Korea Asset Management Corporation (KAMCO), a quasi-governmental organization specialized in resolving nonperforming loans, conducting corporate restructuring and managing state-owned properties. As seen in Figure 1, compared to other sectors, the shipping industry of Korea was experiencing severe financial distress after the shipping market collapse in 2009 until the unexpected freight rate recovery in 2020 resulting from disruptions in the global supply chain due to the COVID-19 pandemic.
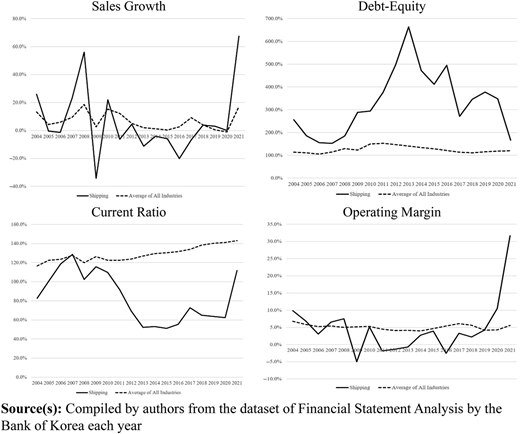
Comparison of major financial ratios between shipping and other industries in Korea (2004–2021)
Comparison of major financial ratios between shipping and other industries in Korea (2004–2021)
Against this background, the KAMCO introduced the SLB program in 2009 for the purpose of providing financial liquidity to Korean shipping companies. Although SLB deals take in various forms, in most cases, a shipping company sells its ship to a financial institution and then leases it back for the contract period. While the shipping company becomes a seller as well as a lessee in an SLB transaction, the financial institution acts as a buyer as well as a lessor (for more detailed description of shipping SLBs, see Figure 2).
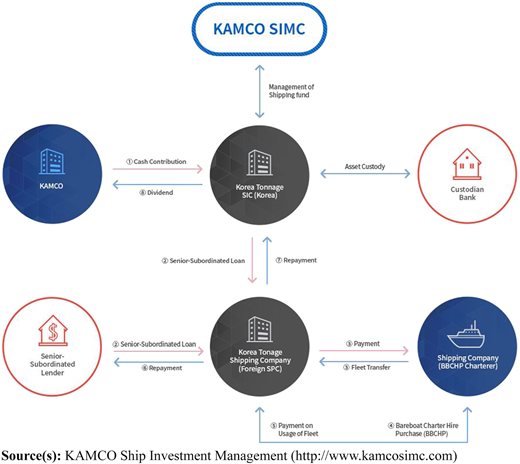
Earlier research on the motives of going for SLBs focuses on differences in marginal tax rates between the lessor and the lessee (Miller and Upton, 1976). Graham et al. (1998) document that firms with a low tax rate are highly likely to lease rather than purchase assets. In addition, Smith and Wakeman (1985) identify nontax drivers of SLBs such as financial contracting costs, financial distress and capital constraints. In the shipping literature, Yoon et al. (2023) find that securing financial liquidity is a main driver of going for SLBs.
However, little is known about the value creation effect of shipping SLBs. In this regard, this study investigates whether the announcement of shipping SLB transactions can create additional value to the shareholders of shipping firms. Using the event study analysis examining movements of stock prices around the announcement date, this study investigates the value creation effect of 15 shipping SLB deals commenced during 2009–2023. The results indicate that the average of the abnormal returns (ARs) on the SLB announcement date is −0.84%, but with no statistical significance. However, detailed analysis of individual transactions reveals that shareholders of shipping companies engaging in large-sized deals can benefit from SLBs. In addition, a positive stock market reaction was also found within three days after SLB announcements.
The rest of this paper is structured as follows: Section 2 reviews previous research on the announcement effect of SLBs. Section 3 describes the methodology employed in this research and the dataset. Section 4 provides empirical results. Finally, Section 5 discusses the findings of this study and their implications.
2. Literature review
While the SLB is a kind of emerging concept for the shipping industry, it is a frequently used financing method in the real estate market in which the history can be traced back to the late 1920s (Adams and Clarke, 1996). Therefore, the vast majority of SLB research highlights the real estate market. Since an SLB transaction combines a sales-and-purchase deal and a leasing contract, Grenadier (2005) shows that its equilibrium is determined by the interaction between the sale price and the rent rate. From the perspectives of both the seller/lessee and the buyer/lessor, SLBs come in several advantages. The seller/lessee can sell-off a low-performing asset while maintaining the use of it. Furthermore, the proceeds from selling the asset can be used for working capital management or business expansion. The buyer/lessor can save the cost pertaining to search tenants (the searching cost) as an SLB comes with (in most case) a long-term rent period (for more detailed description for the advantages of SLB transactions, see Adams and Clarke (1996), and Sirmans and Slade (2010)). Therefore, a stream of research examines the existence of price premiums in SLB deals. Sirmans and Slade (2010) document that buildings in SLBs are sold at 13% of premium to those in nonSLBs in the United States (US) real estate market. In addition, it has also been found that lessors require less yield for SLB transactions than nonSLBs when tenants possess higher covenant strength (Sanderson et al., 2019).
Assuming the efficiency in the stock market in that all publicly available information on a firm is reflected in its stock price, a voluminous body of research examines whether the announcement of SLBs can create additional value for shareholders. This is done by investigating the ARs on and the cumulative abnormal returns (CARs) around the announcement date. The majority of studies on this topic document the positive AR to shareholders of seller/lessee firms (Rutherford, 1990, 1992; Slovin et al., 1990; Allen et al., 1993).
However, the positive AR around the SLB announcement date are not constant, but vary by several factors. Devaney and Lizieri (2004) find that the impact of an SLB on corporate value is contingent on the capital structure, the use of the capital raised, and market attitudes towards management. Analyzing 71 events that occurred during the 1990s, Fisher (2004) shows that shareholders of lessee firms realize a significant abnormal return of 1.3% in SLBs with relatively short contract periods. In addition, it is found that the deal size matters. Grönlund et al. (2008) report the positive stock market reactions, by and large, to the SLBs with high transaction value to corporate market value in the European countries. Wells and Whitby (2012) document that the ARson the announcement date are positively associated with the price-earning ratio, which implies that the stock market reacts favorably to the SLB deals for business expansion. They also found a negative association between AR and capital structure, suggesting that SLBs for debt repayment fail to create additional value to shareholders. Whitby (2013) reports variations in AR by property types. Analysis of 404 SLB transactions commenced during 1980–2011 reveals significant positive returns for headquarters, retail shops and hotels, but no significant returns for properties for manufacturing, office and healthcare.
Despite a number of studies documenting positive AR, there is no unanimous agreement on the announcement effect of SLB transactions. Indeed, opposed to Wells and Whitby (2012 and Whitby (2013) finds a positive stock market reaction to SLBs in which the proceeds are used for debt reduction. Furthermore, Handa (1991) finds a negative announcement effect of SLBs when asymmetric information exists between managers and investors. Similarly, Adams and Clarke (1996) also report a negative impact of SLBs on the shareholder wealth in the United Kingdom, arguing that the stock market perceives an SLB as a signal of worsened operating cash flow situation of the lessee.
In stark contrast to research highlighting the real estate market, the SLB is an emerging topic in the maritime spectrum, and consequently, an under-explored research area. The only exception, to the best of our knowledge, is Yoon et al. (2023), who investigated the drivers of going for SLBs among Korean shipping companies. They find that shipping companies enter into SLBs to acquire financial liquidity from the capital obtained from selling ships. However, there is no evidence on the impact of shipping the SLB announcement on the corporate value and the shareholders' wealth. In this regard, this paper fills the research gap by investigating the stock market reaction to the shipping SLB announcement. By doing so, the findings in this paper can enrich shipping finance literature.
3. Methodology and data
The announcement effect of shipping SLBs is measured in the event study analysis suggested by Brown and Warner (1985). According to Fama (1970), the efficiency of a stock market can be categorized into three forms by the degree to which relevant information is reflected in the stock prices: weak form, semi-strong form and strong form. The event study analysis assumes a semi-strong form of market efficiency in that stock prices reflect all publicly available information simultaneously. Therefore, when the market participants (stock investors) regard an SLB announcement as positive news, the stock price goes up and the shareholders can benefit from the event and vice versa.
The assumption of stock market efficiency in event studies might appear too strong to be accepted for two reasons. First, the immediate stock market reaction to an announcement may not provide investors with enough time to evaluate the deal. In addition, pertaining to the above point, as the deal is unlikely to be fully understood, investors' valuation can be subject to heuristic bias (Kahneman et al., 1982). In this regard, Oler et al. (2008) argue that short-term based event study findings are likely to mislead the value creation effect and its implications in two cases. First, when an event is complex and affects various aspects of business operation (for example, mergers and acquisitions [M&As] and joint ventures), its long-term performance is hard to predict. Second, in stark contrast to frequently occurring events (for example, earnings announcements), the valuation of “non-routine” activities is difficult to learn from previous deals.
As shipping SLB transactions in this study are less frequently occurring events since the financial aid program was introduced only after 2009, a short-term event study analysis might not fully capture the value creation (or destruction) effect from the deals. Nonetheless, this study favors the short-term event study analysis. Foremost, the short-term analysis can provide less “contaminated” measures of the value creation from SLBs. Given the volatility of the freight rate, the business performance of a shipping firm for 3–5 years during the postSLB period is highly likely to be affected by market conditions. Therefore, long-run measures may fail to distinguish the impact of SLB transactions on corporate performance or value from that of other factors.
In addition, the vast majority of previous research shows that event-study measures are good indicators of the value creation effect of an event. Luo (2005) finds that short-run changes in stock prices around M&As significantly affect managerial decisions to complete the deals. In shipping research, the event study analysis has gained popularity in examining the value creation effect of M&A (Alexandridis et al., 2020; Alexandrou et al., 2014; Andreou et al., 2012; Darkow et al., 2008; Panayides and Gong, 2002) while to the best of our knowledge, there is only one study reporting the long-run results (Choi and Yoshida, 2013).
The announcement effect is measured by calculating the AR, the difference between the realized stock return at the SLB announcement date and its expected return as follows:
where is the abnormal return of shipping firm at day (the SLB announcement date); is the actual stock return of shipping firm at day and is the expected stock return of shipping firm at day .
The expected stock return (without the SLB event) is calculated from the relationship between the stock return of a shipping company and the stock market return for a certain period in the past as follows:
where is the realized stock market return at day ; is the company's abnormal performance relative to the stock market for the past period and is the sensitivity of the company's stock return to the stock market for the past period.
and are parameters obtained from the market model, a one factor regression model, as follows:
This process allows distinguishing the impact of the announced event on the stock prices from that of macroeconomic factors. There are two types of the events that affect a firm's valuation. The first one consists of firm-specific events that affect the stock price of a specific firm, such as announcements of M&As, CEO succession and new issuance of stocks and bonds, to name a few; the second one includes market-wide events that affect the stock prices of all listed firms, such as changes in GDP, interest rate, the unemployment rate and so on. By estimating a firm's stock returns with regard to changes in the benchmark (mostly the stock market index), the expected stock return of a firm can capture the impact of market-wide events. Therefore, the difference between the realized stock return and the expected stock return can be regarded as an AR.
The market model parameters are estimated over a long period (usually, 250 trading days or 1 calendar year) preceding the SLB announcement. The two most popular estimation windows are [−255, −6] and [−301, −64]. In this paper, the results are presented based on both estimation windows.
In addition to the ARs at the SLB announcement date, this study also investigates those for three days prior to the event and to three days after. Those results are used for calculating CARs for the event windows of [−1, +1], [−2, +2] and [−3, +3], respectively. The reason for the inclusion of ARs prior to the event date is to consider the leakage of information on SLB deals in the preannouncement period. Also, inclusion of ARs in the post-announcement period can reflect delayed stock market reaction. CARs are calculated as follows:
The sample consists of SLB transactions in which Korean shipping companies sell ships to KAMCO and lease them back for daily operation. Data for SLB transactions are collected from KAMCO Ship Investment Management, a subsidiary of KAMCO to address SLBs [5]. From its introduction in 2009 to April 2023, KAMCO has purchased 148 ships and leased them back to Korean shipping firms. Among them, 100 ships originally belonged to shipping firms listed on the Korea Exchange (KRX). However, there is no official announcement for SLBs from the listed shipping companies. This is because the announcement is mandatory only when the value of the tangible asset disposal is greater than 5% of the firm's assets. Therefore, instead of using the stock exchange announcements, this study relies on news articles released by KAMCO. This process allows the authors to find 15 SLB announcements for 50 ships previously owned by 7 Korean shipping firms. The list of SLB announcements and the details of transactions are presented in Table 1.
List of shipping SLB announcements
| Deal no. | Company | Announcement date | No. of SLB ships | Ship type |
|---|---|---|---|---|
| 1 | Hanjin Shipping | 13 July 2009 | 16 | Container (13), Bulker (3) |
| 2 | Hyundai Merchant Marine | 13 July 2009 | 1 | Bulker |
| 3 | Hanjin Shipping | 30 March 2010 | 1 | Bulker |
| 4 | Hyundai Merchant Marine | 30 March 2010 | 1 | Bulker |
| 5 | Heung-A Line | 30 March 2010 | 3 | Container (1), Tanker (2) |
| 6 | Korea Line Corporation | 01 July 2010 | 1 | Bulker |
| 7 | Korea Line Corporation | 12 August 2010 | 3 | Bulker |
| 8 | Hyundai Merchant Marine | 18 November 2011 | 1 | Container |
| 9 | STX | 27 June 2016 | 2 | Bulker |
| 10 | Korea Line Corporation | 27 June 2016 | 1 | Bulker |
| 11 | Intergis | 1 December 2016 | 2 | Bulker |
| 12 | Hyundai Merchant Marine | 1 December 2016 | 1 | Container |
| 13 | Hyundai Merchant Marine | 7 March 2017 | 10 | Container |
| 14 | Korea Line Corporation | 8 May 2017 | 5 | Bulker |
| 15 | Pan Ocean | 8 May 2017 | 2 | Bulker |
Source(s): Authors’ work, sorted by announcement date
The dataset for stock prices of shipping companies is collected from the Market Data System of KRX [6] and the stock returns are calculated by taking the logarithmic difference between daily prices. The stock market index is proxied by the Korea Composite Stock Price Index (KOSPI), the price index of all common stocks traded on the KRX.
4. Empirical results
Table 2 shows the average ARs of individual shipping SLB announcements for the periods of [−1, +1], [−2, +2] and [−3, +3], respectively. It seems that there is no unequivocal agreement regarding the positive or negative announcement effect of shipping SLBs. Based on the observations for the estimation window of [−255, −6], slightly over half of shipping SLB announcements result in negative ARs. A similar observation is found in the results for the estimation window of [−301, −64].
Average of abnormal returns for individual shipping SLB announcements
| Estimation window [−255, −6] | Estimation window [−301, −64] | |||||
|---|---|---|---|---|---|---|
| Deal no. | [−1, +1] | [−2, +2] | [−3, +3] | [−1, +1] | [−2, +2] | [−3, +3] |
| 1 | 0.83% | 1.59% | 1.19% | 0.62% | 1.39% | 0.99% |
| 2 | −0.73% | −0.63% | 0.19% | −0.84% | −0.69% | 0.12% |
| 3 | −0.44% | −0.55% | 0.16% | −0.35% | −0.51% | 0.20% |
| 4 | −0.91% | −0.53% | 0.32% | −0.68% | −0.32% | 0.54% |
| 5 | 0.57% | 0.46% | 0.98% | 0.63% | 0.43% | 0.96% |
| 6 | 0.40% | −0.11% | −0.05% | 0.50% | −0.01% | 0.02% |
| 7 | 1.53% | 1.16% | 1.19% | 1.67% | 1.29% | 1.31% |
| 8 | −2.03% | −1.64% | −1.25% | −1.94% | −1.54% | −1.10% |
| 9 | 0.09% | 0.20% | −0.16% | −0.30% | 0.02% | −0.22% |
| 10 | −0.39% | −0.39% | −0.48% | −0.38% | −0.37% | −0.45% |
| 11 | −0.13% | −0.94% | −0.88% | 0.16% | −0.65% | −0.59% |
| 12 | −0.17% | −0.48% | −0.20% | 0.13% | −0.18% | 0.07% |
| 13 | 1.23% | 0.68% | 0.70% | 1.43% | 1.02% | 0.99% |
| 14 | −1.58% | −1.97% | −0.83% | −1.52% | −1.90% | −0.76% |
| 15 | −1.49% | −2.50% | −0.99% | −1.46% | −2.47% | −0.99% |
Source(s): Authors’ work
Table 3 reports the results of the statistical tests for the mean and median of AR for shipping SLB announcements. It is found that, at the announcement date, the average of ARs is −0.84% and −0.75% for the estimation windows of [−255, −6] and [−301, −64], respectively. However, there is statistical significance. This result implies that shipping SLBs fail to create additional value to the shareholders of Korean shipping firms. The only significant and positive stock market reaction was found after three days of SLB announcements. The is 1.26% for the window of [−255, −6] and 1.38% for the window of [−301, −64], and these results are significant at the 10% level.
Abnormal returns for shipping SLB announcements
| Estimation window [−255, −6] | Estimation window [−301, −64] | |||||||
|---|---|---|---|---|---|---|---|---|
| Mean | Median | Mean | Median | |||||
| ARt−3 | 0.57% | [0.8067] | 0.73% | [0.7667] | 0.63% | [0.8985] | 0.87% | [0.9371] |
| ARt−2 | −0.80% | [−1.6699] | −0.96% | [1.3915] | −0.71% | [−1.5184] | −0.94% | [1.3347] |
| ARt−1 | −0.63% | [−1.302] | −0.57% | [1.0507] | −0.66% | [−1.2434] | −0.49% | [1.0507] |
| ARt | −0.84% | [−1.2704] | −1.14% | [1.0507] | −0.75% | [−1.1432] | −1.04% | [1.0507] |
| ARt+1 | 0.83% | [1.3734] | −0.13% | [0.9371] | 0.94% | [1.5228] | −0.01% | [0.9939] |
| ARt+2 | −0.44% | [−0.8072] | 0.16% | [0.3124] | −0.32% | [−0.6004] | 0.18% | [−0.0284] |
| ARt+3 | 1.26% | [1.8509] | 0.25% | [1.3347] | 1.38% | [2.0769] | 0.44% | [1.5051] |
| CAR[−1, +1] | −0.64% | [−0.8045] | −0.50% | [0.7667] | −0.46% | [−0.5737] | −0.90% | [0.5964] |
| CAR[−2, +2] | −1.88% | [−1.3044] | −2.38% | [1.2211] | −1.49% | [−1.0503] | −1.59% | [1.0507] |
| CAR[−3, +3] | −0.06% | [−0.0399] | −0.32% | [0.0852] | 0.51% | [0.3709] | 0.49% | [0.3692] |
| CAR[0, +1] | −0.01% | [−0.0188] | −0.62% | [−0.0284] | 0.19% | [0.2423] | −0.33% | [0.2556] |
| CAR[0, +2] | −0.45% | [−0.4227] | 0.88% | [0.1988] | −0.13% | [−0.1216] | 1.56% | [0.142] |
| CAR[0, +3] | 0.80% | [0.8397] | 1.09% | [0.6532] | 1.25% | [1.3243] | 1.41% | [1.1075] |
Note(s): 1. *indicates the statistical significance at the 10% level
2. Numbers in [.] are t-statistics for mean and the value of Wilcoxon signed rank for median, respectively
Source(s): Authors’ work
Despite the positive AR on the t+3 date, the results indicate that there is no significant impact on the wealth of shipping firms' shareholders around the SLB deals. Rather, in most cases, CARs in the 3 windows ([−1, +1], [−2, +2] and [−3, +3]) are negative without statistical significance, excepting for CAR [−3, +3] in the estimation window of [−301, −64].
As the positive stock market reaction is found after the deal announcements, this study goes further by examining CARs in the post-announcement period. This is done by investigating CAR [0, +1], CAR [0, +2] and CAR [0, +3]. Although there are some observations of positive CARs (especially CAR [0, +3] for both estimation windows), there is no significant value creation or destruction effect of shipping SLB transactions.
However, the results above seem less than half a story. Further analysis of individual SLB deals reveals that the negative impact (without statistical significance) of the SLB announcement is largely driven by single-ship transactions. Although the results for individual deals fail to draw statistical inference owing to the low number of observations, there is a clear distinction in the value creation effect between single-ship and multi-ship SLB transactions, at least, in terms of the average. Table 4 shows the ARs for individual SLB deals. Based on the results of the estimation window [−255, −6] in Panel A of Table 4, the average of SLBs in which multiple ships are sold is −0.57% while that for single-ship transactions is −1.15%. Particularly, remarkable observations are found in Deal No.1 and No.13 in which Hanjin Shipping and Hyundai Merchant Marine sold two-digit numbers of ships in 2009 and 2017, respectively. Furthermore, multiple-ship transactions show, by and large, positive ARs after the announcement date with 2.06% (t+1), −1.04% (t+2) and 2.49% (t+3). These results remain unchanged for the estimation window [−301, −64] in Panel B of Table 4.
Abnormal returns for individual shipping SLB announcements
| Deal no. | No. of SLB ships | t−3 | t−2 | t−1 | t | t+1 | t+2 | t+3 |
|---|---|---|---|---|---|---|---|---|
| Panel A: estimation window [−255, −6] | ||||||||
| 1 | 16 | −2.09% | 2.93% | −0.10% | 3.04% | −0.45% | 2.53% | 2.45% |
| 2 | 1 | 2.59% | −2.53% | 1.74% | −2.93% | −1.01% | 1.60% | 1.86% |
| 3 | 1 | 3.58% | 0.64% | −0.70% | −0.49% | −0.13% | −2.06% | 0.25% |
| 4 | 1 | 4.70% | −1.63% | −1.94% | 0.47% | −1.25% | 1.67% | 0.20% |
| 5 | 3 | 3.84% | 0.76% | −1.82% | −2.53% | 6.05% | −0.19% | 0.73% |
| 6 | 1 | 1.22% | −2.19% | −0.57% | 2.81% | −1.03% | 0.46% | −1.02% |
| 7 | 3 | 3.18% | 0.53% | 0.89% | 1.98% | 1.73% | 0.67% | −0.63% |
| 8 | 1 | 0.73% | −2.36% | −2.30% | −1.63% | −2.17% | 0.28% | −1.33% |
| 9 | 2 | 0.02% | 0.34% | −3.05% | −0.25% | 3.56% | 0.38% | −2.12% |
| 10 | 1 | −0.43% | −0.96% | 0.97% | −1.14% | −1.00% | 0.16% | −0.95% |
| 11 | 2 | −5.33% | −2.53% | −3.04% | −1.33% | 3.99% | −1.77% | 3.88% |
| 12 | 1 | 1.11% | −1.52% | 2.12% | −5.14% | 2.52% | −0.36% | −0.13% |
| 13 | 10 | −2.10% | 0.41% | 1.07% | 1.96% | 0.67% | −0.73% | 3.61% |
| 14 | 5 | −1.30% | 0.40% | −3.50% | −2.56% | 1.30% | −5.48% | 5.32% |
| 15 | 2 | −1.16% | −4.31% | 0.79% | −4.88% | −0.37% | −3.74% | 6.72% |
| Average | Multiple Ships | −0.62% | −0.18% | −1.09% | −0.57% | 2.06% | −1.04% | 2.49% |
| Single Ship | 1.93% | −1.51% | −0.10% | −1.15% | −0.58% | 0.25% | −0.16% | |
| Panel B: estimation window [−301, −64] | ||||||||
| 1 | 16 | −2.29% | 2.74% | −0.30% | 2.78% | −0.63% | 2.38% | 2.27% |
| 2 | 1 | 2.52% | −2.59% | 1.67% | −3.12% | −1.05% | 1.63% | 1.82% |
| 3 | 1 | 3.55% | 0.54% | −0.63% | −0.42% | −0.01% | −2.02% | 0.43% |
| 4 | 1 | 4.90% | −1.44% | −1.72% | 0.69% | −1.02% | 1.89% | 0.44% |
| 5 | 3 | 3.67% | 0.47% | −1.78% | −2.50% | 6.17% | −0.22% | 0.95% |
| 6 | 1 | 1.24% | −2.02% | −0.49% | 2.91% | −0.91% | 0.46% | −1.05% |
| 7 | 3 | 3.27% | 0.66% | 1.05% | 2.17% | 1.78% | 0.79% | −0.55% |
| 8 | 1 | 0.87% | −2.07% | −2.55% | −1.26% | −2.00% | 0.18% | −0.89% |
| 9 | 2 | 0.21% | 0.20% | −4.42% | −0.24% | 3.75% | 0.80% | −1.83% |
| 10 | 1 | −0.39% | −0.94% | 0.94% | −1.11% | −0.96% | 0.21% | −0.91% |
| 11 | 2 | −5.03% | −2.24% | −2.75% | −1.04% | 4.27% | −1.48% | 4.18% |
| 12 | 1 | 1.37% | −1.24% | 2.38% | −4.85% | 2.87% | −0.04% | 0.00% |
| 13 | 10 | −2.00% | 1.16% | 1.33% | 2.02% | 0.95% | −0.34% | 3.79% |
| 14 | 5 | −1.23% | 0.46% | −3.44% | −2.51% | 1.38% | −5.42% | 5.40% |
| 15 | 2 | −1.21% | −4.29% | 0.84% | −4.72% | −0.50% | −3.68% | 6.64% |
| Average | Multiple Ships | −0.58% | −0.10% | −1.18% | −0.50% | 2.15% | −0.90% | 2.61% |
| Single Ship | 2.01% | −1.39% | −0.06% | −1.02% | −0.44% | 0.33% | −0.02% | |
Source(s): Authors’ work
Finally, the results for CARs of individual SLB transactions are presented in Table 5. As seen in Table 4 for the comparison of ARs between multiple-ships and sing-ship transactions, the results for CARs show a clear-cut distinction between the two groups. Based on the results of the estimation window [−25, −6] (in Panel A of Table 5), the average of CARs in the multiple-ships deals is positive in the windows of [−1, +1], [−3, +3], [0, +1], [0, +2] and [0, +3], while that in the single-ship transactions is negative in all the windows. Similar results are observed in the estimation window [−301, −64] in Panel B of Table 5.
Cumulative abnormal returns for individual shipping SLB announcements
| Deal no. | No. of SLB ships | [−1, +1] | [−2, +2] | [−3, +3] | [0, +1] | [0, +2] | [0, +3] |
|---|---|---|---|---|---|---|---|
| Panel A: estimation window [−255, −6] | |||||||
| 1 | 16 | 2.49% | 7.96% | 8.32% | 2.59% | 5.13% | 7.58% |
| 2 | 1 | −2.20% | −3.13% | 1.32% | −3.94% | −2.34% | −0.48% |
| 3 | 1 | −1.33% | −2.74% | 1.09% | −0.62% | −2.68% | −2.43% |
| 4 | 1 | −2.72% | −2.67% | 2.22% | −0.78% | 0.89% | 1.09% |
| 5 | 3 | 1.70% | 2.28% | 6.85% | 3.52% | 3.33% | 4.07% |
| 6 | 1 | 1.21% | −0.53% | −0.32% | 1.78% | 2.23% | 1.22% |
| 7 | 3 | 4.59% | 5.79% | 8.33% | 3.70% | 4.37% | 3.74% |
| 8 | 1 | −6.10% | −8.18% | −8.78% | −3.80% | −3.53% | −4.86% |
| 9 | 2 | 0.26% | 0.98% | −1.12% | 3.31% | 3.69% | 1.57% |
| 10 | 1 | −1.17% | −1.97% | −3.35% | −2.14% | −1.98% | −2.93% |
| 11 | 2 | −0.39% | −4.69% | −6.14% | 2.65% | 0.88% | 4.76% |
| 12 | 1 | −0.50% | −2.38% | −1.40% | −2.62% | −2.98% | −3.11% |
| 13 | 10 | 3.70% | 3.39% | 4.89% | 2.63% | 1.90% | 5.51% |
| 14 | 5 | −4.75% | −9.83% | −5.81% | −1.25% | −6.73% | −1.41% |
| 15 | 2 | −4.46% | −12.51% | −6.95% | −5.25% | −9.00% | −2.28% |
| Average | Multiple Ships | 0.39% | −0.83% | 1.05% | 1.49% | 0.45% | 2.94% |
| Single Ship | −1.83% | −3.09% | −1.32% | −1.73% | −1.48% | −1.64% | |
| Panel B: estimation window [−301, −64] | |||||||
| 1 | 16 | 1.85% | 6.97% | 6.96% | 2.15% | 4.53% | 6.81% |
| 2 | 1 | −2.51% | −3.47% | 0.87% | −4.17% | −2.55% | −0.72% |
| 3 | 1 | −1.06% | −2.54% | 1.43% | −0.43% | −2.45% | −2.02% |
| 4 | 1 | −2.04% | −1.59% | 3.75% | −0.33% | 1.56% | 2.00% |
| 5 | 3 | 1.88% | 2.13% | 6.75% | 3.66% | 3.44% | 4.39% |
| 6 | 1 | 1.51% | −0.05% | 0.14% | 1.99% | 2.46% | 1.41% |
| 7 | 3 | 5.01% | 6.46% | 9.17% | 3.95% | 4.74% | 4.19% |
| 8 | 1 | −5.81% | −7.70% | −7.71% | −3.26% | −3.08% | −3.97% |
| 9 | 2 | −0.90% | 0.09% | −1.53% | 3.51% | 4.31% | 2.48% |
| 10 | 1 | −1.13% | −1.86% | −3.16% | −2.07% | −1.86% | −2.77% |
| 11 | 2 | 0.47% | −3.25% | −4.10% | 3.23% | 1.74% | 5.92% |
| 12 | 1 | 0.39% | −0.88% | 0.49% | −1.98% | −2.02% | −2.02% |
| 13 | 10 | 4.30% | 5.12% | 6.91% | 2.97% | 2.63% | 6.43% |
| 14 | 5 | −4.56% | −9.52% | −5.35% | −1.12% | −6.54% | −1.14% |
| 15 | 2 | −4.37% | −12.33% | −6.90% | −5.21% | −8.89% | −2.25% |
| Average | Multiple Ships | 0.46% | −0.54% | 1.49% | 1.64% | 0.75% | 3.35% |
| Single Ship | −1.52% | −2.59% | −0.60% | −1.46% | −1.13% | −1.16% | |
Source(s): Authors’ work
5. Conclusions
This study investigates, for the first time in the shipping literature, the effect of the announcement of shipping SLB transactions and their impact on shareholders' wealth. Examining the stock market reaction to shipping SLB announcements using event study analysis, this study finds two important observations: First, in stark contrast to the findings in the vast majority of research on the announcement effect in the real estate market, shipping SLBs fail to create additional value to the shareholders. Rather, despite statistical insignificance, the average of ARs at the announcement date was negative. Second, however, there is a distinction in the value creation effect by the deal size. While the negative announcement effect is, by and large, driven by single-ship SLB deals, positive ARs and CARs are found in relatively large-sized transactions in which multiple ships are traded. This result is consistent with the finding in Grönlund et al. (2008) documenting that the ARs are positively associated with the weight of the deal value relative to a firm's assets.
The possible explanation for the positive ARs and CARs in relatively large-sized deals is that an SLB is a mechanism for revealing the hidden value of latent assets to the market (Grönlund et al., 2008). As observed in Figure 1, financial distress among Korean shipping companies was severe after the financial turmoil in 2008. In addition, given the low level of shipping freight rate during the postcrisis period, most stocks of shipping companies are highly likely to be undervalued. In this situation, the stock market perceives the announcement that a shipping company goes for a large-sized SLB deal as a signal of corporate restructuring. Indeed, Brennan (1990) argues that stock prices fail to reflect the value of a firm's assets in the existence of asymmetric information between managers and investors and that information asymmetry is particularly evident in latent assets like real estates. Therefore, by selling low-yielding assets (with little disruptions to business operation) as well as securing financial liquidity from the deal, a shipping company and its shareholders can benefit from SLBs and the stock market reacts positively to the announcement.
The findings of this study offer valuable implications for both financial managers of shipping firms and stock market investors. Since the credit crunch following the global financial crisis in 2008, SLB has emerged as one of the promising alternative funding sources in the shipping industry. Financial managers of shipping companies can analyze the benefits of SLB compared to direct and external debt-financing, and make decisions on the capital structure for the purpose of maximizing the corporate value. Moreover, stock market investors can regard an SLB transaction, wherein a significant share of a firm's tangible assets is traded, as a process of revealing undervalued assets, and construct their investment portfolios with better risk-return profiles.
Despite the important findings and valuable contributions of this study, limitations call for further research for a better understanding of shipping SLBs. First, empirical research on shipping SLBs can be augmented with more observations and can provide more reliable results with better statistical inference. Second, the comparison of SLBs in different countries can offer more comprehensive evidence on the announcement effect. Finally, the consideration of fleet structure (the ratio of self-owning and chartering) of individual shipping companies (Jin et al., 2022) is able to enrich empirical evidence on the motives and value creation of shipping SLBs.
The authors would like to sincerely thank an anonymous reviewer for making this constructive suggestion.
Funding: This work was supported by the 4th Maritime Port Logistics Training Project from the Ministry of Oceans and Fisheries (Republic of Korea) and the Korea Maritime and Ocean University Research Fund.
Notes
Petrofin Research, Key Developments and Growth in Global Ship Finance, each year.
World Bank (https://data.worldbank.org/indicator/NY.GDP.MKTP.CD), accessed on 30th June 2023.
Korea Statistical Information Service (https://kosis.kr/statHtml/statHtml.do?orgId=101&tblId=DT_2KAA806), accessed on 5th July 2023.
According to the data of the Korea International Trade Association (https://stat.kita.net/stat/kts/port/PortImpExpList.screen), shipping service covers 99.8% of Korea's exports and imports in terms of weight.
http://www.kamcosimc.com/public_html/fund/fund_info_list.asp, accessed on 24 February 2023.
Data availability statement: The data used in this paper are available from the corresponding author upon reasonable request.
Declaration of interest statement: The authors declare no conflict of interest.

