


Many experts suggest that the human being explore marine resources and marine new energy sources to alleviate the shortage of land resources and the ecological degradation. However, island coastal zones are considered to be fragile ecosystems; their geographical location and natural characteristics, their biodiversity and associated ecosystems, and their exposure to diverse land and sea conditions all make them highly vulnerable to environmental changes and human activities. Therefore, it is necessary to achieve the goals of environmental protection and sustainable development on the basis of a comprehensive evaluation and understanding of islands.
Due to the importance of island groups, this paper conducts evaluation studies on them. Using the Delphi, AHP and TOPSIS methods, this study evaluated quantitatively the comprehensive development level and comprehensive development potential of island groups in terms of resources, natural environment, economy and society. Innovatively using them as two subsystems, the present study combined the coupling coordination model and the obstacle factor calculation method.
The prospective index of comprehensive development was applied to the Changdao Island Group in Yantai, Shandong Province as an example, and the final evaluation revealed that the comprehensive development prospect of this island group had an upward trend from 2010 to 2017. Future efforts should be made to improve its economic and social conditions and economic development status, apart from promoting its comprehensive development by improving human resources management, increasing the GDP growth rate, and improving fresh water and electricity supply.
This study takes the integrated development level of the island and the integrated development potential of the island as two subsystems, and the innovative application of the coupling coordination degree model is used to calculate the integrated development index of the island to understand the development status of the island area. On the basis of this model, the obstacle factor identification method is designed to identify the main obstacle factors, and on the basis of evaluation and identification, specific measures to ensure the sustainable development of the island area are effectively proposed.
1. Introduction
Owing to rapid urbanization and excessive urban sprawl, the use of coastal and island resources has become a hot issue in the debate on protecting the ecological environment and achieving sustainable development (Azab and Noor, 2003). In “World Population Prospects 2019” (John, 2020), the United Nations Department of Economic and Social Affairs reported that the world population is expected to increase from the current 7.7 billion to 8.5 billion in 2030 and 9.7 billion in 2050 although it is aging and its growth is slowing. Population theories have evolved from resource carrying capacity, environmental carrying capacity to ecological carrying capacity (Malthus, 1798; Arrow et al., 1995; Seidl and Tisdell, 1999; Xu et al., 2010; Martire et al., 2015). Many experts suggest that the human being explore marine resources and marine new energy sources to alleviate the shortage of land resources and the ecological degradation. However, island coastal zones are considered to be fragile ecosystems; their geographical location and natural characteristics, their biodiversity and associated ecosystems, and their exposure to diverse land and sea conditions all make them highly vulnerable to environmental changes and human activities (Sekhar, 2005; Hasanzadeh et al., 2013). Therefore, islands should be developed comprehensively to meet the goals of environmental protection and sustainable development.
China has a mainland coastline of 18,000 km and an island coastline of 14,000 km (Cai, 2013). These areas support more than 70% of the large cities and half of the population, and produce 55% of the GDP (Lin et al., 2009). China's islands, which are inseparable from its “blue land,” are pivotal to answering the country's call to “care for the ocean, understand the ocean, and manage the ocean.” In 2012, the Chinese government announced that it will develop the marine industry as part of its national strategy (Xie, 2014). This led to a new era in which the country promotes the rapid and stable development of its island areas since these areas are pathways for implementing the strategy of maritime power.
China's current island development model is generally divided into three types: fishery development, port industry development and tourism development. Island fishery development is mainly composed of aquaculture and leisure fisheries, which are represented by marine farming and Yujiale respectively. Yujiale, a family-based form of tourism, promotes the lifestyles and cultures of fishing communities by facilitating host-guest interactions that emphasize tourists' participatory experiences (Chen and Ren, 2007; Tao, 2008; Xiong et al., 2011). Island port industry development depends more on shoreline conditions, making it the least common type of island development among the three major categories. One of the successful cases is Yangshan Port, which is located on Xiaoyangshan Island in the rugged archipelago sea area of Zhejiang Province. It is 32 km away from Luchao Port, Nanhui District, Shanghai, and 104 km away from the international ocean shipping channel. The total length of the port channel is 67 km. Yangshan Port is the nearest natural port with a depth of more than 15 m from Shanghai. From the East China Sea Bridge to Shanghai's comprehensive transportation network, it provides access to the advantages of Shanghai's vast economic hinterland and sufficient container resources, and will become one of the world's largest container port areas. Island tourism has gradually become the main method of island development in China. Generating income and job opportunities for island communities, tourism has also become an important economic development tool to overcome the constraints of small islands and the decline of marine resources (Lockhart, 1997; Wall and Mathieson, 2006; Lovelock et al., 2010; Porter et al., 2015).
Considerable environmental and social problems have been documented in previous research, including environmental degradation, overuse of resources and infrastructure, and social and cultural changes to indigenous societies (Davies, 1996; Filho, 1996; Guthunz and Krosigk, 1996; Wall and Mathieson, 2006; Cheng et al., 2013). Meanwhile, experts and scholars selected appropriate mathematical models, constructed an evaluation index system, and evaluated the islands (Xu et al., 2020; Zhang et al., 2020; Yin, 2020; Yan and Zhang, 2021). However, the number of existing studies is small, and the direction of evaluation is basically biased towards a certain direction. Therefore, whatever methods should be chosen in the island development, specific plans should be tailored to the development goals, status and obstacles of an island area. In view of this, this study investigated the conditions of island development in China from 2010 to 2017. Based on the results, it proposes a comprehensive development path for the Changdao Island Group, an important island group in northern China. It is hoped that the proper development of China's island areas will create conditions that are conducive to strengthening its maritime power.
In fact, the TOPSIS evaluation method used in this article has been widely used in the evaluation in many fields; there is, however, almost no comprehensive evaluation research on islands. Meanwhile, there is no research to deeply study the main obstacles to their development. Therefore, this article conducts an in-depth analysis of the example island groups from these two aspects.
The objectives of this study are threefold: (1) to formulate an evaluation model for the comprehensive development index that can fully reflect the development of the island group, and provide better understanding of the development of the Changdao Island Group from 2010 to 2017; (2) to identify the main obstacles to the development of the Changdao Island Group from 2010 to 2017, and formulate specific development paths based on the evaluation results; and (3) to offer practical recommendations to ensure the sustainable development of the Changdao Island Group based on the research findings.
2. Materials and methods
2.1 Research area
The Changdao Island Group is composed of 151 islands, including South Changshan Island, North Changshan Island, Miao Island and Daheishan Island and so on, of which only 10 islands are inhabited. The small islands of the island group have different natural, economic, social and cultural conditions. Figure 1 show that the Changdao Island Group is under the jurisdiction of the People’s Government of Changdao County, Yantai, Shandong Province. Located at the intersection of the Yellow Sea and the Bohai Sea, it is the only island county in Shandong Province. The Changdao Island Group, which has abundant landscape resources and a long history and culture, has a total land area of 53.17 km2, a total sea area of 3,541 km2 under its jurisdiction, and a total island coastline of 146.14 km.
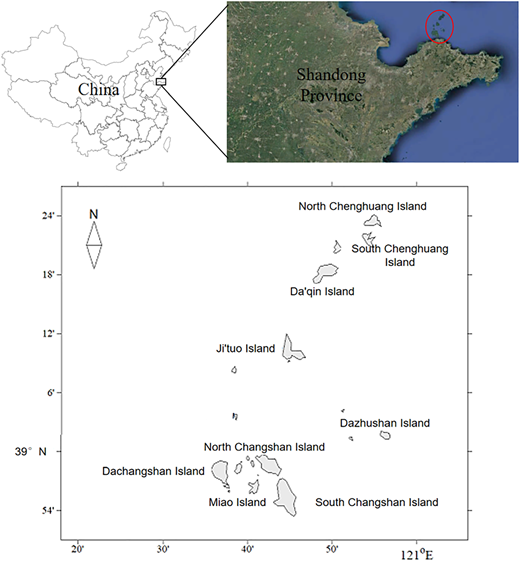
The Changdao Island Group has a temperate monsoon climate. Meteorological statistics show that it has an average annual temperature of 11.9 °C and an average annual rainfall of 560 mm. It is characterized as having a mild climate, adequate rainfall and moderate air humidity (Changdao County Government, 2019). There are low mountains and hills in most of the islands in the Changdao Island Group, while the coastal area has a small section of plain terrain. The highest and lowest elevations in this island group are 202.8 m and 7.2 m respectively.
2.2 Research method
2.2.1 Weighting method
This study employed a weighting method combining the Delphi method and analytic hierarchy process (AHP) technique to calculate the weight value of the corresponding evaluation index for the two evaluation index systems more objectively. The Delphi method is an expert consultation method. Back-to-back consultations with well-known experts and scholars in related fields were carried out to predict the future market opinions or judgment methods (Feng, 2006). As an analytical method for calculating the weights of different levels, the AHP simulates human logical thinking processes as much as possible, and decomposes a complex multi-objective decision-making system into multiple levels of each component evaluation factor. Subsequently, a comparative method with a 1–9 scale was used to determine the relative importance of each factor in each level. It simplifies the multi-level index weight assignment to compare the importance of each index relative to the upper criterion level, which in turn facilitates the objective assignment of each index at multiple levels (Xu, 2005).
2.2.2 Evaluation method of the prospective index of island-group comprehensive development
2.2.2.1 Method of two-subsystem evaluation
This study used the Technique for Order of Preference by Similarity to Ideal Solution (TOPSIS) to calculate the prospective index of island-group comprehensive development. Proposed initially by C. L. Hwang and K. Yoon in 1981, this evaluation method ranks the method based on the proximity of a limited number of evaluation objects to the idealized target. It is an evaluation of the relative advantages and disadvantages of existing objects (Zhang and Wu, 2006). Figure 2 shows the specific process used in this study.
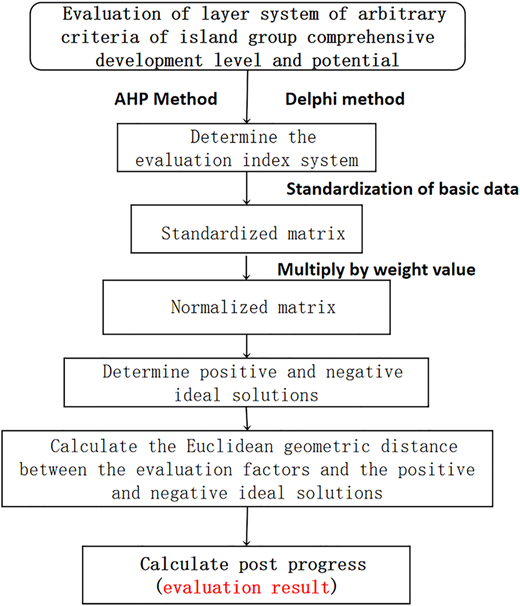
The first step was to build a standardized matrix. The initial evaluation matrix was set to X.
The normalization method was used to calculate Formula (1):
The original data, which is the initial value of the ith index of the jth island group in each year in the study period, were normalized to get the matrix X*.
In Formula (1), , where m is the corresponding mth evaluation index, and , where n is the evaluation object of different island groups in different years. In this study, indicators that led to a positive evaluation were considered as positive indicators, while those that led to a negative evaluation were considered as negative indicators.
The second step was to construct a standardized evaluation matrix. The normalization matrix was multiplied with the corresponding weight value to get the normalized evaluation matrix Y.
The third step was to determine the positive and negative ideal solutions. The evaluation indicators were divided into positive indicators and negative indicators . was set as the positive ideal solution for the ith indicator in the evaluation data for each island group within the study period. The maximum value of the positive index and the minimum value of the negative index were selected from each index. Through these steps, both the positive and negative ideal solutions for the evaluation of the relevant elements of island-group comprehensive development were determined.
The fourth step was to calculate the distance from the positive and negative ideal solutions. The distance was calculated using the Euclidean distance measurement formula (Li and Qiu, 2016). was set to the distance of the ith index, while was set to the distance of the ith index. The corresponding calculation formulas were as follows:
In Formulas (4) and (5), , . was the standard value after the weighted normalization calculation of the ith indicator of the jth island group in that year, while and were the value corresponding to the positive ideal solution and negative ideal solution of this index.
The fifth step was to calculate the post progress. The closeness degree, expressed as , refers to the closeness level of the relative relationship between the evaluation object and the positive and negative ideal solutions. The calculation formula was as follows:
In the TOPSIS model, the optimal and worst solutions are two ideal solutions or basic concepts that are unlikely to exist in the actual operational process.
2.2.2.2 Method of prospective index evaluation
Figure 3 shows that the prospective index of island-group comprehensive development was formed by combining the comprehensive development level and comprehensive development potential, which are two independent systems. The comprehensive development level is the evaluation of the current development of the island group, while the comprehensive development potential is the evaluation that predicts the continuous development of the island group. The coupling coordination degree model, which was used to evaluate the prospective index of island-group comprehensive development, was calculated as follows:
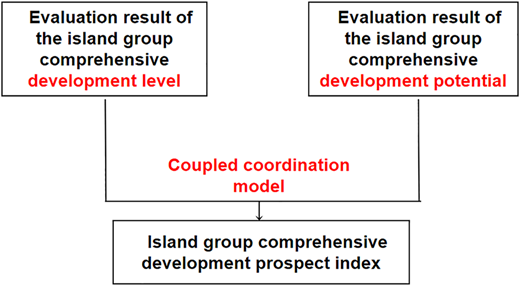
Evaluation process of the prospective index of island-group comprehensive development
Evaluation process of the prospective index of island-group comprehensive development
F represents the prospective index of island-group comprehensive development, which is the coupling coordination index of the evaluation results of the comprehensive development level and comprehensive development potential; C represents the coupling index between the evaluation results of the comprehensive development level and comprehensive development potential; T represents the prospective index of island-group comprehensive development; u1 represents the island-group comprehensive development level system; u2 represents the island-group comprehensive development potential system; and α and β represent the coefficients of the two systems respectively.
After soliciting feedbacks from relevant experts and scholars, the comprehensive development level and comprehensive development potential were found to be equally important. Hence, both coefficients were set to 0.5. When applying the model to calculate the coupling coordination degree, it is necessary to carry out dimensionless processing to eliminate the influence of dimension first.
2.2.3 Calculation and identification of main obstacle factors
To measure the main obstacle factors of the island group comprehensive development level and comprehensive development potential, the index factor contribution rate, the index factor deviation and the index factor obstacle degree were applied.
The index factor contribution was calculated as follows:
where represents the weight value of the jth indicator, and indicates the weight of the jth index factor corresponding to the criterion layer.
The index factor deviation was calculated as follows:
where is the deviation degree of the index factor of the jth island-group comprehensive evaluation index factor in the i year, and represents the standardized value of the evaluation index factor of the jth item in year i.
The index factor obstacle degree was calculated as follows:
where indicates the degree of impact of the index j index in the ith year on the relevant elements of island-group comprehensive development, m represents a total of m evaluation index factors, and is the obstacle degree of each evaluation index factor of the island-group comprehensive development level and comprehensive development potential.
Figure 4 shows how the top 10 obstacle factors of the total obstacle level of the comprehensive development level and comprehensive development potential of the Changdao Island Group from 2010 to 2017 were obtained. The combination of the main obstacle factors for each independent system was defined as the main barrier factor for the prospective index of island-group comprehensive development. Formulas (10)–(12) were used to calculate and analyze the coupling coordination degree of the two obstacle degrees of the common obstacle factor, which was defined as the obstacle degree of the main obstacle factor of the prospective index of comprehensive development of the Changdao Island Group.
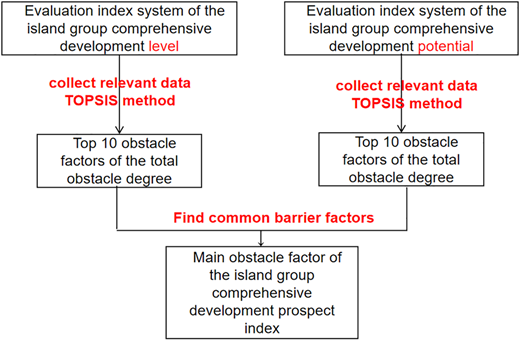
Process of identifying the main obstacle factors of the island group comprehensive development prospect index
Process of identifying the main obstacle factors of the island group comprehensive development prospect index
3. Evaluation index system
The evaluation model of the prospective index comprehensive development used in this study is composed of two evaluation index systems: comprehensive development level and comprehensive development potential. Table 1 shows the complete evaluation index system of the island comprehensive development level. The evaluation indicators were determined by integrating a number of island evaluation research results in terms of resources, natural environment, economic status and social status, which were drawn from a questionnaire developed in consultation with various experts and scholars. A total of 53 evaluation indicators were selected. Relevant experts and scholars were also consulted to obtain feedbacks on the index system, which was then synthesized. After that, the interpretation structure model is applied to analyze the hierarchical structure between the elements, and the evaluation index system of the comprehensive development level of the island is constructed. Through these steps, the evaluation index system of the island-group comprehensive development level was created, containing 40 evaluation indicators. The weight and consistency of each indicator were calculated.
Comprehensive evaluation index system of the comprehensive development level
| Type | No | Index | Direction | Weight |
|---|---|---|---|---|
| A: Resource status (0.2480) | A1 | Annual water supply per capita (t) | + | 0.0351 |
| A2 | Per capita annual water supply gap between the island group and superior administrative regions (t) | − | 0.0285 | |
| A3 | Annual power supply per capita (kw·h) | + | 0.0356 | |
| A4 | Per capita annual water supply gap between the island group and superior administrative regions (kw·h) | − | 0.0291 | |
| A5 | Island land area per capita (km2) | + | 0.0267 | |
| A6 | Shoreline coefficient (km/km2) | + | 0.0247 | |
| A7 | Output of agricultural and fishery products per capita (t) | + | 0.0236 | |
| A8 | Cargo throughput per capita (t) | + | 0.0222 | |
| A9 | Intertidal zone per capita (m2) | + | 0.0225 | |
| B: Ecological environment status (0.3066) | B1 | Standard rate of surrounding seawater quality (%) | + | 0.0265 |
| B2 | Good air quality rate (%) | + | 0.0247 | |
| B3 | Harmless disposal rate of garbage (%) | + | 0.0224 | |
| B4 | Marine disaster loss per capita (104RMB) | − | 0.0314 | |
| B5 | Average wave height of ocean (m) | − | 0.0220 | |
| B6 | Number of typhoons and storm surges | − | 0.0258 | |
| B7 | Red tide occurrence | − | 0.0212 | |
| B8 | Offshore distance (km) | − | 0.0217 | |
| B9 | Vegetation coverage (%) | + | 0.0354 | |
| B10 | Foggy day ratio (%) | − | 0.0215 | |
| B11 | Phytoplankton biodiversity index | + | 0.0272 | |
| B12 | Zooplankton biodiversity index | + | 0.0268 | |
| C: Economic status (0.2325) | C1 | Per capita of GDP (104 RMB) | + | 0.0262 |
| C2 | Change rate of GDP (%) | + | 0.0262 | |
| C3 | Percentage of tertiary industry (%) | + | 0.0246 | |
| C4 | Investment in fixed assets per capita (104 RMB) | + | 0.0221 | |
| C5 | Fixed asset investment change rate (%) | + | 0.0210 | |
| C6 | Per capita disposable income (104 RMB) | + | 0.0212 | |
| C7 | Disposable income change rate (%) | + | 0.0231 | |
| C8 | Tourism income per capita (104 RMB) | + | 0.0252 | |
| C9 | Tourism income change rate (%) | + | 0.0214 | |
| C10 | Change rate of number of tourists on the island (%) | + | 0.0215 | |
| D: Social status (0.2129) | D1 | Change rate of the number of education practitioners per 10,000 people (%) | + | 0.0223 |
| D2 | Gap in number of 10,000 education practitioners between island group and superior administrative regions | − | 0.0261 | |
| D3 | Rate of change in the number of 10,000 medical practitioners (%) | + | 0.0231 | |
| D4 | Gap in number of 10,000 medical practitioners between island groups and superior administrative regions | − | 0.0287 | |
| D5 | Change rate of hospital beds per 10,000 people (%) | + | 0.0217 | |
| D6 | Gap between the number of hospital beds per 10,000 people | − | 0.0253 | |
| D7 | Change rate of social insurance amount (%) | + | 0.0212 | |
| D8 | Population change rate (%) | + | 0.0237 | |
| D9 | Engel coefficient (%) | − | 0.0208 |
Table 2 shows the complete evaluation index system of the island comprehensive development potential used in this study. To establish the initial evaluation index system, the previous development potential evaluation index system was used as a reference. Relevant experts and scholars were also consulted to obtain feedbacks on the index system, which was mainly based on data parameters and supplemented with a small number of quantitative parameters to ensure objectivity, pertinence and strong operability. Feedbacks by experts and scholars were sorted and summarized. Indicators that were generally considered irrelevant (i.e. with low selection rates) were either removed or modified, and appropriate indicators were added. After that, the interpretation structure model is applied to analyze the hierarchical structure between the elements, and the evaluation index system of the comprehensive development potential of the island is constructed. Through these steps, the evaluation index system of the island-group comprehensive development potential was created. The weight and consistency of each indicator were calculated.
Evaluation index system of the island comprehensive development potential
| Type | No | Index | Direction | Weight |
|---|---|---|---|---|
| A: Resource supply conditions (0.335) | A1 | Island land area per capita (km2) | + | 0.0491 |
| A2 | Intertidal zone per capita (km2) | + | 0.0536 | |
| A3 | Closest distance to the mainland coastline (km) | − | 0.0338 | |
| A4 | Sea and land passenger traffic | + | 0.0308 | |
| A5 | Annual water supply per capita (t) | + | 0.0551 | |
| A6 | Annual power supply per capita (kw·h) | + | 0.0439 | |
| A7 | Agricultural output per capita (t) | + | 0.0334 | |
| A8 | Number of people visiting the island | + | 0.0353 | |
| B: Natural environment guarantee conditions (0.274) | B1 | Sea water quality compliance rate (%) | + | 0.0334 |
| B2 | Plankton biodiversity index | + | 0.0308 | |
| B3 | Harmless disposal rate of island garbage (%) | + | 0.0313 | |
| B4 | Number of storm surges | − | 0.0292 | |
| B5 | Red tide occurrence | − | 0.0274 | |
| B6 | Vegetation coverage (%) | + | 0.0329 | |
| B7 | Fog days ratio (%) | − | 0.0283 | |
| B8 | Average wave height (m) | − | 0.0247 | |
| B9 | New energy application prospects | + | 0.0360 | |
| C: Economic and social supply conditions (0.391) | C1 | GDP per capita (104 RMB) | + | 0.0477 |
| C2 | GDP change rate (%) | + | 0.0446 | |
| C3 | Per capita disposable income (104 RMB) | + | 0.0325 | |
| C4 | Investment in fixed assets per capita (104 RMB) | + | 0.0414 | |
| C5 | Total imports and exports per capita (104 RMB) | + | 0.0340 | |
| C6 | Percentage of tertiary industry (%) | + | 0.0536 | |
| C7 | Technology expenditure per capita (RMB) | + | 0.0457 | |
| C8 | Change rate of the number of education and medical practitioners per 10,000 people (%) | + | 0.0512 | |
| C9 | Number of students in primary and secondary schools | + | 0.0403 |
Relevant data were collected separately to evaluate the comprehensive development level and comprehensive development potential of the Changdao Island Group from 2010 to 2017. The data collected laid the foundation for calculating the prospective index of comprehensive development and identifying the main obstacle factors of the Changdao Island Group.
4. Case study
4.1 Evaluation results of the prospective index of the Changdao Island Group
4.1.1 Comprehensive development level
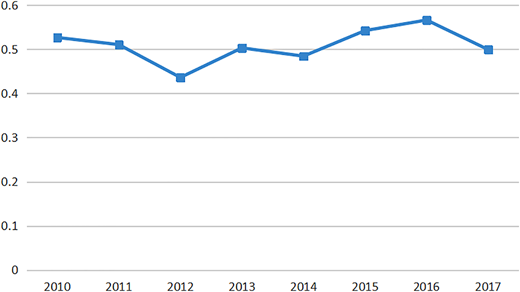
Figure 5 shows the comprehensive development level of the Changdao Island Group from 2010 to 2017 based on the evaluation results. The highest value was 0.57 in 2016, while the lowest value was 0.44 in 2012, indicating a difference of 77.02%. The comprehensive development level decreased by 17.21% from 2010 to 2012, increased by 29.84% from 2012 to 2016, and decreased again by 11.82% from 2016 to 2017.
4.1.2 Comprehensive development potential
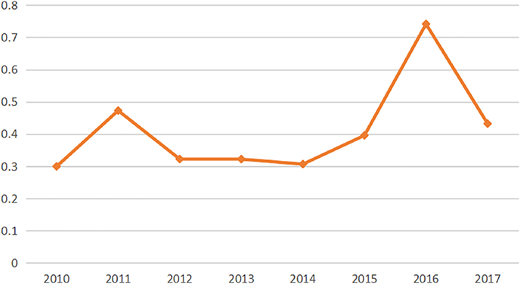
Figure 6 shows the comprehensive development potential of the Changdao Island Group from 2010 to 2017 based on the evaluation results. The highest value was 0.74 in 2016, while the lowest value was 0.30 in 2010, indicating a difference of 40.35%. The comprehensive development potential increased by 57.95% from 2010 to 2011, decreased by 35.17% from 2011 to 2014, increased again by 242.04% from 2014 to 2016, and decreased again by 11.82% from 2016 to 2017.
4.1.3 Comprehensive development prospect index
Figure 7 shows the prospective index of comprehensive development of the Changdao Island Group from 2010 to 2017 based on the evaluation results. The highest value was 0.57 in 2016, while the lowest value was 0.43 in 2012, indicating a difference of 76.06%. The comprehensive development prospect increased by 11.24% from 2010 to 2011, increased again by 14.85% from 2011 to 2016, and decreased by 15.35% from 2016 to 2017.
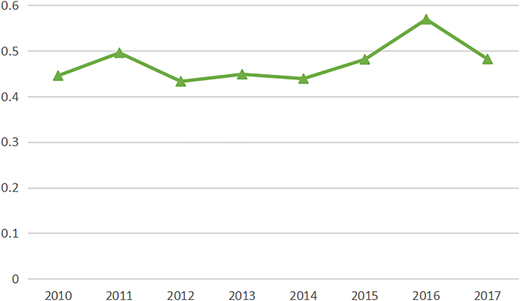
According to the evaluation results of the prospective index of comprehensive development of the Changdao Island Group, it can be seen that Changdao island has achieved better development from 2010 to 2017. Especially since 2012, Changdao County has focused on the goal of building a leading domestic and international first-class ecological resort island, practiced the work concept of ecological priority, established the development pattern of “1 + 3” marine advantageous industries, and seized the opportunity to make the Changdao Island Group comprehensive development has achieved certain results. The main manifestations are that the economic development of the Changdao Island Group has accelerated and increased efficiency, the development blueprint has become clearer, the ecological barrier has become stronger, the infrastructure has been significantly improved, the development momentum has continued to increase, and the people's livelihood and welfare have continued to increase. More importantly, the ecological protection of the Changdao Island Group has achieved remarkable results. It has successively been approved as a national sanitary city, a national key ecological function zone, a national marine park, and a national marine ecological civilization construction demonstration zone. In recent years, the achievements in the environmental protection of the Changdao Island Group have laid a good foundation for the improvement of its comprehensive development prospect index.
4.2 Major obstacle factors
Figure 8 shows the top 10 obstacle factors of the total obstacle level of the comprehensive development level and comprehensive development potential of the Changdao Island Group. These were the common factors, which were determined by identifying the factors that were at the intersections of the two index systems: per capita annual water supply, per capita annual power supply, GDP change rate and change rate of the number of 10,000 education and medical practitioners.
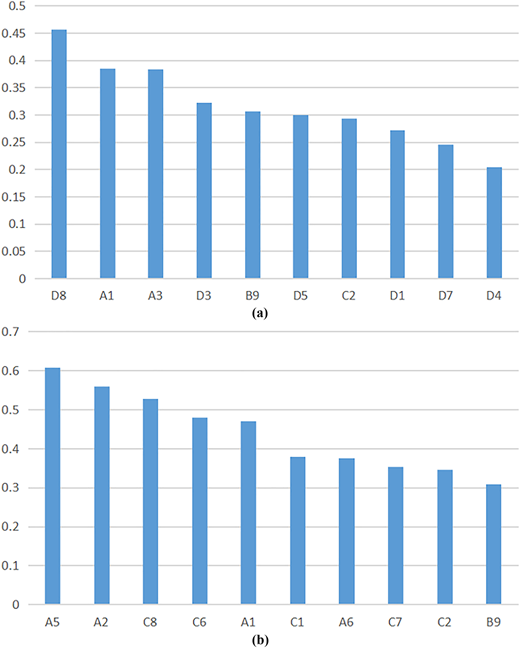
(a) Top 10 obstacle factors of the total obstacle level of the comprehensive development level of the Changdao Island Group. (b) Top 10 obstacle factors of the total obstacle level of the comprehensive development potential of the Changdao Island Group
(a) Top 10 obstacle factors of the total obstacle level of the comprehensive development level of the Changdao Island Group. (b) Top 10 obstacle factors of the total obstacle level of the comprehensive development potential of the Changdao Island Group
Figure 9 shows the trend of changes in the degree of each major obstacle factor from 2010 to 2017. In 2010, the annual water supply per capita was the main factor hampering the development of the island group. Since then, the main obstacle factors have gradually became the rate of change of the number of education and medical practitioners per 10,000 people, GDP change rate, annual electricity supply per capita, and annual water supply per capita. By 2017, the main obstacle factors of the prospective index of comprehensive development of the Changdao Island Group had shifted from the guarantee capacity of water and electricity supply to talent issues and GDP change rate.
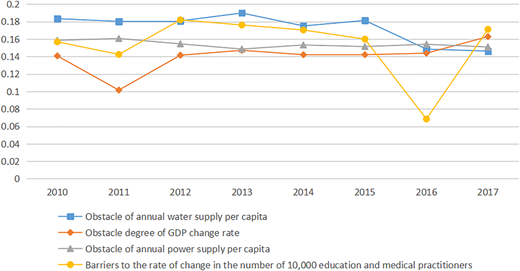
Change trend of the main obstacle factors of the comprehensive development prospect index of the Changdao Island Group
Change trend of the main obstacle factors of the comprehensive development prospect index of the Changdao Island Group
4.3 Analysis
Figure 10 shows the average value of the evaluation results of the seven criterion layer factors of the prospective index of comprehensive development of the Changdao Island Group from 2010 to 2017.
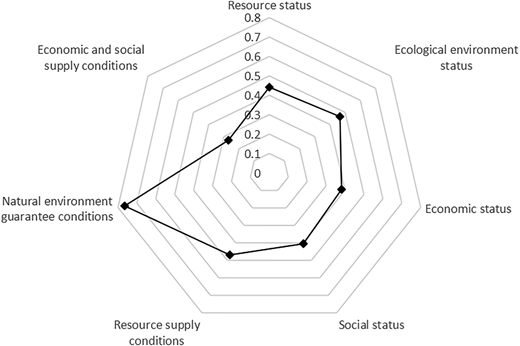
Criteria layer factor evaluation results of the prospective index of comprehensive development of the Changdao Island Group
Criteria layer factor evaluation results of the prospective index of comprehensive development of the Changdao Island Group
The evaluation of the prospective index of comprehensive development of the Changdao Island Group shows a rising trend. However, the current economic developmental status and economic and social conditions of the island group restrict its comprehensive development. Based on the evaluation and analysis of the main obstacle factors mentioned above, the continuous and stable development of the Changdao Island Group can be promoted by improving its economic and social conditions and economic developmental status, particularly by improving human resources management, increasing GDP growth rate, and improving fresh water and electricity supply.
5. Conclusions and recommendations
Using the prospective index of island-group comprehensive development constructed in this study, the prospective index of comprehensive development of the Changdao Island Group was evaluated quantitatively. The evaluation revealed that the prospect of comprehensive development of this island group had an upward trend from 2010 to 2017. However, due to major obstacle factors such as the rate of change of the number of 10,000 education and medical practitioners, GDP change rate, and annual water and electricity supply per capita, the economic and social conditions and current economic developmental status of the Changdao Island Group are not ideal. Some recommendations to overcome the four main obstacle factors are proposed as follows:
Apply new energy technologies, especially floating generators, to strengthen the power supply capacity of the Changdao Island through multi-energy complementary power generation;
Combine water delivery from the mainland, seawater desalination, and coastal reservoir technology to develop a fresh water supply guarantee system that incorporates transportation, control, and storage;
Combine public-private partnership and other models to develop a diversified financial support system that ensures adequate financial support and promotes the rapid growth of island group GDP;
Improve the basic conditions of the island group, raise the level of talent treatment, and establish a perfect talent training mechanism through a multi-level talent security system that focuses on education and the medical industry.
The evaluation model of the prospect of island-group comprehensive development constructed in this paper is widely applicable to the comparative evaluation research among other island groups that are trying to study the overall level of integrated development of islands within a certain time and space. In the future, the plan can be optimized in two ways. The first is to optimize the data collection methods. For example, it is better to combine remote sensing data and network big data in addition to increasing the proportion of data acquired in the field study. Another way is to optimize the mathematical model to make the evaluation result more accurate. For example, gray analysis model, and semantic fuzzy evaluation model and so on can be combined for further research.
The study is supported by Guangxi Key Laboratory of Marine Environmental Science, Guangxi Academy of Sciences (GXKLHY21-04), Special Funds for Fundamental Scientific Research Operation of Central Universities (202113011), Shandong Provincial Social Science Planning Research Youth Project (21DSHJ2), Tianjin Philosophy and Social Science Planning Project of China (No. TJKS20XSX-015).

