


This study is of great significance in revealing the interactive and coordinated relationship between tourism development and the ecological environment, improving the level of environmental governance in the process of tourism economic development and realising the dual-carbon goal and sustainable development of the tourism industry.
This paper performs slack-based measure (SBM)-data envelopment analysis (DEA) analysis, benchmark regression and threshold effect measurement on a sample of 277 cities in China from 2011 to 2019, to estimate the impact of the digital economy on tourism eco-efficiency and to identify the moderating role of environmental regulation.
China’s tourism eco-efficiency shows a spatio-temporal characteristic of steady growth amid fluctuations. The digital economy has a positive facilitating effect on tourism eco-efficiency, which is non-linear with a single threshold effect (0.631), and when the level of the digital economy exceeds the threshold value, its facilitating effect increases from 0.696 to 0.927. Environmental regulation does not play the role of “the icing on the cake” during the digital economy’s impact on tourism eco-efficiency.
This study for the first time includes the digital economy, eco-efficiency and environmental regulation in the research perspective, and analysed the mechanism of action between the three, expanding the depth of research on the digital economy and environmental regulation in the field of tourism. Meanwhile, based on the development needs of policy specialisation and industrial refinement, this study has strong practical significance when conducted at the city level.
1. Introduction
The digital economy is driven by artificial intelligence (AI), blockchain, cloud computing, big data and others.
Data technologies are significantly different from the industrial economy in terms of enterprise forms, key elements, growth paths and economic laws, which profoundly affect human production and development, lifestyles and ecological environment (Brennen and Kreiss, 2016). Efficient data information flow is essential for the orderly development of tourism activities. Therefore, the digital economy, with data as a key production factor, plays a crucial role in the tourism industry. Countries around the world have realised varying degrees of economic growth based on the innovative and inclusive digital economy, which has become a new engine for economic development. The value-added to China’s digital economy increased from 11.2 trillion yuan in 2012 to 53.9 trillion yuan in 2021, expanding by 3.8 times in 11 years and ranking second in the world in scale (China Academy of Information and Communications Technology, 2024). Meanwhile, the relationship between the development of the digital economy and the ecological environment has garnered significant attention. On the one hand, the digital economy can reduce carbon emissions through incentives such as improving technological diversification and energy efficiency (Yang et al., 2023; Acemoglu et al., 2012; Wu et al., 2024). Meanwhile, the positive impact has a spillover effect, that is, the digital economy can not only reduce local carbon emissions but also reduce carbon emissions in surrounding cities (Liu et al., 2022). Conversely, some studies have argued that the development of the digital economy has not reduced resource dependence for production and consumption. The operation of electronic equipment, such as data storage platforms, computing centres and 5G base stations, has increased electricity consumption, which in turn has led to an increase in carbon emissions. Thus, it is considered a high-energy-consuming industry with a significant “pro-carbon” effect (Sadorsky, 2012). It can be seen that with the further deepening of the development of the digital economy, the relationship between the digital economy and the ecological environment has not yet reached a consensus.
Tourism eco-efficiency measures the economic value of tourism development and the degree of pollution, aiming to maximise the economic benefits of tourism activities and minimise energy consumption and environmental impact. Tourism has a close relationship with the ecological environment because of its resource consumption and environmental dependence. The “green deficit problems”, such as the “ecological deficit”, brought about by the development of tourism have broken people’s perception of tourism as a “smokeless industry” and “environmentally friendly industry” (Peng et al., 2023). Carbon emissions from tourism-related transportation were 1.597 billion tonnes in 2016, accounting for 22% of total transport emissions and 5% of all anthropogenic carbon emissions. This figure is projected to increase by 23%, reaching 1.998 billion tonnes by 2030 (World Tourism Organisation, 2019). The scientific concept of “lucid waters and lush mountains are invaluable assets” proposed by China in 2005 demonstrates the importance it attaches to the increasingly serious environmental problems and ecological imbalances in the context of rapid economic development. In the context of ecological civilisation construction, exploring the environmental impact of tourism economic development holds significant theoretical and practical value for realising the green transformation of development modes and sustainable industrial development.
Environmental regulation refers to the sum of various policies formulated and implemented for the purpose of environmental protection and resource conservation. It is an important management tool for the government’s macro-control to intervene in the environmental impact of enterprise production and operation. In recent years, China’s central and local governments have successively introduced a series of environmental policies to enhance environmental regulation and promote green and low-carbon development (Wang and Shen, 2016). On the one hand, the gradual popularisation of digital technology promotes the refinement and intelligent development of environmental regulation, supervision, implementation and feedback. Additionally, the promotion of digital platforms encourages public participation and enhances environmental awareness, thereby fostering energy conservation and emission reduction (Bao, 2022). On the other hand, environmental regulation encourages tourism enterprises to comply with environmental protection standards through policy constraints and incentive mechanisms. This compels the digital economy to innovate in areas such as energy conservation, emission reduction, clean energy utilisation and other technologies, thereby improving ecological efficiency. Therefore, it is necessary to integrate environmental regulation, digital economy and tourism eco-efficiency within a unified research framework to examine the impact of the digital economy on tourism eco-efficiency at the city level, which holds greater tactical value, and to further explore the role of varying levels of environmental regulation in this process to determine whether it promotes or hinders the ecological effects of the digital economy.
Therefore, this paper attempts to answer the following three main questions through econometric analysis based on 277 city-level data in China from 2011 to 2019: (1) Whether and to what extent the development of the digital economy contribute to the improvement of tourism eco-efficiency? Does it have a threshold effect? (2) Whether and to what extent environmental regulation plays a moderating role in this process. (3) Is there heterogeneity in the impact of the digital economy on regions with different levels of the digital economy and environmental regulation, economic development and population sizes? Scholars have yet to fully address these questions. In line with the preceding discussion, the present paper aims to enrich the literature in two ways. First, from the perspective of the theoretical significance. Analysing the mechanism of digital economy and environmental regulation on tourism eco-efficiency, and on this basis, measure the promotion and threshold effects of digital economy on tourism ecological efficiency, as well as the moderating role of environmental regulation in this process, which adds a new theoretical perspective to the cross-application of digital economy in the field of tourism. Second, from the perspective of empirical significance. We refine the research scale to the city dimension and reveal the interactive and coordinated relationship between tourism development and the ecological environment at the city level, thereby improving the level of environmental governance, as well as providing China’s practical reference for the realisation of the dual-carbon goal and the sustainable development of the tourism industry.
2. Literature review
2.1 The impact of the digital economy on the tourism economy
There is a consensus that the digital economy with highly knowledge-intensive attributes can empower the development of the tourism economy. The intelligent digital economy with AI as the core can break through the limitations of time and space and promote the development of the tourism economy by improving information transparency, increasing resource allocation efficiency and promoting industrial integration (Zvaigzne et al., 2023), thereby forming a new profit model, product formats, management advantages and industrial structure (Chen et al., 2022). Existing studies have mostly focused on the macro level of the digital economy on tourism economic growth (Tang, 2023a), economic resilience (Tang, 2023b), industrial structure upgrading (Yang and Wu, 2022) and high-quality development of the tourism economy (Tang, 2022). In contrast, few scholars have paid attention to the digital economy’s impact on tourism carbon emissions and tourism eco-efficiency (Su et al., 2023), or the complex relationship between cities and enterprises at the micro level. There is increasing evidence that the digital economy improves carbon emission efficiency in other industries such as construction and energy (Yi et al., 2022). However, it is not comprehensive to explore the carbon emission of the digital economy solely from the perspective of high energy consumption, which ignores the impact of technology spillover (Anwar et al., 2023; Liu et al., 2023) on improving energy efficiency and adjusting economic structure (Zhang et al., 2022). The development of the tourism economy is resource-environment dependent, and digital technology not only empowers the internal logic and dynamic mechanism of high-quality development of the tourism economy but also realises the improvement of carbon emission efficiency in the long term (Su et al., 2023). However, most of them are pair-to-pair studies, and digital economy, tourism eco-efficiency and environmental regulation are not included in the same framework for in-depth discussion in the city dimension.
2.2 Tourism eco-efficiency
The concept of tourism eco-efficiency was proposed due to people’s concern about the impact of tourism development on the environment. Early studies on tourism and the environment focused on greenhouse gas emissions and energy consumption in the tourism industry. Gössling et al. (2005) was the first to explicitly put forward the concept of tourism eco-efficiency, and the existing studies mainly focus on the measurement of indicators and spatial and temporal evolution. In terms of measurement methods, Perch-Nielsen et al. (2010) take the single index method, that is, the ratio of carbon dioxide emissions to tourism income or tourism value-added, to measure the eco-efficiency of tourist destinations. Due to the limitation of data availability, tourism value-added can only be obtained in the countries that compiled the tourism satellite accounts, so most studies use tourism income to characterise the development of the tourism economy. Some scholars have also introduced the ecological footprint into the measurement of tourism eco-efficiency (Wang et al., 2021a) to characterise the impact of tourism on the environment. Later scholars have expanded on this foundation by constructing an evaluation system for measurement through input–output modelling (Kytzia et al., 2011; Wu and Liang, 2023), data envelopment analysis (DEA) (Li et al., 2022) and other methods. In terms of spatial and temporal evolution, most existing studies measure China’s tourism eco-efficiency at the provincial scale and use exploratory spatial data analysis and standard deviation ellipse to reveal the characteristics and internal mechanisms of the processes of spatial agglomeration and evolution of tourism eco-efficiency (Zheng and Yang, 2020; Wang et al., 2024) Restricted by tourism resource endowment and social and economic development level, the development of China’s tourism economy shows a significant imbalance. Moreover, in the current situation that China takes cities as the main body of GDP assessment and ecological environment governance, the study on the impact of the digital economy on tourism eco-efficiency based on cities is more conducive to the elaboration and implementation of ecological environment and tourism economic policies.
2.3 Impact of the digital economy on tourism eco-efficiency
The digital economy affects tourism eco-efficiency by reducing tourism pollution emissions (technological innovation, environmental awareness and energy utilisation) and tourism benefits (cost savings and operational revenue generation). Based on the new economic growth theory (Change, 1990), Schumpeter’s innovation theory (Maillat, 1998) and externality theory (Anderson, 2020), knowledge is the core element to achieve technological innovation. Digital technology can promote the agglomeration and integration of production factors such as information, knowledge, talent and capital, and plays a driving role in the research and development, application and dissemination of energy conservation and emission reduction technologies. The expansion of information dissemination channels can help popularise the concept of sustainable development, which is important for improving tourists’ travel habits and leading to green consumption. According to industrial structure theory (Hoffmann, 1958), the digital economy facilitates the optimisation and upgrading of industrial structures through technological innovation. In the tourism industry, digital technologies can enhance the efficiency of resource allocation and reduce energy consumption intensity (Ren et al., 2021), such as by lowering the idling rate in tourism transport. From the perspective of the cost of the entire process of tourism services, the empowerment of the digital economy reduces the search and energy cost of tourism enterprises (Goldfarb and Tucker, 2019) and realises supply creation at a lower cost of ecological destruction. The digital economy improves tourism economic benefits by breaking the information gap between supply and demand, weakening tourists’ travel costs and uncertainty risk perception and attracting more capital to invest in technology upgrading and innovation, forming a benign two-way feedback loop.
There is a facilitating effect of the digital economy on tourism eco-efficiency.
There is a non-linear effect of the digital economy on tourism eco-efficiency.
2.4 Environmental regulation
Dasgupta (1980) first proposed the concept of environmental regulation, believing that environmental regulation is a policy and mandatory means formulated by the government to ensure economic development while taking into account the ecological environment, so as to reduce the external diseconomy caused by pollutant discharge. Since then, scholars have continued to improve this concept from the perspectives of non-governmental entities (Pargal and Wheeler, 1996), economic stimulus measures, market mechanism policies and other regulatory approaches. The “cost effect” and “learning effect” of environmental regulation have been the focus of existing research. Porter’s hypothesis (Porter, 1996) challenged the traditional economic view that environmental regulation increases the production cost of enterprises, produces “crowding out effect” on technological innovation and then reduces the productivity level. Porter’s hypothesis holds that environmental regulation can have a positive impact on the innovation activities of enterprises (Rubashkina et al., 2015) and is conducive to improving the technological innovation level of enterprises in the long run, that is, there is a lag effect. From the perspective of the impact of environmental regulations on carbon emissions, the “green paradox” effect holds that environmental regulations have a promoting effect on carbon emissions (Smulders et al., 2012; Grafton et al., 2012), while institutional theory (Tolbert and Zucker, 1983) suggests that environmental regulation, as a policy tool, can guide firms toward green innovation and optimal resource allocation through institutional design. The “forced emission reduction” effect of environmental regulations can inhibit carbon emissions, on which the researchers have not reached a unified conclusion. In general, the existing research on environmental regulation mostly focuses on the national economy as a whole or the industrial manufacturing industry as the object of research, and there are relatively few studies on the impact of environmental regulation on tourism eco-efficiency. In the context of environmental regulation, both enterprises and local governments are more likely to prioritise the research, development and application of environmentally friendly technologies during their digital transformation, which in turn promotes the enhancement of eco-efficiency. Therefore, this paper argues that environmental regulation plays a crucial regulatory role in advancing tourism eco-efficiency within the digital economy.
Environmental regulation has a moderating role in the impact of the digital economy on tourism eco-efficiency.
To summarise, many studies have been conducted on the fields of digital economy, tourism eco-efficiency and environmental regulation based on the macro perspective or the manufacturing industry; few have explored the tourism industry highly dependent on the ecological environment quality and failed to carry out comprehensive and systematic empirical research under the same framework. With the promotion of environmental protection measures in various parts of China, has the eco-efficiency of tourism been positively promoted? What role does environmental regulation play in the digital economy impact on tourism eco-efficiency? Does it have a moderating effect? This has not been fully answered in previous studies. Therefore, this study builds an econometric model based on China’s city-level data, integrates digital economy, tourism eco-efficiency and environmental regulations into the same framework for the first time, and examines their interaction and heterogeneity. The solutions to these problems will further improve the pertinence of decision-making at the city level and provide an empirical test in the Chinese context for improving global tourism eco-efficiency.
3. Methodology
3.1 Methods
3.1.1 Selection of the tourism eco-efficiency indicator system
This paper evaluates tourism eco-efficiency (teco) at the city level in China from an input–output perspective, highlighting the concept of a sustainable development index system (Table 1). In terms of input, the number of 5A-level tourist attractions, star-rated hotels, high-speed railway stations opened and highway miles are selected to represent tourism resource input, and the number of tourism practitioners is selected to represent tourism labour input. Since there are no separate official statistics on the number of tourism employees, the number of employees in the tertiary industry replaces the number of tourism employees. Tourism fixed assets investment is selected to represent tourism capital investment. Output includes desired output and non-desired output. In terms of desired output, it is represented by total tourism revenue and total number of visitors. In terms of non-desired output, the emissions of “three wastes”: waste solid, wastewater and waste gas are selected to characterise. Since China does not separately calculate the relevant data of tourism pollution emission and fixed asset investment, the total wastewater emission is multiplied by the proportion of tourism (the ratio of tourism revenue to GDP) for conversion (Huang and Wang, 2023), and the emissions of waste solids, waste gas and fixed asset investment in tourism are converted in the same way as above.
Index system of tourism eco-efficiency and digital economy development level
| Level 1 indicators | Secondary indicators | Tertiary indicators | Quadruple indicators |
|---|---|---|---|
| Tourism eco-efficiency | Input indicators | Tourism resource inputs | Number of 5A-level tourist attractions (units) |
| Number of high-speed rail stations opened (units) | |||
| Road mileage (10,000 km) | |||
| Tourism labour inputs | Tourism employees (persons) | ||
| Tourism capital investment | Investment in tourism fixed assets (billions of dollars) | ||
| Output indicators | Desired outputs | Gross tourism receipts (billions of dollars) | |
| Total tourist arrivals (millions) | |||
| Non-desired outputs | Waste solid emissions (104 t) | ||
| Wastewater discharge (104 t) | |||
| Exhaust emissions (104 t) | |||
| Level of development of the digital economy | Level of digital infrastructure | China Digital Inclusive Finance Index | Digitisation index |
| Level of scale of digital applications | Internet penetration | Internet users per 100 population (units) | |
| Internet-related outputs | Total telecommunication services per capita (units) | ||
| Number of mobile Internet users | Cell phone subscribers per 100 population (units) | ||
| Level of digital R&D environment | Number of Internet-related workers | Percentage of employees in computer services and software |
Source(s): Authors’ own work
3.1.2 SBM-DEA model
DEA is a modelling approach rooted in linear programming and distance functions. Although the traditional DEA can be used to evaluate the efficiency of multiple inputs and multiple outputs, it fails to fully consider the relaxation of input and output, resulting in a certain deviation in the efficiency measurement. Effective comparison and ranking cannot be carried out. In order to solve these problems when the efficiency value of multiple decision units is 1. Compared to the traditional DEA, the slack-based measure (SBM) model mitigates deviations due to varying radial and angular selections (Cecchini et al., 2018). Therefore, this paper draws on Tone's (2001) SBM-DEA model to solve these issues. The model for measuring tourism eco-efficiency based on non-desired output is set as follows:
where p is the efficiency value, m, q1 and q2 represent the number of indicators for inputs, desired outputs and non-desired outputs. xk, yk and bk represent the input, desired output and non-desired output variables. s−, s+ and sb− represent input, desired output and non-desired output slack variables. λ is column vectors, and the relationship between each slack variable and λ is all greater than or equal to 0.
3.1.3 Calculation of digital economy development level (dig)
The principal component analysis (PCA) method is used to measure the development level of the digital economy in Chinese 277 cities (Yang and Jiang, 2021). This paper constructs an indicator system for the development level of the digital economy from three aspects: The level of digital infrastructure, the level of scale of digital applications and the level of digital R&D environment (Zhao et al., 2020) (Table 1). The application of digital infrastructure and data analysis technologies can reduce the idle and empty load rates in tourism transport, while also significantly lowering energy consumption and pollution emissions in tourism activities, such as the energy use in hotel air conditioning, lighting, hot water and mechanical systems (Su et al., 2023). Additionally, improving the scale of digital applications helps bridge the information gap and promotes the development of digital tourism marketing, which in turn enhances the economic efficiency of tourism and attracts increased investment in the research, development, and upgrading of energy-saving and emission reduction technologies. The advancement of the digital R&D environment provides a solid foundation for the construction, application and widespread adoption of digital infrastructure.
3.1.4 Calculation of environmental regulation intensity (enr)
In the existing studies, the method of measuring environmental regulation with the comprehensive index of the removal rate of industrial “three wastes” ignores the difference in the types of industries used and cannot reflect the intensity of environmental regulation at the government level. Therefore, this paper draws on the methodology of Chen and Chen (2018), using Python software to crawl the government work reports of 277 cities in China, and conducts word frequency statistics and text analysis to identify the intensity of environmental regulation according to the proportion of word frequency related to “environment”, “environmental protection”, and “energy conservation and emission reduction” in the total report.
In addition, the following control variables are selected in this paper: per capita tourism consumption (ptc) of each city to characterise the scale of the tourism industry in the region, and the regional science and technology innovation level (til) was represented by the proportion of science and technology expenditure in public financial expenditure. The actual amount of foreign investment is used to characterise regional economic development (fi). Urbanisation development has resource and information agglomeration effect, which can affect tourism ecological efficiency, and the ratio of urban population to total population is used to characterise urbanisation level (urb).
3.1.5 Regression model
In order to investigate the impact of digital economy development on tourism eco-efficiency, the following benchmark regression model is set:
where teco denotes tourism eco-efficiency, c and t denote city and year. denotes the level of the digital economy. X denotes the control variable. α0, α1 and λ are all coefficients to be estimated, and μc denotes urban fixed effects. γt denotes year-fixed effects. εc,t denotes the random error term.
In order to examine the non-linear impact of the digital economy as a threshold variable, refer to the model board threshold regression model of Hansen (1999), and set the threshold model on the basis of model (1) as follows:
where I() and η, respectively, denote the indicator function and threshold value, and β0, and βn are all coefficients to be estimated.
To further explore the moderating role of environmental regulation, the following model is set up based on model (1):
where enr denotes the intensity of environmental regulation. δn and ζn are the coefficients to be estimated. If ζ3 the coefficients are the same (opposite) as ζ1 coefficients are the same (opposite), then environmental regulation promotes (weakens) the impact of the digital economy.
3.2 Data sources
Considering the accessibility and integrity of the data, as well as the distortion effect of the exclusion of outliers, this study finally chooses 2011–2019 as the research period. Excluding regions with too serious data loss, 277 cities in China were selected as research objects to explore the impact of digital economy development on tourism eco-efficiency from the perspective of environmental regulation. The data of the tourism eco-efficiency index system come from the Bulletin of National Economic and Social Development, China City Statistical Yearbook and China Environmental Statistical Yearbook, and the environmental regulation data come from the Chinese version of the government work report website of each city. Data on the digital economy is obtained from the China City Statistical Yearbook and the Research Centre for Digital Finance of Peking University (https://idf.pku.edu.cn). A small number of missing data were supplemented by linear interpolation. The descriptive statistics of each variable are shown in Table 2.
4. Results
4.1 Trends in the digital economy and tourism eco-efficiency
4.1.1 Spatio-temporal changes in tourism eco-efficiency
Based on the SBM-DEA model, the tourism eco-efficiency values of 277 cities in China from 2011 to 2019 were measured using SBMrun software. The tourism eco-efficiency was sequentially categorised into high-efficiency areas (teco ≥1. 2), higher-efficiency areas (1.2 > teco ≥ 0.9), medium-efficiency areas (0.9 > teco ≥ 0.6), lower-efficiency areas (0.6 > teco ≥ 0.3) and low-efficiency areas (teco < 0.3), and the two-time cross-sections of 2011 and 2019 were selected for spatial visualisation expression and comparison (Figure 1–3). In terms of time, the level of tourism eco-efficiency in China during the study period has the characteristics of steady growth in fluctuation. The proportion of lower-efficiency and low-efficiency areas decreased from 59.57% in 2011 to 43.32% in 2019, but they still accounted for a relatively high proportion, and there is a large room for improvement in reaching the optimal efficiency value. In terms of space, China’s cities regions have prominent imbalances and obvious differentiation. The high-efficiency areas have evolved from six cities in 2011, namely Sanya, Shenzhen, Chongqing, Beijing, Huangshan and Guiyang to 13 cities in 2019, namely Shenzhen, Anqing, Zhoushan, Fuyang, Jincheng, Haikou, Tonghua, Kunming, Zunyi, Xiamen, Xi’an, Yibin and Fuzhou. Most of them are cities in coastal, river and lake areas, or popular tourist cities with high tourism resources endowment. These regions rely on the advantages of economy and location to promote the intensive and ecological development of tourism resources and the rational and low-carbon development of the tourism industry structure, which is conducive to improving tourism eco-efficiency.
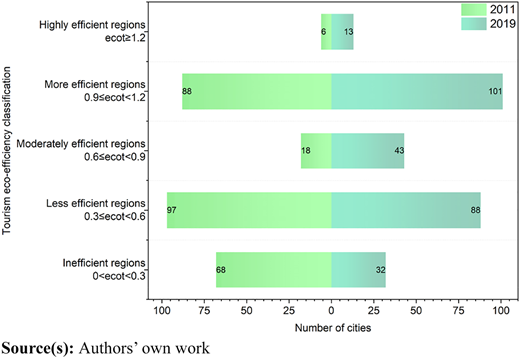
Comparison of the distribution of the number of tourism eco-efficiency classifications among 277 cities in China in 2011 and 2019
Comparison of the distribution of the number of tourism eco-efficiency classifications among 277 cities in China in 2011 and 2019
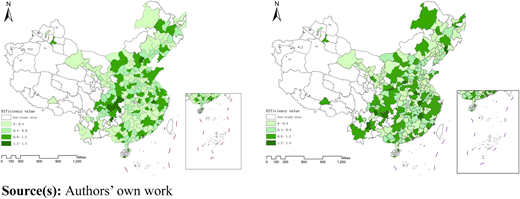
Regional distribution of tourism eco-efficiency values in 277 prefecture-level cities in China in 2011 and 2019
Regional distribution of tourism eco-efficiency values in 277 prefecture-level cities in China in 2011 and 2019
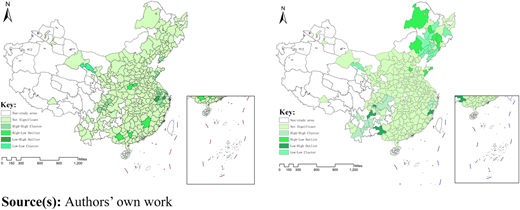
LISA clustering of tourism eco-efficiency values in 277 prefecture-level cities in China in 2011 and 2019
LISA clustering of tourism eco-efficiency values in 277 prefecture-level cities in China in 2011 and 2019
In order to judge the spatial agglomeration characteristics and spatial dependence degree of tourism eco-efficiency, this paper calculated the global Moran’s I index of tourism eco-efficiency level in 2011 and 2019 by ArcGIS software, and the results were 0.109 and 0.126 respectively, both of which passed the significance level test of 1%, which indicates that there is agglomeration phenomenon in the level of city tourism eco-efficiency in China, showing the characteristics of spatial dependence, and the spatial positive correlation is gradually increasing. Due to the vulnerability and environmental dependence of the tourism industry, it is easy to be affected by sudden factors, and the spatial agglomeration and evolution of tourism eco-efficiency are synchronised. As can be seen from Figure 3, the spatial distribution pattern of tourism eco-efficiency in Chinese 277 cities has not changed significantly, and the proportion of the four agglomeration areas has basically remained relatively stable, the number of cities in high-high agglomeration areas has been increasing, and low-high agglomeration areas are mostly located at the edge of high-high agglomeration areas. These two kinds of agglomeration areas are mainly distributed in the southwest and the eastern coastal areas. The high-low agglomeration area and low-low agglomeration area are mainly distributed in Northeast China, mainly due to the weak social and economic foundation in this region and the obvious seasonality of tourism.
4.1.2 Analysis of development trends in the digital economy
As shown in Figure 4, the average digital economy development levels of China as a whole and its four major economic regions (East, Central, West and Northeast) from 2011 to 2019 are presented. The overall trend indicates that the digital economy development levels have risen across China and all regions, with significant growth observed particularly around 2013 and 2016. This upward trajectory is closely linked to several key policies, notably the implementation of the “Broadband China” strategy in 2013 and the “Digital China” initiative proposed in December 2015, which have provided substantial support for digital economy development. Regionally, there are notable differences, though the development gap between regions is gradually narrowing. The eastern region has consistently been in the lead, benefiting from strong digital infrastructure that supports the growth of high-tech industries and provides a first-mover advantage in industrial upgrading. In contrast, the central and western regions lag in terms of digital infrastructure, while the northeastern region faces challenges due to its traditional industrial structure and population decline, resulting in a lower level of digital economy development.
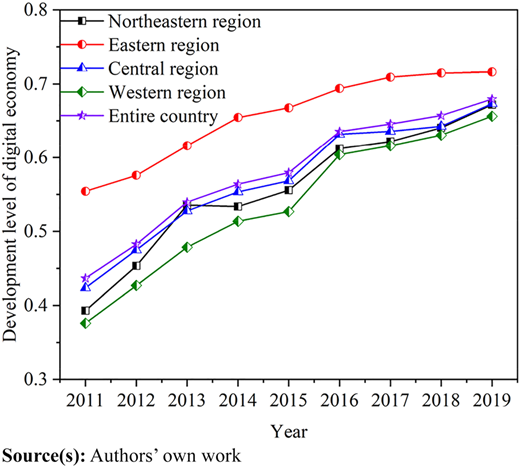
Development level of the digital economy in China from 2011 to 2019
Development level of the digital economy in China from 2011 to 2019
4.2 Baseline regression and threshold effect test
In order to test the smoothness of the data and avoid spurious regression, the unit root test is carried out before the test, and the resultant P-values all pass the 1% significance test, rejecting the original hypothesis of the existence of a unit root. With the help of the Hausman test to determine the estimation form of the model, judgement in the fixed effects and random effects should be selected fixed effects. The estimation results based on model Equation (3) are shown in columns 1 through 5 in Table 3. The regression coefficient is 0.899 and passes the 5% significance test when both year and city fixed effects are controlled. It shows that the digital economy has a positive contribution to tourism eco-efficiency, assuming that H1a holds true. On the one hand, the development of digital technology helps to achieve the end treatment of pollutants through technological innovation, energy utilisation and cost savings, and even the front-end breakthrough improvement of pollution sources. On the other hand, the digital economy is playing a pivotal role in optimising the structure of the tourism industry and creating an intensive tourism resource development model, which contributes to the improvement of tourism eco-efficiency. The scale of the tourism industry characterised by tourism consumption per capita is not significant in the overall regression, and the impact coefficient is small. The overall regression results are not significant due to the large gap in the scale of the tourism industry between different cities in terms of economic development, resource endowment and other factors. The regression coefficient of the regional science and technology innovation level characterised by the proportion of science and technology expenditure in public financial expenditure is negative, the regression coefficient of the actual foreign capital utilisation and urbanisation level is positive, and all of them have passed the 1% significance test. Science and technology innovation needs to pay more time, manpower, capital and other costs, which has a negative impact on the current eco-efficiency, while foreign capital provides financial support for local economic development and urbanisation plays a capital, talent and other elements of the agglomeration effect are conducive to the development of the tourism industry, which positively affects the tourism eco-efficiency.
Test results of baseline regression, threshold and adjustment effect
| Teco | Teco | Teco | Teco | Teco | Teco | Teco | Teco | |
|---|---|---|---|---|---|---|---|---|
| dig | 1.029*** | 0.947*** | 0.700*** | 0.996*** | 0.899** | 0.934*** | 0.954*** | |
| (4.880) | (4.438) | (3.040) | (3.802) | (1.674) | (4.369) | (4.458) | ||
| dig (dig≤0.631) | 0.696* | |||||||
| (1.875) | ||||||||
| dig(dig>0.631) | 0.927*** | |||||||
| (2.703) | ||||||||
| enr | 1.950 | 1.811 | ||||||
| (0.947) | (0.879) | |||||||
| interaction | −0.991* | |||||||
| (−1.710) | ||||||||
| ptc | 0.006 | −0.024 | −0.005 | −0.034 | 0.003 | 0.010 | 0.011 | |
| (0.269) | (−0.859) | (−0.219) | (−1.180) | (0.045) | (0.464) | (0.507) | ||
| til | −0.203*** | −0.162** | −0.422*** | −0.517*** | −0.779** | −0.191*** | −0.193*** | |
| (−2.891) | (−2.123) | (−3.008) | (−3.588) | (−2.565) | (−2.690) | (−2.721) | ||
| fi | 0.003*** | 0.002*** | 0.003*** | 0.002*** | 0.003*** | 0.003*** | 0.003*** | |
| (5.662) | (3.389) | (5.659) | (3.336) | (3.405) | (5.669) | (5.599) | ||
| urb | 0.339*** | 0.601*** | 0.254** | 0.435** | 0.043 | 0.332*** | 0.323*** | |
| (3.579) | (4.121) | (2.472) | (2.375) | (0.094) | (3.480) | (3.392) | ||
| Year fixed effects | Yes | Yes | Yes | Yes | ||||
| City fixed effects | Yes | Yes | Yes | Yes | ||||
| _cons | −0.006 | −0.141 | −0.093 | −0.098 | 0.177 | 0.184 | −0.145 | −0.153 |
| (−0.044) | (−1.015) | (−0.568) | (−0.578) | (0.822) | (0.511) | (−1.040) | (−1.094) | |
| Sample size | 2,493 | 2,493 | 2,493 | 2,493 | 2,493 | 2,493 | 2,493 | 2,493 |
Note(s): ***p < 0.01, **p < 0.05, *p < 0.1 significance level
Source(s): Authors’ own work
In order to verify whether there is a non-linear effect of digital economy development on tourism eco-efficiency, single and double-threshold estimations are carried out sequentially according to model Equation (4). The estimation results obtained using bootstrap sampling 500 times (column 6 of Table 3) show that the single threshold for the impact of the digital economy on tourism eco-efficiency is significant at the 5% level, with a threshold value of 0.631. However, it does not pass the double-threshold test (Figure 5), assuming that H1b holds true. The confidence interval indicates that the resulting single threshold passes the validation. When the level of digital economy development is less than 0.631, the coefficient of the impact of the digital economy on tourism eco-efficiency is 0.696, which passes the 10% significance level test; when the level of digital economy development is >0.631, the coefficient of the impact of the digital economy on tourism eco-efficiency increases to 0.927, and it passes the 1% significance level test. When the digital economy is underdeveloped, it remains in the initial stages of digital infrastructure development and cost investment. Most tourism enterprises struggle to adapt to the organizational management requirements of the digital economy, and the potential benefits of digitalization have yet to be realized. As the digital economy reaches a critical threshold, its facilitative impact escalates significantly, underscoring the importance of developing the digital economy as a pivotal strategy. In summary, the impact of the development of the digital economy on the improvement of tourism eco-efficiency is not a simple linear relationship, and in this paper, the number of cities with digital economy levels exceeding the threshold value (0.631) is less than half of the 277 cities in China.
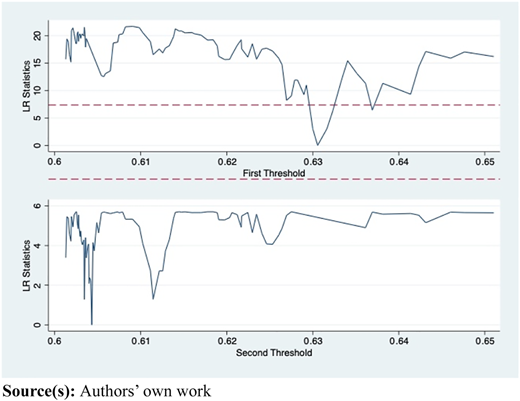
Threshold estimates and confidence intervals
Threshold estimates and confidence intervals
4.3 Moderating effects
In order to verify whether there is a moderating role of environmental regulation intensity in the process of the impact of digital economy development on tourism eco-efficiency, the digital economy level and environmental regulation intensity are first decentred, and then estimated according to the model equations (5) and (6). The results show (Columns 7 and 8 of Table 3) that the regression coefficient of the cross term between the digital economy level and the environmental regulation intensity is −0.991 and passes the significance test at the 10% level. This suggests that environmental regulation intensity weakens the positive impact of the digital economy on tourism eco-efficiency in general, assuming that H2 holds true. The intensity of environmental regulation is not the higher the better, environmental regulation does not play the role of “icing on the cake”. The reason is that environmental regulation affects tourism eco-efficiency through technological innovation and the cost effects of the digital economy. The intention of environmental constraints is to protect the environment and promote the improvement of eco-efficiency, and appropriate environmental regulation has a positive impact on the ecological environment (Wang et al., 2021b; Yasmeen et al., 2020). The reason for the negative impact is that there is still much room for improvement in the development level of the digital economy in most regions of China, and the innovative effect of the digital economy on energy conservation and emission reduction technology and clean energy utilisation triggered by environmental regulation is temporarily insufficient to offset the effect of transferring the cost of pollution control brought about by it. That is the cost of technological innovation in the development of technology is transferred to the cost of pollution control. Limited by the technical level of factors, the intensity of environmental regulations will further promote the tourism industry to increase the cost of management from the end, and then reduce the cost used in the field of technological innovation, so as to form vicious feedback.
4.4 Endogeneity test
To address the estimation bias resulting from potential endogeneity issues such as omitted variables and reverse causality, this study performs endogeneity tests using the instrumental variable method, lagged explanatory variable and lagged control variables (Table 4). (1) According to Tang and Li (2024), this study takes the average annual temperature of Guiyang City, which has attracted the data centres of Huawei, Alibaba, Tencent, Apple and other Internet enterprises, as the benchmark, and takes the absolute value of the average annual temperature difference between each city and Guiyang City (temp) as the instrumental variable. Employing the two-stage least squares method, the F value obtained is 18.952, which is greater than 10, indicating the absence of weak instrumental variables. The number of instrumental variables matches the number of endogenous explanatory variables, ensuring no overidentification issue. The estimated coefficients for the first and second stages are significantly negative and positive, respectively. Compared to the benchmark regression results, the coefficient sizes differ slightly but maintain the same significant directional influence. This indicates that the conclusion remains robust when accounting for endogeneity in the regression model. (2) The regression test of digital economy variables with a one-stage lag (L.dig) compared to the non-lag results shows minimal changes in the symbols and significance, demonstrating the robustness of the results. (3) To mitigate potential endogeneity issues with control variables, the regression analysis is re-conducted with control variables lagged by one period. The estimated parameters are similar to the non-lag results, confirming the robustness of the findings.
Results of endogeneity test and robustness test regression estimation
| 2SLS Phase I | 2SLS Phase II | Lagged explanatory variable | Lagged control variables | Re-calculating explanatory variable | 5% tail-off treatment | |
|---|---|---|---|---|---|---|
| temp | −0.014*** | |||||
| (2.99) | ||||||
| dig | 0.714** | 0.684*** | 0.341** | 1.391** | ||
| (2.295) | (2.664) | (2.188) | (2.551) | |||
| L.dig | 0.298*** | |||||
| (3.160) | ||||||
| Control variables | Yes | Yes | Yes | Yes | Yes | Yes |
| Year fixed effects | Yes | Yes | Yes | Yes | Yes | Yes |
| City fixed effect | Yes | Yes | Yes | Yes | Yes | Yes |
| _cons | 0.574*** | 10.342** | −0.269 | −0.100 | 0.463** | −0.414 |
| (4.503) | (2.349) | (−1.049) | (−0.600) | (2.175) | (−1.021) | |
| N | 2,484 | 2,484 | 2,493 | 2,216 | 2,493 | 2,493 |
| F | 18.954 | |||||
| Prob > F | 0.003 | |||||
| Adj_R2 | 0.579 | 0.466 | 0.653 | 0.361 | 0.632 | 0.798 |
Source(s): Authors’ own work
4.5 Robustness test
In order to further test the validity of the results, this paper tested the robustness of the model by re-calculating the digital economy development level index and shrinking the tail (Table 4). (1) In order to avoid the bias caused by the measurement method of indicators, the entropy method is used to re-calculate the digital economy development level of each city, and then the regression test is carried out, compared with the regression result of the digital economy level measured by the PCA method above. The symbol and significance of the obtained results have little change, which proves that the results are robust. (2) Some regions have better digital infrastructure and enjoy a high reputation for tourism resources at home and abroad, which will attract tourists to consume, while some cities in remote areas are on the contrary. In order to eliminate the bias of the results of the overall regression caused by extreme values, a 5% tail-off treatment is carried out on the development level of digital economy and tourism ecological efficiency, and then a regression test is conducted. Compared with the non-tail-off results, The symbol and significance of the obtained results have little change, which proves that the results are robust.
4.6 Heterogeneity analysis
Different characteristics of cities in terms of digital economy and environmental regulation level, economic development level and population size may lead to differences in the impact of digital economy development on tourism eco-efficiency. Therefore, they are distinguished according to different criteria, and the heterogeneous impact of digital economy development on tourism eco-efficiency is investigated.
4.6.1 Level of the digital economy development and intensity of environmental regulations
Different from the large-scale regression of eastern, central and western regions, which could not effectively test the differences among cities in the past, this part is divided into four types according to the median value of digital economic development level and environmental regulation level of each city, including high-high (g1), low-high (g2), low-low (g3) and high-low (g4), and the test of the sub-sample is carried out (Figure 6). The absolute value of the regression coefficient shows that g3>g4>g2>g1. The group of high-high (g1) passes the test of significance level of 10%. The group of low-high (g2) is insignificant. The group of low-low (g3) and high-low (g4) passes the test of significance level of 1%. The regression results of g2 and g4 indicate that the higher the intensity of environmental regulation, the weaker the promotion effect of the digital economy on tourism eco-efficiency, and gradually tend to be insignificant. Environmental regulation plays a negative moderating role in the process of the digital economy affecting tourism eco-efficiency, and this result further verifies the robustness of the moderating effect results above. The regression results of g1 and g3 are significant, indicating the existence of polarity effect. When both the level of the digital economy and the intensity of environmental regulation are higher or lower, the promotion effect of the digital economy on tourism eco-efficiency is very obvious, but the regression coefficients are lower at higher levels.
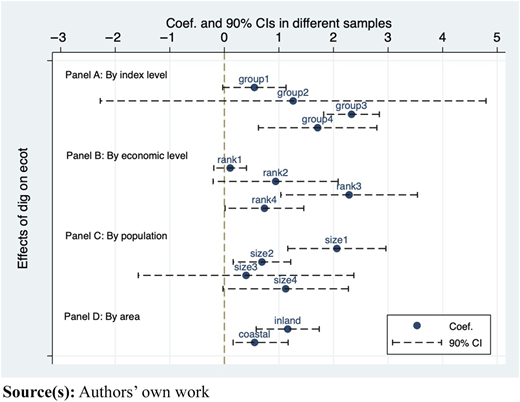
Visualisation of heterogeneity test results
Visualisation of heterogeneity test results
4.6.2 Economic development level of the city
Tourism development and local economic development are closely linked, in order to explore whether there are certain differences in the impact of the digital economy on tourism eco-efficiency in different economic development levels of cities. According to the “2019 City Business Charm Ranking”, Chinese cities are divided into first-tier cities (including new first-tier, r1), second-tier cities (r2), third-tier cities (r3), fourth-tier and below cities (r4). The test of the sub-sample is carried out (Figure 6). The absolute value of the regression coefficient shows that r3>r2>r4>r1. The r3 and r4 respectively passed the significance test of 1% and 5%, and the rest are not significant. The higher the level of economic development, the weaker the positive promoting effect of digital economy development, indicating that there is a complementary effect between digital economy and economic development in the impact on tourism eco-efficiency. Compared with regions with higher levels of economic development, the promotion effect of the digital economy in the sinking market is more obvious. On the one hand, the development factors of China’s digital economy, such as digital infrastructure, are still in the initial stage of construction in third-tier and fourth-tier cities, and the initial application of digital technology has brought about the improvement of leapfrog tourism eco-efficiency. Compared with third-tier cities, the digital infrastructure of fourth-tier and below cities is weaker, so the promotion effect is lower than that of third-tier cities. On the other hand, high economic level areas are important gathering places for tourists to choose tourist destinations and have a larger source market and industrial scale than third-tier and fourth-tier cities. The higher amount of garbage generated in the development of tourism resources, transportation, accommodation and catering in tourism activities is not conducive to the improvement of tourism eco-efficiency. The scale of the tourism industry (ptc) passes the significance test of 1% and 5% in the third-tier, fourth-tier and below cities in this test with a positive effect, but it is not significant in the other two groups, which further confirms the idea.
4.6.3 Population size of the city
Due to the attribute of factor agglomeration effect, cities can improve the level of tourism industry and promote the development of its related industries. It is precisely this agglomeration that makes its scale expand continuously. In order to explore whether cities with different population sizes have certain differences in the process of the impact of the digital economy on tourism eco-efficiency, this part is based on the criteria for classifying city sizes according to population in the Notice on Adjusting the Classification Standards of City Sizes promulgated by The State Council of China in 2014. It is divided into four types: super cities (s1), large cities (s2), medium cities (s3) and small cities (s4). The test of the sub-sample is carried out (Figure 6). The absolute value of the regression coefficient shows that s1>s4>s2>s3. The two groups of supercities and large cities respectively all passed the 1% significance test, medium cities were not significant, and small cities passed the 10% significance test. Large-population cities have strong city functions. Under the condition of the same tourism resources quality, large-population cities can often obtain higher tourism income than small-population cities. The phenomenon of strong tourism development of cities with a very large scale in the Yangtze River Delta region shows demographic dividend. This is because the size of the population as an explicit feature of the city directly affects the tourism development needs to rely on the service reception industry, business and trade industry. Large-population cities not only have prominent functions and positions in terms of tourism supply but also serve as huge tourist source markets in terms of demand, which promotes the multiplier effect of tourism development and is conducive to improving tourism eco-efficiency. In small-population cities, the development of tourism is weak, the accessibility is low, the infrastructure is not perfect, and the emission of tourism pollutants is low. In addition, the impact of the digital economy on tourism eco-efficiency is manifested as promotion.
4.6.4 Coastal and inland cities
To explore whether the differences between coastal and inland cities in terms of geographic location, economic structure, infrastructure development, etc. will affect the relationship between digital economy and tourism eco-efficiency, this section divides the 277 cities under study into 53 coastal cities (excluding Hong Kong, Macao, Taiwan and Sansha city) and 224 inland cities. A sub-sample analysis was conducted (Figure 6). The results show that the impact coefficient for inland cities is greater than that for coastal cities, with both passing significance tests, but the significance level for inland cities (1%) is higher than that for coastal cities (10%). On one hand, the digital economy development and tourism eco-efficiency in coastal cities are generally high, and the widespread application of digital technology has optimised their tourism eco-efficiency, leaving limited marginal benefits for further improvement. On the other hand, the digital infrastructure and technology applications in most inland cities are still in the process of gradual development, and the introduction of the digital economy has had a more significant positive impact on tourism eco-efficiency, indicating stronger growth potential in inland cities. Additionally, the smaller sample size of coastal cities may also explain the relatively weaker significance of the regression results compared to inland cities.
5. Discussion
5.1 Theoretical contributions
This paper makes several contributions to the theory. First, compared with previous studies on the relationship between the digital economy and eco-efficiency, environmental regulation and eco-efficiency, this study for the first time included the three factors into the research horizon at the same time and constructed a “digital economy—environmental regulation—tourism eco-efficiency” model to analyse the mechanism of the three factors. This expands the depth of research on digital economy and environmental regulation in the field of tourism. Second, based on the development needs of policy specialisation, industry refinement and regional scale reduction, this study systematically sorted out the core essentials and index evaluation of tourism eco-efficiency. Compared with previous studies on different annual data or provincial scale of a country, this study for the first time measured tourism eco-efficiency at the city level in China. It is of great practical significance to reveal the interaction and coordination relationship between tourism development and the ecological environment more clearly and provide guidance for formulating policy framework in line with regional development characteristics. Third, based on the urgent issue of coordination between tourism economic development and ecology, this paper not only measures the threshold effect of the digital economy on tourism eco-efficiency but also focuses on the moderating role of environmental regulation in this process, providing a basis for improving the level of environmental governance in the process of tourism economic development.
5.2 Managerial implications
The ecological environment should be protected by using the relevant technologies of the digital economy. First, optimise the functional system of digital infrastructure policies. Lead in top-level design, ensure the high-quality supply and financial support of digital infrastructure policies, and promote the continuous enhancement and advancement of new infrastructure facilities such as the National Comprehensive Pilot Zone for Big Data, the new generation of information and communication networks, and the smart radio and television network to establish a new digital infrastructure network system. Establish a government-driven, sector-coordinated and socially participatory mechanism to enhance eco-efficiency in the cross-regional digital economy, and explore a new cross-regional green development and governance model for the tourism industry. Second, broaden the application scenarios of digital economy technologies. From the point of the end of pollution, digital technology is used to consolidate the scientific and technological foundation of the ecological environment and accelerate the construction of a digital ecological environment system that integrates waste water, waste and solid waste treatment and disposal facilities and monitoring and supervision capabilities. From the perspective of the pollution front, strengthen the digital management and protection of ecological resources, and promote the innovation and popularisation of energy and emission reduction technologies with digital technology. At the same time, play the role of media environmental governance based on digital technology, increase the promotion of green consumption, green travel, green homes and other green smart lifestyles, and lead residents to green consumption.
This approach accelerates the deep integration of digital technology and tourism through online live tourism and digital representation of offline destination scenes, thereby promoting the growth of tourism economic benefits. To facilitate greater investment in research, development, and innovation of digital and emission reduction technologies, establishing a reciprocating positive feedback loop will drive the green effects of the digital economy, benefiting the tourism ecology.
The green development of tourism should be coordinated with digital economy technology and environmental regulation. First, based on data elements to support green technology innovation and digital transformation of tourism enterprises. With the help of digital technology, dig deep into the value of data information elements, eliminate the data barriers between regions, departments and levels, enhance resource utilisation, reduce pollution and foster the innovation of new business models such as “Internet + tourism”. This approach accelerates the deep integration of digital technology and tourism through online live tourism and digital representation of offline destination scenes, thereby promoting the growth of tourism economic benefits. So as to invest more funds in the research and development and innovation of digital technology and emission reduction technology. The formation of such a reciprocating positive feedback loop provides the impetus for the release of green effects of the digital economy to benefit the tourism ecology. Second, use digital technology and environmental regulation to establish a collaborative governance mechanism. Establish a decentralised collaborative governance mechanism of “pre-supervision—in-process regulation—post-relief”, further deepen institutional and environmental reform, optimise the scope of environmental performance assessment incentives and indicators, accelerate the transformation and application of digital innovation achievements in the ecological new channel of tourism resource protection and inheritance, play the backforcing effect of environmental regulations, and supervise and restrict behaviours that damage the ecological environment. Coupled with the price mechanism and fiscal and tax mechanism, to promote the development of low-carbon and green development of the tourism industry,
Take measures to protect the ecological environment based on the differences in the empowering effects of the digital economy in different cities. First, in areas with a high level of digital economy development (such as Beijing, Shanghai, Shenzhen, etc.), continue to optimise the digital innovation ecosystem related to tourism. Expanding the deep integration and efficient application of digital technology in scenic spots, hotels, travel agencies and other tourism scenes, encouraging leading enterprises in the tourism industry to give play to the spirit of innovation and market subjectivity, exploring new energy conservation and emission reduction technologies and improving energy efficiency. The intensity of environmental regulations is not linearly proportional to the efficacy of digital economy. In these areas, the intensity of regulations should be moderately weakened, and source management should be promoted to improve the tourism eco-efficiency. Second, in areas with underdeveloped digital economy and remote areas, pay attention to avoid the trap of “digital blindness”. Accelerate the construction of new infrastructure such as the full coverage and application of digital networks to narrow the digital divide and release the dividends of the digital economy. There is a substitution effect between the digital economy and environmental regulation in terms of eco-efficiency, and the intensity of environmental regulation should be appropriately strengthened in these areas.
6. Conclusion
The information-intensive nature of the tourism industry is naturally compatible with the digital economy, and the development of the digital economy is gradually penetrating into every value segment in the whole process of tourism services. It is necessary to deeply explore and reflect on how to rely on the development characteristics of the digital economy to achieve the high-quality green development needs of tourism. Several intriguing conclusions can be drawn from the findings.
China’s tourism eco-efficiency has the spatio-temporal characteristic of steady growth amid fluctuations. At the same time, it has prominent regional imbalances and spatial differentiation characteristics with the Matthew effect. High-efficiency areas are mostly concentrated in coastal, river and lake areas, or in popular tourist cities with high tourism resource endowments.
Digital economy has a positive promoting effect on tourism eco-efficiency, which is non-linear and has a single threshold effect (0.631). When the level of the digital economy exceeds the threshold value, its promoting effect increases from 0.696 to 0.927.
Environmental regulation does not play an “icing on the cake” role in the process of digital economy affecting tourism eco-efficiency. The innovation effects of the digital economy triggered by environmental regulations on energy conservation and emission reduction technologies and clean energy utilisation are temporarily insufficient to offset the cost-shifting effect of pollution control.
According to the heterogeneity analysis of the development level of the digital economy and environmental regulation intensity, economic development level, population size, coastal and inland cities, the positive promotion effect of the digital economy is stronger and more significant in super cities, large cities and inland cities, as well as in sinking markets where the intensity of environmental regulation is lower.
This study makes a new empirical attempt in the field of tourism ecology and obtains research conclusions with practical guidance, but there are still limitations. The differences in environmental regulation effects of different types and intensities could be explored in subsequent studies. Meanwhile, with the development of the digital economy, whether there is a double-threshold or multi-threshold effect, and whether environmental regulation can play a positive moderating role need to be further examined in the future.
Funding: This study is funded by the National Social Science Fund of China (No. 24BGL134); the Shandong Province Natural Science Foundation of China (No. ZR2023MG065).

