

Global warming and climate change have recently become the most challenging environmental issues, mainly caused by greenhouse gas emissions, especially CO2. As a result, studying and estimating the shadow price of carbon has also become an important research topic.
In this context, the present study conducted a systematic literature review on the drivers of the carbon shadow price (CSP) over the past two decades, from 2005 to 2025. The present research classifies and synthesizes findings from 43 peer-reviewed publications across industrial, agricultural and urban sectors using the PSALAR protocol.
Key drivers include technological advancements, economic development, regulatory frameworks, energy structures and regional disparities.
An inclusive driver framework is developed to classify CSP drivers, assisting policymakers in optimizing carbon management strategies toward sustainable development.
1. Introduction
In recent years, climate change and global warming have been the most challenging environmental issues mainly caused by greenhouse gas emissions, especially CO2. Thus, an urgent reduction of CO2 emissions is vital to prevent global warming and climate change (Saman and Pauna, 2023; Zhang et al., 2014). However, reducing CO2 emissions might challenge economic resources and hinder economic growth. Therefore, estimating CO2 has become a popular research topic since the United Nations Framework Convention on Climate Change (UNFCC) established the Kyoto Protocol in 1997 (Du and Mao, 2015; Zhou and Wang, 2016). As a result, curbing CO2 is needed in dealing with climate change, requiring adopting strategies to mitigate the environmental impact of climate change and global warming. The key to developing such practical strategies is the establishment of effective mechanisms, requiring a better understanding of CO2 emissions and economic consequences (Deng et al., 2023).
Furthermore, the shadow price is associated with undesirable outputs, such as carbon dioxide emissions, and provides a straightforward way of indicating the possibilities of adopting cleaner production approaches (He et al., 2021). As a result, estimating CSP has become an essential aspect of the environmental economics disciplines (Zhang et al., 2021). Consequently, selecting quantitative tools for CSP estimation becomes fundamental, as these models offer advanced techniques for estimating costs related to pollution reduction. Estimating CSP allows policymakers to assess economic growth and environmental protection tradeoffs. CSP also shows the tradeoff between Gross Domestic Product (GDP) growth through increased energy use and potential GDP reduction from curbing CO2 emissions (Gamtessa and Çule, 2023). However, understanding the drivers of the CSP is both academically and practically valuable to explore, as it is required to achieve environmental goals for dealing with global warming and climate change issues.
Studying the drivers of CSP is necessary since it helps to understand the economic costs associated with reducing carbon emissions, and then formulating and optimizing policies would be more accurate to improve effectiveness and minimize implementation costs (Duan et al., 2024). On top of that, policymakers could develop more strategies for reducing emissions effectively to utilize resources better and balance economic benefit and environmental protection (Wu et al., 2019). Additionally, studying CSP could provide insights into the regional disparities and possible solutions for achieving co-benefits in pollution and carbon reduction, improving targeted and efficient environmental governance (Shang et al., 2024). Also, identifying the drivers of shadow prices can highlight organization-level inefficiencies. Policymakers could incentivize organizations to adopt best practices and improve operational efficiency. As a result, they could increase production with fewer emissions and reduce emissions (Murty et al., 2007; Wei et al., 2013).
As mentioned, studying CSP drivers could be practically and academically beneficial, motivating the present study to develop an inclusive framework of CSP drivers by conducting a systematic literature review of the last 2 decades publications. An inclusive framework of CSP drivers could improve understanding of how technological and economic developments or environmental regulations could shape CSP dynamics. Moreover, it could bridge gaps in existing research and provide a holistic perspective of the CSP and its role in CO2 reduction, guiding researchers and strategists in addressing challenges. To this end, the main aims of the present study are as follows:
Studying the drivers of carbon shadow pricing introduced between 2005 and 2025
Synthesizing the gathered data and classifying them according to sectors
Developing an inclusive of the drivers of the carbon shadow pricing
The structure of the present study is as follows: Section 2 presents the research method and steps for selecting publications using keywords. Section 3 presents the drivers of carbon shadow pricing and gathered data in charts and tables. Section 4 presents the developed framework of the drivers. Section 5 presents conclusions and recommendations for future research.
2. Methods
The present study applied the PSALSAR, which stands for Protocol, Searching, AppraisaL, Synthesis, Analysis, and Report. The PSALSAR integrates the Preferred Reporting Items for Systematic Reviews and Meta-Analyses (PRISMA) 27-item checklist and Searching, AppraisaL, Synthesis and Analysis (SALSA) protocol. SALSA is used to search and analyze the literature with the minimum possibility of subjectivity (Saldías Fernández and Luengo Martínez, 2022). Additionally, PRISMA is used to improve the uniformity and thoroughness of research in four steps and to use a checklist (Moher et al., 2016). Table 1 presents the research method used for reviewing publications.
Step 1: Research protocol. Research questions are designed in this step to set the boundaries of research. The research protocol should be transparent and reproducible, and subjectivity should be minimized. Thus, the research scope should be identified appropriately, making research questions accurate and inclusive. To this end, the present study applied the PICOC framework to build a rigid structure for forming research questions and setting scope and research boundaries. It should be noted that PICOC stands for population, intervention, comparison, outcome, and context (Booth et al., 2021). Table 2 presents the application of PICOC in the present study.
The PICOC framework
| Concept | Definition | Application |
|---|---|---|
| Population | Studies on the carbon shadow pricing drivers | Publications in which drivers or determinants of shadow price are addressed |
| Intervention | The status quo of drivers of carbon shadow pricing in different sectors | Providing an understanding of drivers of the carbon shadow pricing in different sectors |
| Comparison | Studying carbon shadow pricing estimators used in the mathematical models | Providing an understanding of estimators of the carbon shadow pricing in different sectors |
| Outcome | Drivers and determinants of carbon shadow pricing in sectors | An inclusive framework of diverse carbon shadow pricing in sectors |
| Context | Finding the various features studied in the carbon shadow pricing publications | Drivers, determinants, research gaps, and results |
Source(s): Authors’ own work
Research method steps
| Steps | Tasks | Approaches |
|---|---|---|
| Protocol | Study scope: studying the drivers of the carbon shadow pricing | The Population, Intervention, Comparison, Outcome, and Context (PICOC) |
| Searching | Searching for publications in which the drivers were studied | Searching in scientific databases using keywords |
| Appraisal | Selecting eligible publications | Four steps of the PRISMA |
| Synthesis | Classifying data collected from publications | Checklist of PRISMA |
| Analysis | Analyzing data and proposing a comprehensive framework of drivers | Checklist of PRISMA |
| Report | Discussing the results and reporting them in a scientific article | Checklist of PRISMA |
Source(s): Authors’ own work
The following research questions are addressed: (1) What are the drivers of carbon shadow pricing, (2) How do the drivers impact the carbon shadow pricing in different sectors.
Step 2: Searching. Specific keywords are used in this step to search for publications on the research topic. Keywords should be inclusive to ensure the included publications are not based. The following strings are used in the present research to search in Scopus and Web of Science (WOS).
Scopus: TITLE-ABS-KEY(“Emission” AND “Shadow price” AND (Determinant* OR Factor* OR Driver*)) AND PUBYEAR >2005 AND PUBYEAR <2026
Step 3. Appraisal. In reviewing the selected articles, only those meeting the search criteria set were selected based on the objectives of this study according to the PRISMA guidelines. The inclusion criteria stipulated that the search terms had to be in the title, abstract, or keywords and that the articles should be published in highly regarded, peer-reviewed scientific journals. The exclusion criteria included editorial letters, book chapters, review articles, theses, conference proceedings, duplicate publications, and studies not published in English. Figure 1 illustrates the steps of selecting articles.
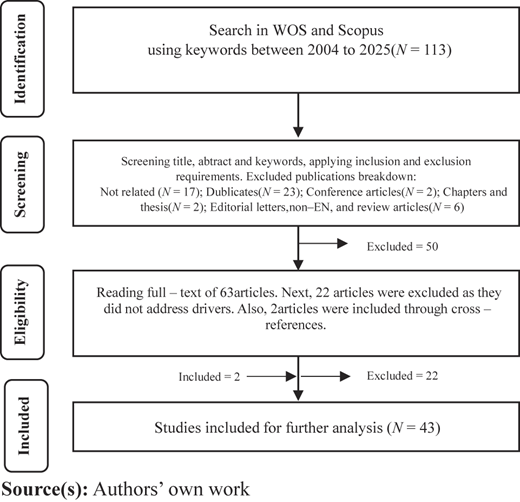
As shown in Figure 1, 43 articles were selected following a rigorous multi-step process guided by the PSALSAR protocol to ensure comprehensive and unbiased inclusion. An initial pool of 113 articles was created at the first stage. Then, titles, abstracts, and keywords were screened according to inclusion and exclusion criteria. Duplicates, conference proceedings, book chapters, review articles, and non-English studies were excluded from this stage.
After this screening phase, 63 articles were shortlisted for full-text review. Each full-text article was assessed to determine whether it explicitly addressed at least one CSP driver and provided relevant empirical or theoretical contributions to the research scope. Articles not meeting these criteria were excluded, resulting in 41 eligible studies. Additionally, two more articles were included through cross-referencing, leading to a final set of 43 articles for synthesis and analysis.
Step 4: Synthesis. The collected data were organized according to sectors, drivers, research gaps, and results. Identified drivers were grouped into industrial, agricultural, and urban sectors.
Step 5: Analysis. This phase answered the main research questions by analyzing the categorized data. The findings from this step are presented in Section 4.
Step 6: Reporting. This step involved summarizing the key insights derived from the analysis in Step 5.
3. The carbon shadow pricing in sectors
The present study classified articles on industrial, agricultural, and urban sectors to highlight drivers of carbon shadow pricing in sectors.
3.1 Industrial sector
The industrial sector connects economic activities with technological development and environmental sustainability. Research in this sector investigates determinants such as firm size, ownership, and energy efficiency concerning CO2 emissions and abatement costs. Also, the implications of stricter environmental policies, market dynamics, and energy mix are highlighted in this sector. Some of the main insights include the rise in shadow costs of CO2 emissions and the integration of clean energy into mitigating industrial pollution. On top of that, this section also highlights production efficiency and minimizing the ecological footprints through improvements in carbon productivity and environmental regulations. Table 3 summarizes studies in the industrial sector.
Publications in the industrial sector
| Author(s) and year | Drivers and determinants | Research gap(s) | Main results |
|---|---|---|---|
| Boussemart et al. (2015) | Pollution cost convergence, economic development, industrial structure, environmental regulations, regional disparities | Estimating environmental growth convergence | Environmental growth convergence relies on structural effects |
| Zhang and Xie (2015) | Technical development and environmental regulations | Developing a general process for modeling sustainable production in the electronic information industry | Stricter environmental regulations and technological innovations influenced the electronic information manufacturing industry |
| Wei et al. (2013) | Firm size, ownership, firm age, technological development, energy mix | Estimating the shadow price of CO2 and exploring its determinants | The relationship between shadow price and its factors remains stable despite alterations in assumptions |
| Lee et al. (2014) | Plant age, size, fuel, and type | Reconciling the shadow price estimates derived via economic and engineering approaches | Shadow price increases as the abatement level increases over time |
| Wu et al. (2021) | Firm scale, ownership, age of technology, coal consumption, urbanization, environmental regulations, energy saving effect, and end-of-pipe controlling effect | Estimating the shadow price of CO2 and exploring its determinants | The various models did not change the finding that the shadow prices for industrial air pollutant emissions have significantly increased in every region |
| Jindal et al. (2024) | plant age, location, size, ownership, and CO2 intensity | Analyzing the abatement cost of CO2 emissions under three scenarios | Plant age ownership, size, location, and CO2 intensity are drivers of abatement costs |
| Yagi et al. (2015) | Environmental regulations and technological development | Estimating the environmental efficiency of international firms | A company’s environmental, social, and governance efforts do not significantly influence its ecological efficiency |
| Wang and Wei (2014) | Environmental regulations, economic development, and regional disparities | Assessing the efficiency of energy use and emissions, quantifying the potential for energy savings and reductions in emissions, and calculating the carbon pricing | The degree of efficiency in CO2 emissions indicates that a region with greater CO2 emissions efficiency will incur more significant costs for decreasing CO2 emissions |
| Sun et al. (2024) | Factor market distortion | Evaluating the total factor energy efficiency | Factor market distortion hindered total factor energy efficiency by affecting technical and scale efficiency |
| Deng et al. (2023) | Carbon productivity, energy efficiency, level of urbanization, Non-fossil energy consumption, production technology, and energy structure | Assessing the shadow price of CO2 for manufacturing firms | Improving energy efficiency, enhancing carbon productivity, considering emission reduction potential and cost differences, and transitioning to non-fossil energy will reduce carbon emissions in the manufacturing sector |
| Jiahuey et al. (2019) | Environmental regulations, technological development, energy efficiency, market dynamics | Measuring total-factor green growth performance | Companies in the chemical sector can reduce expenses and enhance production while adhering to environmental regulations by acquiring CO2 emission allowances |
| Shen et al. (2021) | Environmental regulations, energy mix, economic development, and carbon factor | Estimating carbon shadow pricing using a novel model | The carbon shadow pricing has been rising across all areas, indicating that cleaner energy sources have been incorporated into the energy mix |
| Yan et al. (2018) | Economic development, carbon intensity, carbon factor | Estimating the shadow price | Economic activity is the primary factor influencing the rise in CO2 emissions from thermal electricity generation in China. Meanwhile, improving energy efficiency and changing the fuel composition are essential for lowering emissions on a provincial scale |
| Peng and Liu (2023) | Energy mix, energy intensity, carbon intensity | Estimating the shadow price | The proposed model could effectively estimate the carbon shadow pricing |
| Wang et al. (2022) | Technological development, energy efficiency | Estimating the shadow price | There is a robust U-shaped relationship between carbon intensity and marginal abatement cost |
| Zhang and Pan (2024) | Market dynamics, environmental regulations, economic development, and energy mix | Estimating the shadow price and environmental technical efficiency | The shadow price associated with carbon trading adversely affects the overall green productivity of the power sector in China |
| Guan et al. (2018) | Technological development, planting structure, material input intensity, production efficiency, and economic development | Estimating the shadow price in the planting industry | Policymakers need to strengthen regional collaboration and support the transfer of carbon-reduction technologies to boost the role of intangible production factors in the growth of the planting industry |
| Yu et al. (2017) | Environmental regulations, technological development, and market dynamics | Developing a general approach for modeling production characteristics with carbon emissions | The technical efficiency adjusted for carbon and the costs related to environmental regulations in the Chinese ferrous metal industry has risen substantially over the past few decades |
| Tang et al. (2020) | Environmental regulations, technological development, industrial disparities, market dynamics | Analyzing the marginal abatement cost curves of different sectors | The cost of reducing emissions declines as more sectors get involved |
| Choi and Qi (2019) | Environmental regulations, technological development, market dynamics | Estimating the shadow price and environmental technical efficiency | Policymakers may implement a carbon tax, cut emissions allowances, and boost incentives for energy-intensive, resource-conserving coal plants |
Source(s): Authors’ own work
3.2 Agricultural sector
The agricultural sector discusses agricultural and water issues, focusing on resource management and carbon emissions. The contributing factors include wastewater treatment, energy usage, facility size, and new agricultural practices and water management systems developments. Some of the main insights include the vital need for reducing energy consumption and improving the functional efficiency of both wastewater and drinking water treatment plants. This section also compares organic and conventional agricultural practices regarding their ecological efficiency and carbon footprint. Findings also underline the importance of regional cooperation, modern agricultural technology, and efficient resource allocation for reducing emissions. Table 4 summarizes studies in the agricultural sector.
Publication in the agricultural sector
| Author(s) and year | Drivers and determinants | Research gap(s) | Main results |
|---|---|---|---|
| Molinos-Senante et al. (2015) | Wastewater treatment technology, sewage sludge treatment technology, facility size, plant age, and seasonality | Assessing the shadow price of CO2 | The shadow price of CO2 emissions can be understood as the economic worth of the adverse environmental externalities linked to energy use in wastewater treatment |
| Li et al. (2016) | Energy intensity, carbon factor, environmental regulations, and technological development | Analyzing the main drivers behind energy-related CO2 emission | Reducing energy intensity is the primary reason for the reduction in CO2 emissions |
| Molinos-Senante and Guzmán (2018) | facility size, plant age, the source of raw water, the managing company | Assessing the shadow price of CO2 | Policymakers must implement efficient and effective strategies to meet the ambitious goal of a low-carbon urban water cycle. In this regard, calculating the shadow price of CO2 is crucial to inform environmental policy matters |
| Hamid and Wang (2022) | Economic development, technological development, and regional disparities | Assessing the agricultural total factor productivity | More advanced South Asian nations with higher pollutant shadow prices have less capacity for future carbon emission reductions, while less advanced countries with lower shadow prices have more significant opportunities for such reductions |
| Lu et al. (2023) | Energy structure, water resource scarcity, energy intensity | Proposing a framework to assess the carbon emissions associated with water systems | The extent of the imbalance between the potential for emission reduction and the allocation of carbon emissions indicated an unavoidable convergence |
| Sala-Garrido et al. (2021) | Average pumping head, water and groundwater treatments | Estimating the marginal abatement cost in the provision of drinking water | A positive relationship was identified between the marginal cost of reducing CO2 emissions and various company operational factors |
| Yang and Chen (2023) | Technological and economic development | Assessing the environmental technical efficiency and the shadow cost of carbon emissions generated by peach cultivation | Peach-growing areas’ geography and environmental factors, including soil quality and climate, affect extra resource requirements and carbon emissions |
| Bonou-Zin et al. (2019) | Farm size and production type | Evaluating the ecological effectiveness of organic and conventional cotton | While organic cotton farmers produce fewer greenhouse gas emissions, they are less environmentally efficient than traditional ones |
| Shen et al. (2018) | Technological development, economic development, environmental regulations, and regional disparities | An in-depth analysis was performed to break down the overall inefficiency into technical, mixed, and scale effects within the Chinese agricultural sector | Inefficiency primarily arises from the mixing effect, which necessitates better input reallocation |
Source(s): Authors’ own work
3.3 Urban sector
The urban sector explores the complexity of balancing economic development with sustainability in urban areas. The central themes include projects on low-carbon urban development, energy efficiency, and the interaction between technology and environmental policy. The sector evaluates strategies for meeting carbon reduction targets with improved public transport, energy-efficient infrastructure, and governance frameworks. Some of the main insights include the regional disparities in abatement costs and the implication of urbanization on the environmental outcome. This sector balances development with environmental preservation by addressing transportation efficiency, industrial composition, and international engagement. Table 5 summarizes studies in the urban sector.
Publication in the urban sector
| Author(s) and year | Drivers and determinants | Research gap(s) | Main results |
|---|---|---|---|
| Duan et al. (2024) | International engagement, industrial composition, technological advancement, public transit, and environmental governance | Understanding how marginal costs change for carbon emission and pollution reduction | It emphasizes the vital function of investing in environmental governance and government action as catalysts for co-benefits |
| Liu and Feng (2018) | Energy mix, industrial structure, economic development, financial crisis | Investigating global technical efficiency | Policymakers must consider each country’s varying marginal abatement costs when determining the distribution of abatement responsibilities to maximize the reduction of global CO2 emissions |
| Zeng et al. (2018) | Economic development and technological development | Estimating the shadow price and environmental technical efficiency | The impact of capital-labor intensity on carbon shadow pricing is also high |
| Xu et al. (2022) | Environmental regulations, technological development, economic development | Estimating the causal impact of the low-carbon city project | The low-carbon city pilot project increased the marginal abatement cost of CO2 emissions |
| Tokimatsu et al. (2014) | Environmental regulations and technological development | Developing a model to predict future trends in genuine savings both with and without limitations on CO2 emissions | The proposed model could effectively predict genuine savings |
| Song et al. (2023) | Technological development and regional disparities | There is a lack of a holistic framework that concurrently guarantees fairness and effectiveness in the computation and distribution of costs related to atmospheric environmental governance | The proposed model could effectively balance fairness and efficiency in allocating the atmospheric environment governance costs |
| Zhang et al. (2023) | Economic development, technological development, carbon productivity, environmental regulations, and regional disparities | Assessing and examining the effectiveness of carbon reduction based on various factors | Decreasing emissions further in regions where transportation is highly carbon-efficient is typically more challenging and expensive |
| Zhang et al. (2015) | Environmental regulations | Estimating the shadow price and environmental technical efficiency | Regions with a high degree of substitutability should invest in energy-efficient infrastructure for sustainable development |
| Wu et al. (2019) | Carbon intensity, Energy mix, and city size | Analyzing the dynamic and static distribution determinants of marginal abatement cost of CO2 | There is no definitive convergence trend in the steady-state distribution of marginal abatement cost in the long term |
| He et al. (2018) | Economic development, industrial disparities, and technological development | Studying the financial advantages and gains associated with cooperative reduction | Collaborative CO2 abatement in China can significantly reduce abatement costs and improve cost-effectiveness |
| Chen et al. (2022) | Economic development and environmental regulations | Evaluating and identifying the drivers of global low-carbon economies using satellite data | The effect of strict CO2 reduction policies is more pronounced in nations that start with a low-quality, low-carbon economy |
| Shen and Balezentis (2023) | Energy intensity, energy mix, carbon factor, and economic development | Proposing a nonparametric method that relies on by-production technology, including economic and environmental sub-technologies | Many nations must lower their energy usage and boost the proportion of renewable energy to attain sustainable energy progress and economic development while enhancing environmental outcomes |
| Wang et al. (2018) | Environmental regulations, technological development, carbon productivity, and energy efficiency | Estimating the shadow price | CO2 abatement costs are primarily influenced by carbon productivity and output elasticity of substitution |
| Li et al. (2023) | Industrial disparities and energy mix | Proposing a structure for reaching the carbon peak objective that highlights economic impacts | The expense associated with reducing carbon emissions in the future is extremely high |
Source(s): Authors’ own work
4. Comprehensive framework for drivers of carbon shadow pricing
4.1 Economic development
In the agricultural sector, regional assessments revealed that economically advanced regions showed reduced inefficiencies in carbon emissions. In contrast, less economically developed areas showed more significant opportunities for enhancement (Shen et al., 2018). Also, Hamid and Wang (2022) concluded that economically developed countries, such as India, have higher carbon shadow pricing with limited potential for emission reductions. Poorer countries, like Sri Lanka, have a lower shadow price and more significant reduction potential in the future. Guan et al. (2018) concluded that developed regions with high-value-added agriculture industries, such as Beijing and Tianjin, have higher shadow prices.
In the manufacturing sector, Wang and Wei (2014) concluded that a remarkable economic advancement can enhance CO2 emissions efficiency, particularly once a certain income level is exceeded. More economically developed areas, such as Beijing and Shanghai, consistently had higher shadow prices in the thermal sectors; Beijing has always had some of the country’s highest (Zhang and Pan, 2024). Additionally, in the transportation sector, regions with high economic development, such as Beijing and Shanghai, tend to have higher carbon efficiency and lower carbon shadow prices (Zhang et al., 2023).
In cities and countries, regions with higher economic development often have more advanced technologies and better infrastructure, leading to lower carbon shadow prices (He et al., 2018). These regions can implement CO2 reduction measures to their higher efficiency and better access to resources (Choi et al., 2012; Wang and He, 2017). Shen and Balezentis (2023) concluded that advanced economies tend to have higher carbon shadow prices because of their higher environmental efficiency and ability to invest in cleaner technologies. In contrast, developing economies may have lower carbon shadow prices but face more challenges in transitioning toward greener energy systems. Countries with higher economic output usually have more significant CO2 emissions, but the effectiveness of their low-carbon economies can differ significantly (Chen et al., 2022).
Furthermore, in all provinces in China with advanced economies, technology, energy efficiency, and pollution treatment, the SO2 shadow prices were relatively low; however, regression analysis showed a negative correlation between CO2 and SO2 shadow prices (Zeng et al., 2018). Also, in the thermal power sector, the primary factor impacting CO2 emissions in China was economic development, as it increases electricity demand (Yan et al., 2018). On top of that, Liu and Feng (2018) concluded that the financial crisis has significantly affected the Market Abatement Cost (MAC) of CO2 emissions.
4.2 Technological development
In the manufacturing sector, technological innovation lowers the need for more environmental regulations, impacting carbon shadow pricing. Advancements in pollution control technology could encourage environmental agencies to implement strict regulations that leverage these new technologies (Zhang and Xie, 2015). Also, Yagi et al. (2015) concluded that technological development is crucial for determining carbon shadow prices through environmental efficiency. A shift to more environmentally friendly technologies is needed, which may lead to costs exceeding initial forecasts, thereby increasing the carbon shadow pricing. On top of that, Yu et al. (2017) concluded that increased investment in low-carbon technology boosts carbon efficiency and significantly improves environmental performance. Tang et al. (2020) also showed that improved clean technologies result in a flatter marginal abatement cost curve. It shows a reducing trend in the shadow price of carbon emission. It is also concluded that the technical changes impact the shadow price of carbon (Wang et al., 2022).
Guan et al. (2018) concluded that high-tech agriculture in economically progressive provinces, such as Beijing, Shanghai, and Tianjin, shows higher shadow prices since there are better methods of production that lower emissions but remain profitable. Technological pollution control and energy efficiency advancements can also influence carbon shadow pricing in the chemical sector (Jiahuey et al., 2019). In the water sector, Molinos-Senante and Guzmán (2018) and Molinos-Senante et al. (2015) found that the CO2 shadow price was significantly lower because of the use of anaerobic digestion compared to other technologies.
Moreover, technological development significantly reduces carbon shadow prices by enhancing carbon efficiency in the transportation sector. Regions adopting green and low-carbon technologies, such as energy-efficient vehicles and modern public transportation systems, have higher carbon productivity and lower shadow prices (Zhang et al., 2023). Also, public transportation can reduce reliance on private vehicles, lowering overall emissions and decreasing carbon shadow pricing (Duan et al., 2024). Liu and Feng (2018) concluded that a higher technical efficiency, which often results from technological advancements, leads to higher energy utilization efficiency and a smaller emission reduction space.
An area could face excessive emissions in cities and countries because of outdated technology and poor emission efficiency (He et al., 2018). Xu et al. (2022) also concluded that cities without natural resources reduce emissions through environmental regulations and technological innovation. Additionally, Firms investing in new technologies saw reduced CO2 emissions and operational costs, directly impacting their carbon shadow pricing (Wang et al., 2018). In the agricultural sector, carbon dioxide emissions from agricultural plastic film, pesticides, and fertilizers arise during manufacturing. With technological development, the carbon emission coefficients for these products may vary over time (Shen et al., 2018). Also, Hamid and Wang (2022) concluded that advanced farming technologies lead to more CO2 emissions. That increases costs to reduce emissions and raises carbon prices.
4.3 Environmental regulations
Boussemart et al. (2015) concluded that the benefits of environmental controls are noticeable in the manufacturing sector, as strict regulations may lead to economic downturns and social instability. Also, strict regulations can drive technological advancements as companies seek cost-effective solutions. Adopting new and efficient technologies could reduce carbon shadow pricing (Zhang and Xie, 2015). On top of that, strict environmental policies could enhance the shadow price as developed economies tend to reduce emissions. It is aligned with the observed “N-shaped” relationship between CO2 emissions efficiency and GDP per capita (Wang and Wei, 2014). Also, the Chinese government’s stricter CO2 emissions standards raised the marginal abatement costs for the ferrous metal industry (Yu et al., 2017).
Furthermore, Emission Trading Systems (ETS) or other carbon trading systems can internalize the environmental cost of carbon emissions. Therefore, regulations such as trading systems directly impact carbon shadow pricing in manufacturing sectors (Tang et al., 2020). In cities and countries, environmental regulations impact carbon shadow prices by reducing emissions reduction costs through technological development (Xu et al., 2022). Also, Cheng et al. (2019) and Ouyang et al. (2020) concluded that environmental regulations promote technological progress. As a result, marginal abatement costs and carbon shadow prices would be decreased. Zhang et al. (2015) concluded that current environmental regulations are ineffective in the Poyang Lake Ecological Economic Zone (PLEEZ), lowering the carbon shadow pricing in these regions. International engagement initially played a significant role, but its impact on co-benefits, including carbon shadow pricing, has diminished over time (Duan et al., 2024).
In the agricultural sector, Shen et al. (2018) concluded that the positive effects of governmental reformations caused a rise in carbon shadow pricing and improvement in China’s agricultural sector. In other words, introducing more environmental regulations in agriculture increases the shadow carbon price (Li et al., 2016). Also, Yang and Chen (2023) concluded that economic factors affect the capability and tendency of areas to invest in technologies and reduce carbon emissions. Developed regions such as Jiangsu, which have more substantial economic circumstances, show greater efficiency in environmental technology and lower carbon emissions. In the transportation sector, stringent environmental regulations improve carbon efficiency by promoting green technologies and efficient practices. However, overly stringent regulation may heighten compliance costs, affecting regional economic activities (Zhang et al., 2023). In the chemical sector, increasing costs associated with environmental regulations significantly impact the chemical sector’s overall green energy efficiency. Strict regulations elevate carbon shadow pricing as firms face increased expenses to decrease emissions (Jiahuey et al., 2019).
4.4 Regional disparities
Boussemart et al. (2015) concluded that there were notable disparities in carbon shadow prices across various regions in the manufacturing sector. The eastern areas of China showed the highest carbon shadow prices, while the inland and western regions reported lower. Also, Wang and Wei (2014) concluded that the east coast cities have the highest average CO2 emissions abatement cost while the middle cities have the lowest. Also, Shen et al. (2018) concluded that policymakers should address the unbalanced regional development in the agricultural sector as the more developed regions, like the eastern region, have lower carbon abatement costs, while less developed regions face higher costs.
Moreover, Hamid and Wang (2022) concluded that the regional differences in carbon shadow prices among South Asian countries show significant gaps in the cost of reducing agricultural emissions. India has the highest shadow prices, followed by Pakistan and Bangladesh. The transportation sector has considerable regional differences in carbon shadow prices due to economic development, energy configurations, and infrastructure differences. The eastern regions, with higher carbon efficiency, have higher shadow prices than the central and western regions, with lower efficiency (Zhang et al., 2023). In the thermal sector in India, plants in the south generally have higher shadow prices due to higher electricity prices and better performance levels (Jindal et al., 2024).
4.5 Market and industrial structure
In the manufacturing sector, Factor Market Distortion (FMD) leads to inefficient use of resources, resulting in environmental pollution and increasing carbon shadow pricing. It is possible to reduce environmental pollution and lower carbon shadow pricing by reducing FMD (Sun et al., 2024). Entry into global markets and economic restructuring could impact production efficiency and regulatory rigidity, impacting carbon shadow pricing (Yu et al., 2017). In the chemical sector, the balance between the supply and demand for emission permits in carbon trading markets can also influence the shadow price. If the market cost of CO2 emission falls below the shadow price, companies might buy permits instead of investing in abatement strategies (Jiahuey et al., 2019).
South Korea’s energy trading system in the manufacturing sector has a significant disparity between carbon prices and marginal abatement costs, discouraging power plants’ participation and causing supply-demand imbalances in the market (Choi and Qi, 2019). Regions with a high concentration of energy-intensive industries like steel, cement, and chemicals tend to have higher carbon shadow pricing. These industries are significant energy consumers and CO2 emitters, resulting in increased costs for achieving emissions reductions (He et al., 2018). Also, regions with different industrial structures show varying carbon shadow pricing. More carbon-intensive and heavily industrialized areas may initially show lower shadow prices due to their greater potential for emission reductions (Li et al., 2023). Industrial structure plays a pivotal role in shaping the co-benefits, including carbon shadow pricing (Duan et al., 2024).
Furthermore, energy consumption varies significantly among Chinese cities. Northern cities rely more on coal, which is more carbon-intensive than energy sources used in the south. This disparity impacts CO2 emissions and economic costs (Wu et al., 2019). Also, nations that have a higher share of renewable energy tend to have high carbon shadow pricing since their dependence on fossil fuels is relatively lower, which makes further reductions in carbon emissions more costly (Shen and Balezentis, 2023). In the thermal power sector, power generation companies with a higher proportion of coal-based generation capacity generally show a lower shadow price (Wei et al., 2013). The carbon trading shadow price varied significantly across regions and fluctuated over time. For example, in 2019, Guangdong’s shadow price rose sharply, while that of Beijing fell, reflecting the mismatch in market maturity and trading mechanisms (Zhang and Pan, 2024).
In the manufacturing sector, the shadow cost of gas-fired plants is the greatest, while the shadow cost of coal-fired plants remains the least across all abatement levels (Lee et al., 2014). Also, pollution cost convergence is the process by which the costs associated with pollution, including CO2 emissions, become more uniform across various regions (Özyurt and Guironnet, 2011). In the water sector, the primary contributor was the carbon emission factor, which represented the regional energy composition. Notably, a more significant carbon emission factor signified a greater use of fossil fuels in the region (Lu et al., 2023). Also, in the agricultural sector, Guan et al. (2018) concluded that regions producing higher-value crops, such as fruits and cotton, tend to have higher shadow prices because resource requirements are more significant than staple crops like rice located in central regions with lower shadow prices.
4.6 Carbon factor, intensity, and productivity
In cities and countries, Wang et al. (2018) concluded that there is a strong positive correlation between carbon productivity and abatement costs, showing that higher carbon productivity causes a lower shadow price. Shen and Balezentis (2023) mentioned that the carbon factor, the ratio of CO2 emissions to energy consumption, has a significant relationship with carbon shadow pricing. Carbon shadow pricing and carbon productivity, which measure economic output per unit of carbon emission, are inversely related in the transportation sector. High carbon productivity reflects high efficiency, which reduces the economic cost of carbon abatement and shadow prices.
For example, carbon productivity is higher in provinces where industrial and energy structures are optimized (Zhang et al., 2023). In the agricultural sector, the relationship between carbon emission intensity and marginal CO2 reduction costs is “inverted U-shaped.” Initially, higher carbon intensity increases marginal reduction costs, indicating cleaner production technology (Peng and Liu, 2023). In cities and countries, countries with a lower carbon factor tend to have higher carbon shadow prices (Shen and Balezentis, 2023). Also, carbon productivity is directly related to provincial carbon shadow pricing, indicating that as carbon productivity increases, so does the economic production efficiency of the manufacturing sector and energy efficiency (Deng et al., 2023).
Furthermore, the carbon factor relates to CO2 emissions, and a higher carbon factor typically means increased emissions, probably at higher abatement costs in agriculture. Countries with a high carbon factor may face a larger shadow price because changes in fuel mix or investment in technologies are necessary, whereas countries with a lower carbon factor and higher energy efficiency have lower shadow prices (Li et al., 2016). A slight decrease in emission intensity can decrease carbon shadow pricing in cities and countries, especially in economies with elevated emission intensities (Wu et al., 2019).
In the thermal power sector, the carbon shadow pricing is lower in regions with lower carbon factors, like Ningxia and Anhui. It shows a higher potential for CO2 reductions. However, Shandong and Fujian, where reducing energy intensity is key, face higher shadow prices. Additionally, regions like Hebei and Zhejiang still have high emissions despite improving carbon factors and energy intensity. It shows the need for advanced energy technologies to reduce emissions and lower carbon shadow prices (Yan et al., 2018). Jindal et al. (2024) also concluded that plants with higher carbon intensity tend to have higher carbon shadow prices.
4.7 Patterns of shadow prices
In cities and countries, bigger cities generally show higher carbon shadow prices; however, when considering economies of scale and controlling for other variables, larger cities, on average, tend to have lower carbon shadow prices (Wu et al., 2019). A larger power company can utilize economies of scale regarding resource use and pollution control in the thermal power sector. Therefore, a bigger emitter is anticipated to have a reduced shadow price (Wei et al., 2013). Also, smaller plants are typically less efficient; therefore, they tend to have lower shadow prices than larger ones. It should be noted that Molinos-Senante et al. (2015) and Molinos-Senante and Guzmán (2018) concluded the same regarding the plants’ size and age in the water sector.
In the manufacturing sector, Lee et al. (2014) believed that plant age and size affect carbon shadow prices significantly. Also, the type of power plant, like combined-cycle plants, can influence the shadow price. Because they are efficient, combined-cycle plants might exhibit varying shadow prices compared to other plants (Lee et al., 2014). Bonou-Zin et al. (2019) concluded that organic cotton farming is more environmentally friendly regarding GreenHouse Gas (GHG) emissions; however, it faces higher opportunity costs, especially for smaller farms. Also, socioeconomic factors such as access to credit, education, and extension services are crucial in determining cotton production’s efficiency and environmental impact.
Public companies are also typically considered less efficient and produce more pollution than private ones. Also, multinational companies are considered cleaner than local equivalents (Wei et al., 2013). On top of that, state-owned plants are less efficient; thus, they tend to have lower carbon shadow prices than private ones (Jindal et al., 2024). Furthermore, a more recent power company typically utilizes the most advanced environmentally friendly generation units and adopts less polluting technologies. As a result, newer companies find lower emissions more challenging than their established peers (Wei et al., 2013). Jindal et al. (2024) concluded that older plants in the thermal sector tend to have less carbon shadow pricing as they use less efficient and more pollution-intensive technologies.
4.8 Energy intensity, efficiency, and structure
In cities and countries, lower energy intensity, measured as energy use per unit of GDP, is associated with greater economic efficiency and lower CO2 emissions. The carbon shadow pricing may be higher for countries with high energy intensity because of the substantial economic changes required to achieve emission reductions (Shen and Balezentis, 2023). Guan et al. (2018) concluded that in less developed regions, like Northwestern China, this translates to higher marginal emissions abatement costs because of inefficiency. To sum up, developed Eastern coastal areas with well-applied agricultural technologies indicate upward shadow prices because of higher costs related to further reductions. Deng et al. (2023) mentioned that urbanization is linked to the growth of the service sector and the use of energy-efficient appliances. Consequently, energy efficiency may improve, leading to a decrease in CO2 emissions.
In agriculture, a high energy intensity creates an admittance of redemption ratio greater than zero, raising emissions relative to economic output. There is a reduction in consumption, emissions, and shadow prices through adopting energy-efficient machines and systems. There has been sufficient evidence showing that modernizing agricultural practices reduces abatement costs (Li et al., 2016). Also, as a high-carbon energy source, coal emits significantly more CO2 than natural gas and oil. Consequently, the proportion of coal in total energy consumption is used as an indicator to assess the impact of shifts in the energy mix on lowering the marginal cost of CO2 emissions (Peng and Liu, 2023).
Lu et al. (2023) concluded that Liaoning and Jilin faced higher carbon shadow pricing since these regions have a high carbon emission intensity. In contrast, Heilongjiang faced a lower carbon shadow pricing as it has a low carbon emission intensity due to its better performance in the agricultural economy. Improvements in energy efficiency can reduce energy consumption and, consequently, the carbon emissions produced in the chemical sector. As a result, carbon shadow pricing can be reduced by reducing the marginal abatement cost of emissions (Jiahuey et al., 2019).
Moreover, utility firms have higher energy efficiency in cities and countries than material or industrial firms. As a result, they experience lower average carbon abatement costs, showing the positive relation of energy efficiency with carbon shadow pricing (Wang et al., 2018). In manufacturing, improving energy efficiency is key to minimizing energy consumption and lowering carbon emissions. This reduction lowers the overall emission reduction space and increases the MAC. Therefore, a positive correlation exists between energy efficiency and MAC (Wang et al., 2022). Also, carbon shadow pricing is influenced by energy structure and infrastructure. Higher coal consumption increases CO2 emissions, raising the carbon shadow pricing (Wang et al., 2022).
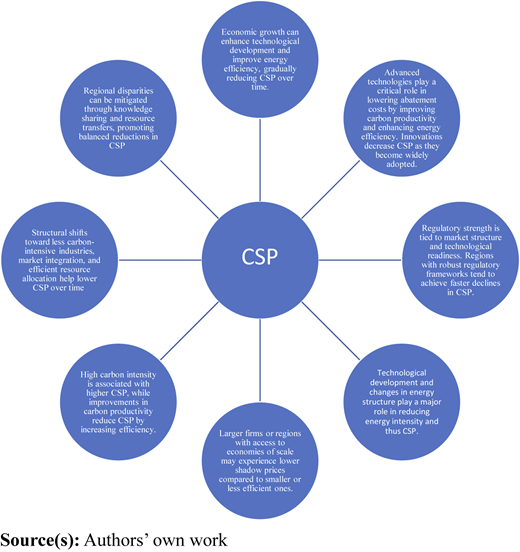
4.9 Drivers and their roles in influencing CSP
The model underscores the multifaceted interaction among the main factors affecting carbon shadow pricing. Economic growth and technological change are the prime movers in inducing carbon productivity and energy efficiency. However, environmental policy sets the stage for adopting technology and emissions abatement efforts. Regional disparities result from unequal access to clean technology and infrastructure, and carbon abatement costs vary globally. Market and industry structures, energy intensity, and carbon productivity also shape various decarbonization opportunities. Figure 2 shows drivers and their roles in influencing CSP.
Recent studies on CSP offer significant insights that could be discussed and compared with the present paper. Zhang and Pan (2024) analyzed CSP effects on green total factor productivity in China’s electricity sector, observing that more shadow prices are associated with higher efficiency. However, they can also impose economic pressure on companies. This result confirms that concentrated solar power is essential in economic development and carbon reduction, yet it must be managed through policy reforms. Likewise, Zhu et al. (2025) also studied CSP among European Union nations and identified substantial differences in carbon pricing owing to differences in economic development and policy severity. Our analysis also underscores the existing regional imbalances in carbon sequestration potential and implies that technological innovation and regulatory policies are fundamental to the differences. Zhang et al. (2024) also analyzed CSP in the agricultural sector and noted that not including livestock emissions might lead to an overestimation of CSP. This conclusion is an important concern for our systematic review, highlighting the need to improve methods for estimating CSP. Yang and Mogi (2024) estimated China’s provincial CSP using stochastic frontier analysis. They concluded that eastern provinces have larger CSP values due to economic optimization but at the cost of declining emission efficiency. This output aligned with our findings that economic structures and industrial composition significantly influence CSP changes. These papers support our finding that CSP is a changing and policy-driven measure. To be most effective in promoting decarbonization policies, CSP needs to consider specific sectors and regions.
5. Conclusions, policy implications and future research
The present study conducted a systematic literature review to analyze the drivers of carbon shadow pricing in different sectors. To this end, 43 articles were reviewed using an integrated protocol named PSALSAR, and the included articles were classified into three groups: industrial, agricultural, and urban sectors. It also highlighted the identified drivers’ economic, technological, and regulatory reasons. The results indicated that CSP is important for evaluating sustainable economic development. In other words, it is an economic indicator reflecting tradeoffs between the economic advantages and ecological costs of CO2 emission.
The industrial sector showed that factors such as the firm’s size, energy mix, and technological changes could influence CSP. Also, the most developed regions or firms have higher CSP because further reductions could be challenging. It can be concluded that adopting clean energy technologies and carbon productivity growth influences CSP. Also, the sector’s contribution to developing innovations toward sustainable industrial practices was highlighted. However, it is also concluded that stricter environmental regulations could increase MAC; therefore, balanced policy measures were required to encourage economic efficiency and carbon reduction.
Energy intensity, water resource management, and modern farming technologies are important drivers impacting CSP in the agricultural sector. Lower CSP can be seen in regions with better agricultural practices and higher economic development. Therefore, it can be concluded that the ability to optimize resource allocation and adaptation of sustainable technologies could impact CSP. Furthermore, regional differences can also be influential, as less developed areas face higher CSP, resulting in inefficient resource use and poor technology adoption. As a result, targeted policies and regional cooperation could help deal with regional differences for uniform and efficient carbon management.
Technological development, economic conditions, and environmental governance interconnections in the urban sector are more noticeable than in other sections. Some research highlighted the public transit system, industrial structure, and carbon productivity as influential factors in CSP. Also, it can be concluded that urbanization could help countries increase their energy efficiency even if they face challenges regarding the fair and efficient distribution of abatement costs. On top of that, new infrastructure technologies and emerging governance frameworks could impact CSP with continued economic growth. Adopting an integrated perspective of drivers in all sectors that embrace regional and international cooperation is also important to reach sustainable development.
5.1 Policy implications
5.1.1 Sector-specific carbon pricing mechanisms
Policymakers need to develop different carbon pricing policies for different industries in order to highlight sectoral disparities in CSP. For example, carbon taxes need to be developed with higher carbon prices for industrial sectors with high technology. This scenario would lead firms to be incentivized to invest in low-carbon technologies. However, agricultural sectors with lower technological capacity should receive targeted incentives, such as tax credits or subsidies to adopt low-emission technologies.
5.1.2 Addressing regional disparities through flexible carbon pricing
Policymakers should design carbon pricing frameworks that account for economic and technological gaps by considering regional disparities in CSP. For instance, low-income regions with high CSP should be assisted by progressive carbon pricing that initially imposes lower carbon fees. However, assistance in developing cleaner technologies should also be provided. Meanwhile, high-income regions with low CSP need stricter pricing policies to achieve further emission reductions.
5.1.3 Investment in technology transfers and innovation support
Governments must invest additional capital in clean technology to minimize CSP imbalances. This goal could be achieved by public-private partnerships that provide funding and incentives to businesses to adopt energy-efficient technology. Cross-border cooperation must also be encouraged to transfer green technologies from high-income to low-income nations. It may ensure that all areas can transition toward low-carbon development without excessive economic burdens.
5.1.4 Integrating carbon pricing into broader sustainable development policies
Carbon pricing should not be the only policy but should be integrated into broader sustainability strategies. This scenario involves associating CSP-based policies with energy transition plans, restructuring schemes, and city planning policies. Urban cities with less CSP must have energy-efficient infrastructure and advanced transportation policies to decrease emissions. However, industrialized regions must prioritize green manufacturing norms and resource policy efficiency. This merging ensures that carbon management is coordinated with long-term economic development and sustainability goals.
5.2 Future research
Future research should develop econometric models to assess how policy stringency affects CSP variations across regions and sectors. Specifically, researchers can employ panel data regression models with fixed and random effects to analyze how different carbon pricing policies influence CSP over time. Also, multi-criteria decision-making methods can be applied to evaluate the importance of the identified drivers in different sectors and evaluate decision-making units according to their performances in dealing with these drivers. System dynamics modeling could also simulate long-term policy impacts on CSP and emissions. Also, it can be used to evaluate the long-term impacts of different carbon pricing policies, such as carbon taxes, cap-and-trade systems, or technology subsidies.
Future empirical validation through case studies, econometric modeling, and simulation-based approaches is also recommended to improve the applicability of the proposed framework. For instance, the framework could be applied to real-world datasets through panel regression analysis. Additionally, Delphi methods could be applied to evaluate the proposed framework for various case studies.
Funding: This project has received funding from the Research Council of Lithuania (LMTLT), agreement No S-MIP-23-36.
