

Prior to the 2010 release of the Common Core State Standards for Mathematics (CCSSM), the curricular landscape in the United States consisted of an assortment of individual state standards that as a collection reflected little consensus as to the grade placement of specific mathematical content. As CCSSM has now been used as the foundation for curriculum decisions for more than a decade, how has this changed? In this article, we documented the levels of agreement regarding the mathematical knowledge and skills to be taught in the middle grades (Grades 6–8) across the United States by considering what areas of agreement exist between CCSSM and the standards of eight states that never adopted or “de-adopted” CCSSM (referred to as non-CCSSM states). Specifically, we addressed the following questions: (1) To what extent are the middle grades standards from non-CCSSM states aligned with CCSSM? (2) What mathematical content is consistent across all states? (3) Which CCSSM strands have the most agreement across CCSSM and non-CCSSM states? (4) What areas of disagreement exist between CCSSM and non-CCSSM states? By dividing the standards included in CCSSM into individual learning expectations and comparing them to the non-CCSSM standards, we were able to find considerable agreement between CCSSM and non-CCSSM middle grades mathematics standards at the same grade level. We recommend that this agreement be used by mathematics education leaders as the foundation for future reform efforts to ensure equitable mathematics curricular goals for all middle grades students regardless of geographic location.
Introduction and Background
The debates regarding what mathematics should be the focus of instruction at specific grade levels have been a source of discussion and contention for well over a century. Although professional recommendations regarding the composition of the mathematics curriculum date to the Report of the Committee of Ten on Secondary School Studies report (National Education Association, 1894), traditionally these decisions have been made at the local level by teachers, parents, and administrators. However, over the past 30–40 years, there has been a steady increase in the role of state and federal agencies in setting curricular standards and policies (Long, 2003). Increased calls for public school accountability and for school improvement have helped to centralize control over decisions regarding the composition of the K–12 mathematics curriculum. This movement was further cemented by the 2001 No Child Left Behind Act (2002), which mandated that states set content standards for mathematics for Grades 3–8. The enactment of this law spurred considerable effort by individual states to specify curriculum standards and goals for mathematics, as states often commissioned committees of education stakeholders from within their state to create these learning goals (Reys et al., 2005).
The diversity of methods used to create state standards as well as the differences in opinions regarding what and when mathematical content should be taught contributed to a wide variance in standards documents across states regarding the grade placement of certain topics as well as the overall structure of the mathematics curriculum (Dingman, 2007; Reys, 2006; Smith, 2011). This variance created inequitable opportunities for students to learn important mathematical content across states as well as contributed to the dramatic growth in the size and the number of topics included in popular mathematics textbooks, as publishers struggled with the conflicting demands of different states. To assist in correcting these issues, the National Governors Association and the Council of Chief State School Officers led an effort to standardize the U.S. mathematics curriculum (Willoughby, 2010). Directed by representatives from 48 states, the District of Columbia (DC), Puerto Rico, and the U.S. Virgin Islands, teams of stakeholders (mathematicians, mathematics educators, K–12 teachers, and administrators) worked to produce the Common Core State Standards for Mathematics (CCSSM, 2010), which provided a common set of curriculum standards that would support the foundation of mathematics learning across the country.
At its peak, CCSSM was adopted by 45 states as well as DC, the U.S. Virgin Islands, Guam, and the Northern Mariana Islands as the basis for mathematics learning. However, backlash against CCSSM led some states to “de-adopt” the standards in favor of their own standards, while other states changed the name of the standards and modified them slightly. Nevertheless, since 2010 CCSSM has become a critical piece in the U.S. mathematics curriculum puzzle regardless of whether a state has adopted these standards. Considerable efforts have been initiated by education stakeholders across the country to develop textbook and curriculum materials that align to the new standards, to provide professional development for teachers to enhance their abilities to teach the new standards, and to create assessments that measure student knowledge and skills in relation to CCSSM. Prior to CCSSM, the U.S. curricular landscape consisted of an assortment of state standards that varied with respect to the mathematical content and skills required to be taught as well as the grade placement at which topics were expected to be learned (Dingman, 2007; Reys, 2006; Smith, 2011). However, the release and subsequent adoption of CCSSM by 45 states, DC, and other U.S. territories spoke clearly regarding the desire for a shared basis for mathematical learning across the United States (Confrey & Krupa, 2012). Regardless of whether or not a state adopted these standards, CCSSM has had a profound impact on mathematics education in the United States.
The purpose of this study was to document the extent to which the standards from the eight states that did not adopt or that have deadopted CCSSM (referred to as non-CCSSM states) aligned with the CCSSM learning expectations at the middle grades (6–8) level. Given the widespread variance in standards prior to CCSSM, this study sought to document the level of agreement that has emerged across the United States since the release of CCSSM. Specifically, we addressed the following questions:
To what extent are the middle grades (6–8) standards from non-CCSSM states aligned with CCSSM?
What mathematical content is consistent across all states?
Which CCSSM strands have the most agreement across CCSSM and non-CCSSM states?
What areas of disagreement exist between CCSSM and non-CCSSM states?
Methods
For the purposes of this research, we used the method created by Tran et al. (2016) to compare CCSSM to non-CCSSM state standards. In this method, the authors took the CCSSM Grades 6–8 mathematics standards and translated them into a list of learning expectations (LEs) by grade level for coding purposes. This method allowed the research team to analyze the standards at a smaller grain size. For example, if a CCSSM standard contained statements detailing three mathematical concepts to be mastered by students, that standard was broken down into three individual LEs. See Table 1 for an example of a CCSSM standard divided into multiple LEs. The smaller grain size allowed for a more accurate comparison of the content across different sets of standards (Tran et al., 2016). Through this translation, the 71 CCSSM Grades 6–8 standards were separated into 57 Grade 6, 49 Grade 7, and 52 Grade 8 topics for a total of 158 middle grade LEs. Although some states that have adopted CCSSM may have chosen to supplement the standards at the middle grades level, the composition of these CCSSM standards are seen as the entire scope of mathematical content in the middle grades in CCSSM-adopting states.
To determine the states that were not currently using CCSSM we used the Common Core website (http://www.corestandards.org/standards-in-your-state/) detailing which states had and had not adopted CCSSM. As of April 2018, nine states (Alaska, Florida, Indiana, Minnesota, Nebraska, Oklahoma, South Carolina, Texas, and Virginia) were not using CCSSM. However, upon deeper analysis, we removed Florida from our list, as the new Florida standards in Grades 6–8 were exactly identical to CCSSM with one additional standard added in Grade 6. The non-CCSSM set of states therefore consisted of eight states: five that never adopted CCSSM (AK, MN, NE, TX, VA) and three that moved to “de-adopt” after originally adopting CCSSM (IN, OK, SC). Table 2 provides the list of non-CCSSM state standards documents analyzed as part of this study.
Example of One CCSSM Standard Divided Into LEs
| CCSSM Standard 6.EE.8 | Corresponding LEs |
|---|---|
|
|
We compiled the standards documents from these eight states for our analysis. For each non-CCSSM state standards document, three members of our research team used the list of CCSSM LEs to code the non-CCSSM standards, individually documenting the grade level at which the same content appeared in both documents. In instances where multiple standards at different grade levels in the non-CCSSM standards matched the CCSSM LE, we recorded the closest grade level at which the LE was found in CCSSM. The codes from each researcher were compiled, and discrepancies were discussed to reconcile differences and create a consensus coding document. In addition, researchers also documented the non-CCSSM standards not found in the list of CCSSM LEs. This content comprised mathematical ideas that were not present in CCSSM yet found in one or more of the non-CCSSM state standards documents. The consensus coding sheet as well as the list of standards not found in CCSSM were then analyzed to answer the proposed research questions.
Non-CCSSM State Standards With Publication Date
| State | Title of Document | Year Published |
|---|---|---|
| AK | Alaska Mathematics Standards | 2012 |
| (Alaska Department of Education and Early Development, 2012) | ||
| IN | Indiana Academic Standards for Mathematics | 2014 |
| (Indiana Department of Education, 2014) | ||
| MN | Minnesota K–12 Academic Standards in Mathematics} | 2007 |
| (Minnesota Department of Education, 2007) | ||
| NE | Nebraska’s College and Career Ready Standards for Mathematics | 2015 |
| (Nebraska Department of Education, 2015) | ||
| OK | Oklahoma Academic Standards for Mathematics | 2016 |
| (Oklahoma State Department of Education, 2016) | ||
| SC | South Carolina College- and Career-Ready Standards for Mathematics | 2015 |
| (South Carolina Department of Education, 2015) | ||
| TX | Texas Essential Knowledge and Skills for Mathematics | 2012 |
| (Texas Education Agency, 2012) | ||
| VA | Mathematics Standards of Learning for Virginia Public Schools | 2016 |
| (Virginia Department of Education, 2016) |
We coded each of the 158 CCSSM LEs to the non-CCSSM middle grades (6–8) standards from the eight non-CCSSM states. When a CCSSM LE was not found in Grades 6–8 in the non-CCSSM standards, we went through the non-CCSSM standards in Grades 4–12 in search of a match for the remaining CCSSM LEs when one could be found, noting the grade level and state standard code when there was a match. In cases where there were multiple state standards from different grades that matched the CCSSM LE, we recorded each grade level match but allowed for the same grade level match to take precedence when accounting for strict alignment between CCSSM and the non-CCSSM standards. The coding sheets for each of the eight non-CCSSM states were then compiled into one large sheet, which allowed us to examine each CCSSM LE in relation to the codes given from each non-CCSSM state’s standards. This analysis provided the basis for the results of the study and permitted us to document those CCSSM LEs found in non-CCSSM states at the same grade level, at different grade levels, or not found at all. Results were also compiled by mathematical strand to determine where CCSSM and non-CCSSM states most agreed in terms of the grade placement of mathematical content.
Results
Upon comparing codes across raters, we reached consensus on the codes from each non-CCSSM state and compiled results to review agreement across states. Results are reported specific to each of the research questions stated previously.
Percentage of CCSSM LEs Included by Each State at the Same Grade Level
| State | Percent of Grade 6 CCSSM LEs Found in Grade 6 (n = 57) | Percent of Grade 7 CCSSM LEs Found at Grade 7 (n = 49) | Percent of Grade 8 CCSSM LEs Found at Grade 8 (n = 52) | Percent of CCSSM LEs Found at Same Grade Level (6–8) (n = 158) |
|---|---|---|---|---|
| AK | 98 | 100 | 98 | 99 |
| SC | 98 | 92 | 100 | 97 |
| IN | 88 | 73 | 69 | 77 |
| TX | 65 | 61 | 62 | 63 |
| OK | 68 | 57 | 50 | 59 |
| NE | 67 | 55 | 52 | 58 |
| MN | 46 | 55 | 54 | 51 |
| VA | 30 | 20 | 31 | 27 |
To What Extent Are the Standards From Non-CCSSM States Aligned With CCSSM?
Analysis of the CCSSM LEs highlighted the wide variance in the degree to which non-CCSSM state standards align with CCSSM. Table 3 outlines the percentage of CCSSM LEs that were found in each non-CCSSM state’s standards at the same grade level. As seen in the table, states such as AK and SC were strongly aligned with CCSSM, with only a few CCSSM LEs not found in each state’s standards. Conversely, MN, NE, and OK’s standards contained less than 60% of the 158 CCSSM LEs at the same grade level, with VA possessing less than 30% of the CCSSM LEs at the same grade.
In addition, a number of CCSSM middle grades LEs were not located at the same grade level in the non-CCSSM state standards, but were found at other grade levels within Grades 4–12 of the state standards. This meant that, although there was not a grade level match, there was agreement between CCSSM and the non-CCSSM standards regarding the inclusion of this topic in the standards. Table 4 outlines the percentage of middle grade CCSSM LEs that were found in each non-CCSSM state’s standards at any grade level within the 4–12 grade band. When comparing Tables 3 and 4, we see that the level of agreement between CCSSM and non-CCSSM standards stayed the same in SC but increases in every other state when the focus is placed on agreement on the topics to be taught in the mathematics curriculum regardless of grade level.
What Mathematical Content is Consistent Across All States?
Despite the variance in the degree to which non-CCSSM states’ standards aligned with CCSSM standards, our analysis allowed us to see which topics were found in the same grade level in all eight non-CCSSM states. In Grade 6, nine of the 57 CCSSM LEs (16%) were found in Grade 6 in all eight non-CCSSM states. Those topics were:
understand ratio and describe a ratio relationship (6.RP.1);
solve problems using ratio (6.RP.3);
divide fractions by fractions, solving word problems (6.NS.1);
fluently multiply and divide multidigit number decimals (6.NS.3);
find and position rational numbers on a number line (6.NS.6);
position pairs of rational numbers on a coordinate plane (6.NS.6);
write, interpret, and explain statements of order for rational numbers in real-world contexts (6.NS.7);
write and evaluate numeric expressions with whole number exponents (6.EE.1); and
represent and solve equations of the form x + p = q and px = q (6.EE.7).
Percentage of CCSSM LEs Included by Each State at Any Grade Level (4–12)
| State | Percent of Grade 6 CCSSM LEs Found at Any Level (n = 57) | Percent of Grade 7 CCSSM LEs Found at Any Level (n = 49) | Percent of Grade 8 CCSSM LEs Found at Any Level (n = 52) | Percent of Middle Grades CCSSM LEs Found at Any Grade Level (4–12) (n = 158) |
|---|---|---|---|---|
| AK | 98 | 100 | 100 | 99 |
| SC | 98 | 92 | 100 | 97 |
| IN | 91 | 90 | 92 | 91 |
| TX | 68 | 78 | 64 | 70 |
| OK | 84 | 78 | 73 | 78 |
| NE | 74 | 61 | 52 | 62 |
| MN | 70 | 80 | 79 | 76 |
| VA | 51 | 43 | 40 | 45 |
In Grade 7, only 3 of the 49 CCSSM LEs (6%) were found in all of the non-CCSSM Grade 7 standards. These LEs were:
use proportional relationships to solve multistep ratio and percent problems (7.RP.3);
solve problems involving addition, subtraction, multiplication and division of rational numbers (7.NS.3); and
represent and solve problems of the form px + q > r (7.EE.4).
Finally, in Grade 8, seven of the 52 CCSSM LEs (13.5%) were also placed in Grade 8 in all of the non-CCSSM standards. These topics were:
locate and compare irrational numbers approximately on a number line (8.NS.2);
solve linear equations with rational number coefficients (8.EE.7);
determine the rate of change and initial value of the function from a description of a relationship or from two (x, y) values (8.F.4);
explain a proof of the Pythagorean theorem and its converse (8.G.6);
apply the Pythagorean theorem in a right triangle (8.G.7);
construct and interpret scatter plots for bivariate data for association between two quantities (8.SP.1); and
understand and use straight lines of best fit (8.SP.2).
These 19 LEs are considered to be “unanimous” across the United States, meaning they exist at the same grade level in both CCSSM and non-CCSSM states. Therefore, students regardless of their geographic location will learn these specific topics at these given grade levels.
Even when the non-CCSSM states matched the grade placement of the CCSSM LEs, they may not have matched in every aspect of the standard. For example, CCSSM called for students to explain a proof for both the Pythagorean theorem and its converse in Grade 8. However, the TX Grade 8 standard most closely matched to this LE was “Use models and diagrams to explain the Pythagorean Theorem” (TX 8.6.C). Although there was no mention of the converse of the Pythagorean Theorem or of a proof in the TX standard, our team documented this standard as matching the focus of the CCSSM LE, as both standards were providing an explanation of why the Pythagorean Theorem works.
Although the percentages of CCSSM LEs found at the exact same grade level in all eight non-CCSSM state standards were low, a much higher percentage of CCSSM LEs were found when we dropped the threshold to aligning with a majority (5 or more) of non-CCSSM state standards. In fact, 43 of the 57 Grade 6 CCSSM LEs (75%) were found in five or more non-CCSSM state standards at the exact same grade level. Similarly, 34 of 49 Grade 7 CCSSM LEs (69%) and 32 of 52 Grade 8 CCSSM LEs (61.5%) were found in a majority of the non-CCSSM states at the matching grade level. These numbers indicated that, while unanimous consensus may be small, there was considerable agreement across CCSSM and non-CCSSM states with respect to the grade placement of key mathematical ideas.
Which CCSSM Strands Have the Most Agreement Across CCSSM and Non-CCSSM States?
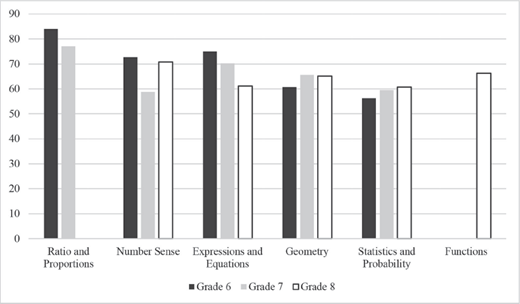
Within our coding, we also noted the mathematical strands in which greater consensus was found. Table 5 breaks down the number of CCSSM LEs for Grades 6–8 located in the same grade level in each non-CCSSM state by content strand. Furthermore Figure 1 illustrates the percentages of CCSSM LEs found on average in each non-CCSSM state at the same grade level in the 6–8 grade band across the six CCSSM content strands. Notably, the Ratio & Proportion strand was only present in Grades 6 and 7 in the middle grades CCSSM, while the Functions strand existed only at Grade 8.
As seen in Table 5 and Figure 1, the highest levels of agreement across CCSSM and non-CCSSM standards existed in the Ratio & Proportion strand, where on average more than 75% of the CCSSM LEs were found at the same grade level in the non-CCSSM states. Conversely, the Geometry and Statistics & Probability strands saw on average the lowest levels of alignment. However, more than half of the CCSSM LEs on average were found at the same grade level in the non-CCSSM states in any given content strand.
These trends were also apparent when we look at the CCSSM LEs that were found at the exact same grade level in a majority of the non-CCSSM states. Table 6 provides the data with respect to the number of CCSSM LEs found in five or more of the non-CCSSM states. As seen in the table, all of the Ratio & Proportion CCSSM LEs were found in a majority of the non-CCSSM states at the same grade level, and at Grade 6, five of the eight non-CCSSM states (SC, MN, OK, AK, and TX) included every CCSSM Ratio & Proportion LE in their Grade 6 standards. Additionally, at Grade 7, five non-CCSSM states (SC, MN, OK, AK, and IN) also included every CCSSM Ratio & Proportion LE in their Grade 7 standards.
The Statistics & Probability strand saw the weakest alignment between CCSSM and non-CCSSM states. Further analysis shows that, while topics such as finding mean and median (6.SP.5), developing uniform probability models to determine probabilities of an event (7.SP.7), and understanding and using lines of best fit (8.SP.2) found high levels of alignment across non-CCSSM states, topics such as interpreting measures of variation as a single value (6.SP.3), measuring the difference between centers (7.SP.3), and working with bivariate data (8.SP.4) were found in only 1–2 non-CCSSM states.
In general, the agreement between CCSSM and non-CCSSM states was greater in the strands concerning Number & Operations (Ratio & Proportion and Number Systems) and Algebra (Expression & Equations and Functions) than for the domains of Geometry and of Statistics & Probability. In previous standards analyses comparing CCSSM with state standards used prior to CCSSM (Tran et al., 2014), researchers found that much of the content in the middle grades CCSSM Geometry and Statistics & Probability strands was considered “new” to Grades 6–8 in many states. This content had previously been taught in later grade levels, including topics that had formerly been outlined in secondary (Grades 9–12) standards. This shift in content for these strands might be an explanation for why the level of agreement across states is not as strong as for those strands that have traditionally been a large part of the middle grades mathematics curriculum, namely topics pertaining to Number & Operations and Algebra.
Number of CCSSM LEs for Grades 6-8 in the Same Grade Level Per State by Content Strand
| Ratio & Proportion | Number System | Expressions & Equations | Geometry | Statistics & Probability | Functions | Total number of LEs | |
|---|---|---|---|---|---|---|---|
| AK | |||||||
| Grade 6 | 7/7 | 17/17 | 14/14 | 6/7 | 12/12 | — | 56/57 |
| Grade 7 | 6/6 | 10/10 | 8/8 | 8/8 | 17/17 | — | 49/49 |
| Grade 8 | – | 2/3 | 18/18 | 14/14 | 7/7 | 10/10 | 51/52 |
| SC | |||||||
| Grade 6 | 7/7 | 16/17 | 14/14 | 7/7 | 12/12 | — | 56/57 |
| Grade 7 | 6/6 | 8/10 | 7/8 | 8/8 | 16/17 | — | 45/49 |
| Grade 8 | — | 3/3 | 18/18 | 14/14 | 7/7 | 10/10 | 52/52 |
| IN | |||||||
| Grade 6 | 5/7 | 15/17 | 13/14 | 7/7 | 10/12 | — | 50/57 |
| Grade 7 | 6/6 | 6/10 | 5/8 | 7/8 | 12/17 | — | 36/49 |
| Grade 8 | — | 3/3 | 9/18 | 10/14 | 4/7 | 10/10 | 36/52 |
| TX | |||||||
| Grade 6 | 7/7 | 9/17 | 11/14 | 2/7 | 8/12 | — | 37/57 |
| Grade 7 | 4/6 | 3/10 | 4/8 | 6/8 | 13/17 | — | 30/49 |
| Grade 8 | — | 2/3 | 10/18 | 11/14 | 4/7 | 5/10 | 32/52 |
| OK | |||||||
| Grade 6 | 7/7 | 14/17 | 10/14 | 2/7 | 6/12 | — | 39/57 |
| Grade 7 | 6/6 | 9/10 | 7/8 | 3/8 | 3/17 | — | 28/49 |
| Grade 8 | — | 2/3 | 9/18 | 4/14 | 4/7 | 7/10 | 26/52 |
| NE | |||||||
| Grade 6 | 5/7 | 13/17 | 9/14 | 6/7 | 5/12 | — | 38/57 |
| Grade 7 | 2/6 | 3/10 | 6/8 | 6/8 | 10/17 | — | 27/49 |
| Grade 8 | — | 2/3 | 8/18 | 12/14 | 3/7 | 1/10 | 26/50 |
| MN | |||||||
| Grade 6 | 7/7 | 7/17 | 8/14 | 4/7 | 0/12 | — | 26/57 |
| Grade 7 | 6/6 | 7/10 | 5/8 | 3/8 | 6/17 | — | 27/49 |
| Grade 8 | — | 2/3 | 13/18 | 3/14 | 4/7 | 6/10 | 28/52 |
| VA | |||||||
| Grade 6 | 2/7 | 9/17 | 5/14 | 0/7 | 1/12 | — | 17/57 |
| Grade 7 | 1/6 | 1/10 | 3/8 | 1/8 | 4/17 | — | 10/49 |
| Grade 8 | — | 1/3 | 3/18 | 5/14 | 2/7 | 5/10 | 16/52 |
What Areas of Disagreement Exist Between CCSSM and Non-CCSSM States?
In addition to analyzing the similarities in the content of CCSSM in relation to non-CCSSM states, we also documented differences in these standards, including the content found in non-CCSSM states that was not included in CCSSM as well as the CCSSM LEs that did not appear in the non-CCSSM standards. Some of these differences could be attributed to the variations in grain size between the non-CCSSM standards and the CCSSM LEs as well as to the organizational structure of CCSSM versus those of non-CCSSM states. For example, several states offered a number of standards focusing on students solving real world problems, or to use estimation to assess the reasonableness of answers. These standards were not explicitly found in CCSSM, yet these ideas are incorporated throughout CCSSM in both the up-front materials as well as the Standards for Mathematical Practice.
Number of CCSSM Topics per Grade Level Found at the Same Grade Level in Five or More Non-CCSSM States
| CCSSM Strands | 6th Grade | 7th Grade | 8th Grade | Total |
|---|---|---|---|---|
| Ratio & Proportion | 7/7 (100%) | 6/6 (100%) | — | 13/13 (100%) |
| Number Systems | 13/17 (76%) | 5/10 (50%) | 2/3 (67%) | 20/30 (67%) |
| Expressions & Equations | 12/14 (86%) | 6/8 (75%) | 11/18 (61%) | 29/40 (73%) |
| Functions | — | — | 8/10 (80%) | 8/10 (80%) |
| Geometry | 5/7 (71%) | 6/8 (75%) | 7/14 (50%) | 18/29 (62%) |
| Statistics & Probability | 6/12 (50%) | 11/17 (65%) | 4/7 (57%) | 21/36 (58%) |
| Total | 43/57 (75%) | 34/49 (69%) | 32/52 (62%) | 109/158 (69%) |
In total, all of the 158 CCSSM LEs were found in at least one non-CCSSM state’s standards at any grade level. One CCSSM LE— Measure the difference between centers by expressing it as a multiple of a measure of variability (7.SP.3)—was found only in AK’s Grade 7 standards, and no other non-CCSSM state’s standards included this at any grade level. Four CCSSM LEs were found in only two non-CCSSM state standards at any grade level:
identify parts of an expression using mathematical terms (6.EE.2);
interpret measure of variation as a single value for a numerical data set that describes how its values vary (6.SP.3);
interpret products of rational numbers by describing real-world contexts (7.NS.2); and
interpret quotients of rational numbers by describing real-world contexts (7.NS.2).
Both Grade 6 standards were found in AK and SC in Grade 6, and the two Grade 7 standards were located in AK and OK in Grade 7, yet were not found at any grade level in the other six non-CCSSM standards. Finally, the following eight CCSSM LEs were located in three non-CCSSM state’s standards at any grade level, with the states listed for each LE:
recognize that inequalities have infinitely many solutions (6.EE.8) (AK, IN, SC);
recognize the characteristics of a statistical question (6.SP.1) (AK, IN, SC);
describe the nature of the attribute under investigation (6.SP.5) (AK, IN, SC);
understand the meaning of an expression in terms of the problem context (7.EE.2) (AK, SC, OK);
convert a decimal expansion which repeats into a rational number (8.NS.1) (AK, IN, SC);
use similar triangles to explain why the slope m is the same between any two distinct points on a nonvertical line (8.EE.6) (AK, SC, TX);
compare properties of two functions each represented in a different way (algebraically, graphically, numerically in tables, or by verbal descriptions) (8.F.2) (AK, IN, SC); and
construct and interpret a two-way table summarizing categorical data (8.SP.4) (AK, IN, SC).
These eight CCSSM LEs were not present at any grade level in the other non-CCSSM state’s standards.
Conversely, we also documented the content found in non-CCSSM states that was not included in CCSSM. A total of 145 standards across the eight non-CCSSM states were not matched with any of the CCSSM LEs. These included three states (OK, TX, VA) that specified standards for students to understand π, three states (NE, TX, VA) that provided standards for students to construct or solve problems using circle graphs as well as standards for students to understand the nested relationships that occur for various sets of numbers (e.g., integers, rational numbers, reals), and three states (AK, IN, OK) that offer standards concerning the prime factorization of numbers. In addition, TX provides 21 standards devoted to personal financial literacy across Grades 6–8. These topics pertain to credit and debit cards, checking accounts, personal credit, methods of paying for college, salaries of occupations, sales tax, personal and family budgets, financial assets and liabilities, simple and compound interest, and monetary incentives—all topics not found in CCSSM. Table 7 below provides the percentage of standards found in each grade level in the non-CCSSM state’s standards that were not found in the CCSSM middle grades LEs.
Discussion and Implications
The results of this study highlight the greater alignment across mathematics standards for middle grades across the United States than prior to the adoption of CCSSM. These data document the areas where considerable agreement exists with regards to the content of middle grades mathematics, as well as topics where agreement does not occur and further discussion should ensue regarding their place in the curriculum. The stronger alignment overall holds considerable implications for education stakeholders working in middle grades.
Proportion of Non-CCSSM Middle Grades Standards in Each State not Found in CCSSM Middle Grades LEs
| State | Grade 6 | Grade 7 | Grade 8 | Total |
|---|---|---|---|---|
| AK | 2/32 | 0/24 | 1/29 | 3/85 |
| (6%) | (0%) | (3%) | (4%) | |
| SC | 0/30 | 2/27 | 1/30 | 3/87 |
| (0%) | (7%) | (3%) | (3%) | |
| IN | 5/36 | 4/34 | 1/29 | 10/99 |
| (14%) | (12%) | (3%) | (10%) | |
| TX | 17/52 | 13/43 | 15/45 | 45/140 |
| (33%) | (30%) | (33%) | (32%) | |
| OK | 8/40 | 7/34 | 10/30 | 25/104 |
| (20%) | (21%) | (33%) | (24%) | |
| NE | 4/42 | 5/36 | 3/29 | 12/107 |
| (10%) | (14%) | (10%) | (11%) | |
| MN | 3/33 | 4/34 | 11/35 | 18/102 |
| (9%) | (12%) | (31%) | (18%) | |
| VA | 8/31 | 8/26 | 13/33 | 29/90 |
| (26%) | (31%) | (39%) | (32%) |
Standards analyses conducted prior to the 2010 release of CCSSM illustrated considerable variance across states with respect to the mathematical content outlined as well as the grade placement of specific mathematical topics (Dingman, 2007; Reys, 2006; Smith, 2011). As evidenced in our data, a small yet nontrivial consensus existed regarding the grade placement of mathematical topics in the middle grades, with specific content strands more aligned across CCSSM and non-CCSSM states than others. As seen in our data, topics in the strands of Number & Operations and Algebra generally saw greater consensus across CCSSM and non-CCSSM state standards with respect to the grade placement of specific content, while the strands of Geometry as well as Statistics & Probability witnessed less agreement between CCSSM and non-CCSSM state standards. This progress toward common learning expectations across all states holds important implications regarding the creation of textbook materials and assessments as well as the critical need to ensure equitable opportunities for students to learn important mathematics regardless of their geographic location. In addition, given the potential mobility of students throughout their academic careers, similarity in mathematics standards can help to reduce curricular differences and assist students transitioning to new schools in different states.
The process by which standards are developed and written varies across states (Reys et al., 2005), but typically includes school- and district-level experts in mathematics as part of committees tasked with revising standards. Therefore, it is vital that the process of future standards revisions in any state builds upon this consensus in future standards documents. Standards evolve over time: a comparison of National Council of Teachers of Mathematics (NCTM, 1989) Curriculum and Evaluation Standards for School Mathematics and CCSSM would illustrate areas of agreement between the two documents as well as aspects where the authors of CCSSM built upon 2 decades of standards writing and research in mathematics education to produce standards that went beyond National Council of Teachers of Mathematics’s previous vision. Therefore, it is important to consider what future iterations of mathematics standards should include and the vision for mathematics education they should depict. These future revisions should consider where agreement exists across states regarding what mathematical content students should learn and at what grade level certain topics should be taught and use this consensus as a foundation for future standards writing. Consideration should also be paid to the mathematical content that provides rich connections to these foundational topics in an effort to create standards that are coherent in nature and that support more robust student learning rather than standards that appear to be disjointed, unconnected lists of topics with little coherence within or across grade levels. These connections should be informed by the growing research body pertaining to mathematical learning trajectories (Clements & Sarama, 2004; Confrey et al., 2014; Empson, 2011).
Since the 2010 release of CCSSM, a number of states have revised their standards that were aligned to CCSSM. Many of these revisions have not resulted in the deletion of CCSSM content but rather have provided additional clarity to the existing standards or have added mathematical content at specific grade levels. These alterations were allowed within the original CCSSM agreement, and thus these states are still considered to be using CCSSM. At this time, it is not clear when or how CCSSM may be revised and amended, or how that process might evolve. Therefore, states that are considering revising their existing standards that are aligned to CCSSM must consider the implications of adding or deleting standards. With the considerable effort that has been conducted in aligning curricular materials (e.g., textbook series, online supplemental materials) to CCSSM, moving away from CCSSM may challenge mathematics teachers that use materials aligned to CCSSM to adjust their instructional planning or to supplement existing materials. In addition, the use of multistate assessments may need to be reevaluated to determine if the revised standards still align with the assessment frameworks previously used.
The reality is that total agreement with respect to mathematics standards across all states may never exist. However, determining a common set of learning expectations for a grade level across all states from which to build would help to establish equitable curriculum goals for student learning across the country (Reys, 2006; Schmidt, 2004; Schmidt et al., 1997). This was the basis behind the NCTM’s Curriculum Focal Points publication (NCTM, 2006) and in the development and release of CCSSM. From the data presented here, it is apparent that such a foundation exists at the middle grade level regardless of a state’s adoption of CCSSM, more so now than prior to the release of CCSSM (Reys, 2006). Future standards revisions should continue this progress toward increased levels of agreement regarding what mathematics should be the focus of instruction at a given grade level and ultimately toward greater equity for students’ opportunity to learn important mathematics.
