


Stereotype threat research has demonstrated how presenting situational cues in a testing environment, such as raising the salience of negative stereotypes, can adversely affect test performance (Perry, Steele, & Hilliard, 2003; Steele & Aronson, 1995) and expectancy (Cadinu, Maass, Frigerio, Impagliazzo, & Latinotti, 2003; Stangor, Carr, & Kiang, 1998) for members of groups that have negative stereotypes associated with them. Although there have been over a decade of empirical research studies replicating stereotype threat effects in college settings, relatively little research has been published documenting stereotype threat with K-12 students (Jordan & Lovett, 2007). Anxiety is presumed to be a factor in observed stereotype threat impairment, particularly when students are assessed on content that is at the frontier of their knowledge base (Steele, 1997). However, in the K-12 setting, where identification with academics is presumably more varied, the research is mixed at best. This study examined the effects of stereotype threat and prior performance on familiar academic tasks in a predominantly Latino and African American middle school setting. Prior standardized test performance was found to be significantly correlated with expectancy and performance. An interaction effect was observed between stereotype threat status and prior performance level on expectancy. Stereotype threat status did not significantly affect expectancy for the highest and lowest performing groups as their expectancy levels were not significantly different irrespective of threat status. However, there was a significant adverse effect on expectancy for the moderately performing group, which may best represent those students being assessed at the frontier of their knowledge base. These findings are discussed as they relate to the factors in predominantly minority K-12 settings that may help to identify potential stereotype-related threats to test performance.
BACKGROUND
Stereotype Threat
Various research studies have examined the influence of stereotypes as a potential contributor to the underperformance of socially stigmatized groups on academic tests (Cadinu, et al., 2003; Inzlicht & Ben-Zeev, 2000; Nguyen & Ryan, 2008; Perry et al., 2003; Spencer, Steele, & Quinn, 1999; Steele & Aronson, 1995). Groups for which well-known negative stereotypes, or social stigmas, exist have been found to underperform when those group affiliations are made salient in test environments, producing a phenomenon referred to as “stereotype threat” (Steele, 1997). Such socially stigmatized groups include African Americans and Latinos with respect to academic achievement due to well-documented patterns of performance relative to the general population (Aronson, 2002; Schmader & Johns, 2003). The vast majority of stereotype threat research has been conducted with college undergraduates, with very little focus on K-12 settings (Nguyen & Ryan, 2008). With large numbers of African American and Latino students underperforming in elementary and secondary schools, such a focus may be an important step in closing well documented achievement gaps in K-12 (African American achievement in America, 2003; Latino achievement in America, 2005).
Although stereotype threat effects have been demonstrated in a wide variety of settings, the different methods used to elicit the effects suggest that the phenomenon is multifaceted, and there may be nuances in the different settings that contribute to the outcomes observed. Researchers in clinical settings have made stereotypes salient using a variety of approaches, including by characterizing a test as a measure of intelligence, having students identify their race prior to an assessment, or advising students prior to a test that their particular social or racial group has shown a historical pattern of poor performance on it (Smith, 2004). However, other research suggests that a strong relationship exists between prior performance and expectancy (Eccles & Wigfield, 2002), as well as between prior performance and achievement (Geiger & Cooper, 1995). Understanding how stereotype threat may affect expectancy and student performance in K-12 settings may be informative to efforts at addressing achievement gaps.
Stereotype Threat and School Aged Children
As research continues to emerge in the stereotype threat literature, there is a paucity of empirical stereotype threat studies involving K-12 level participants. Although some research suggests that stereotype threat related to socio-economic status and gender may affect the academic performance of children in some of the same ways that it affects adults (Désert, Préaux, & Jund, 2009; Huguet & Régner, 2007), the evidence with regard to race-based stereotype threat in K-12 settings is not so clear. McKown and Weinstein (2003) examined stereotype awareness with a racially diverse group of elementary school children and found that they became increasingly aware of stereotypes between the ages of 6 and 10. Those from socially stigmatized groups (African American and Latino) were more likely to be aware of broadly held stereotypes. When asked to perform a novel task that was not indicative of everyday school activities (i.e. writing letters in backward order) students aware of broadly held stereotypes performed poorer under threat. However, when given a task that “more closely resembled a school task” (p. 506) no threat-related effects were observed. These findings support the notion that familiar tasks may be less likely to produce stereotype threat effects, regardless of stereotype salience.
Research with Asian girls comparing a positive Asian stereotype to a negative gender stereotype found mixed results (Ambady, Shih, Kim, & Pittinsky, 2001). Different patterns of performance were observed depending on age groupings (three groupings from K-8), but in all cases, making race salient did not result in lower performance. Although this research demonstrates K-12 stereotype threat effects related to gender and race, the racial component only addressed what is perceived as a positive racial stereotype (e.g. Asians are good at math) and the effect did not occur consistently for all age groups in the study. The younger and older students (lower elementary and middle school, respectively) exhibited patterns commonly observed with adults, whereas the group in-between (upper elementary) exhibited markedly different patterns. These are somewhat paradoxical findings in light of research suggesting that awareness of stereo types increases as students get older (McKown & Weinstein, 2003).
Race-based stereotype threat research in high school is extremely scarce. One study examined race-based stereotype threat amongst a racially diverse group of ninth graders enrolled in a critical thinking course in an urban Florida high school (Kellow & Jones, 2005). Stereotype threat was activated by presenting a visual-spatial reasoning task as either evaluative (i.e. predictive of success on a state test the following year) or nonevaluative (historically not gender or culturally biased). African American participants performed significantly lower than White counterparts in the evaluative condition, but did not score significantly different in the nonevaluative condition (both adjusted for prior differences).
A pair of studies examined the impact of having test takers provide personal information (including race and gender) before taking a test as compared to providing this information after the test is completed. Neither study found significant performance effects related to threat status. The first of these studies involved a diverse sample of over 1,300 recent high school graduates who were part of an incoming pool of community college students taking a computerized test for placement purposes (Stricker & Ward, 1998). The second study involved a diverse sample of over 1,700 AP calculus students from across the country (Stricker, 1998). The participants had been enrolled in AP calculus classes prior to the exam, and were being tested on their mastery of content that they had recently completed studying. These students’ expectancies may have been established by their concrete knowledge of their proficiency levels as reflected by periodic feedback and assessments during the course, thus attenuating any performance related anxiety. In this instance, prior performance on very familiar tasks may have been a better source of expectancy than the attempted threat manipulation.
The question of how applicable stereotype threat is to students in K-12 settings is relevant not only because the research in this area is limited and mixed, but also because there are several environmental differences between typical K-12 settings and college campuses. Identification with the stereotyped domain is considered a tenet of stereotype threat (Steele, 1997). For example, an African American or Latino student could hardly be expected to be affected by a negative stereotype concerning minority mathematics achievement if that student does not care about or identify with math achievement on a personal level. Another contextual difference between K-12 settings and higher education is the self-determination component of the decision to attend. Considering the fact that college attendance is voluntary, where students must apply and be admitted to attend, one could argue that most, if not all, students in this setting would be expected to be identified with academics on some level. Conversely, K-12 attendance is compulsory, and in most K-12 settings there are no academic admission requirements. The fact that motivation and interest in schooling declines over time for many students is a topic all too familiar to educators (Hidi & Harackiewicz, 2000) and likely contributes to a different level of identification with academics in general at the secondary school level. In addition, the somewhat segregated nature of public schools can lessen opportunities for social comparison to students of other races. Recent data reveal that 70% of all African American and Latino students attended predominately minority schools (Rumberger & Palardy, 2005).
It is unclear if the presence of students from nonstigmatized racial groups in the testing or school environment is a necessary condition to induce race-based stereotype threat related performance impairments. In an environment where virtually all students share similar group memberships, negative group stereotypes may seem less threatening. In such an environment, a student’s personal history of performance may be a more credible source of information to inform his or her performance expectancy than any broadly held group stereotypes. Comparison to nonstigmatized others may be infrequent or nonexistent when they are not regularly present in significant numbers. Stereotype effects have been observed in two studies of homogenous Asian and White settings (Ambady et al., 2001; Aronson et al., 1999), but both of these studies examined the effects of making positive Asian stereotypes salient. These findings have not been replicated in settings predominated by students for whom negative race-based academic stereotypes might apply.
Investigated Mechanisms
Stereotype threat has been found to impair the academic performance for a diverse range of student populations, including African Americans and Latinos (Aronson, 2002; Perry, et al., 2003), females (Brown & Josephs, 1999; Spencer et al., 1999), low socioeconomic groups (Croizet & Claire, 1998), and White males (Aronson et al., 1999). Steele and colleagues theorize that the impaired performance is caused by the fear of affirming a negative stereotype, and suggest that anxiety appears to trigger the effect (Aronson, Fried, & Good, 2002; Steele & Aronson, 1995). Academic tests administered under stereotype threat conditions have been shown to result in increases in mean arterial blood pressure (Blascovich, Spencer, Quinn, & Steele, 2001; Osborne, 2001, 2007), demonstrating the link between stereotype threat and anxiety. These results, taken together with previous research that identifies anxiety as a source of increases in blood pressure (Bailey, 1984; E. H. Johnson, 1989; Milliken, 1964; Shapiro, Goldstein, & Jamner, 1996; Tardy, Allen, Thompson, & Leary, 1991), lend support to the notion that anxiety may be the mechanism by which stereotype threat exacts its toll on cognitive performance.
If anxiety is the primary link between threat and performance, it appears to be mediated by the level to which one identifies with the domain in question. In a study examining math stereotype threat with college students, the participants most affected by threat manipulation were those who had strongly agreed that math was important to them and that they were good at math (Aronson et al., 1999). Steele argues that identification with a domain is formed based on a self-evaluation of one’s prospects in that domain, and that perceived structural and cultural threats can influence the formation of this identification (Steele, 1997).
Although the performance impairment resulting from invoking stereotypes in testing environments has been repeatedly replicated, and empirical evidence suggests that anxiety is involved, exactly how this anxiety results in underperformance appears unresolved at present. There is some evidence that the anxiety induced by stereotype threat reduces working memory resources available to devote to academic tasks (Schmader & Johns, 2003). Beilock and colleagues have demonstrated how the influence of anxiety could be alleviated by heavily practicing working-memoryintensive tasks such that long-term memory is accessed directly, and the load on working memory is lessened (Beilock, Rydell, & McConnell, 2007). This appears to be a promising approach to circumventing a memory-related obstacle to knowledge retrieval, but novel problem-solving tasks are inherently heavily dependent on working memory resources (Sweller, van Merrienboer, & Paas, 1998; van Merrienboer & Sweller, 2005). If anxiety still affects performance expectancy, optimum cognitive performance on such tasks remains unlikely unless the cognitive antecedents to the anxiety are addressed. This suggests that expectancy is an important part of the equation, as discussed in the next section.
Stereotype Threat and Expectancy
Performance expectancy has been found to be an important factor influencing academic performance (Wigfield & Eccles, 1992, 2000). Expectancy has been defined as the cognitive anticipation of a particular outcome following the performance of some act, the strength of which can be represented by subjective estimation of that outcome (Atkinson, 1957). Situational cues can contribute to this subjective belief of one’s expected outcomes. Prior performance has also long been theorized to influence individuals’ self-beliefs and perceptions of their environments, which in turn influence future performance (Eccles & Wigfield, 2002; Pajares, 1996; Wigfield & Eccles, 2000). When an individual underperforms in a stereotype threat setting, this outcome is likely the result of a confluence of factors that have developed over time, rather than just being a direct result of the immediate activation of a negative stereotype. Steele contends that identification with an academic domain is dependent in some part on good achievement (Steele, 1997). To fully explicate the causes of underperformance under threat, one can hardly ignore the influence of prior performance, particularly if a solid track record of prior performances on highly similar tasks exists. Ultimately, understanding the relative importance of these two factors (threat status and expectancy) may help to demarcate the conditions under which stereotypes are most likely to have negative impacts on performance. As a test taker considers the available evidence to inform expectancy, both prior performance and situational cues must weigh into the appraisal. The weight afforded to one’s individual record of prior performance could presumably be moderated by the length, consistency, and strength of that record.
Stangor and colleagues (Stangor et al., 1998) examined whether stereotype threat and task confidence (as measured by expectancy) could be jointly responsible for the effects observed in stereotype threat research. They demonstrated that providing positive feedback can increase expectancy, but activating gender stereotype threat could undermine this increased expectancy. Following a word-finding task that was judged on “creativity, originality, length and diversity,” task confidence was manipulated using bogus feedback wherein the participants were informed that their respective performances were either “excellent” or “ambiguous,” depending on the assigned condition. The participants were sub
sequently asked to complete a spatial abilities task which they were told had produced gender differences (or not), and expectancy was measured as to their anticipated success on the task. The tasks were novel, and therefore expectancy was not likely to be informed by prior experience. No actual performance measures were administered to determine whether the lowered expectancy would actually result in poorer performance outcomes. Expectancy was undermined by providing seemingly credible sources of doubt, using unfamiliar tasks and vague evaluation criteria.
In other research (Cadinu et al., 2003), both expectancy and performance were assessed as dependent measures following gender stereotype threat manipulation with college undergraduates. Participants were asked to estimate their expected performance on a difficult math test by drawing on a graph with a backdrop illustrating results from 72 purported prior studies showing gender differences (or not). For women heavily identifying with mathematics, expectancy and performance were both adversely affected by threat status, and expectancy was found to partially mediate the effect of stereotype threat on performance. The confidence presumably inspired by the feedback on this performance was undermined by the false revelation from the researchers that females had performed worse on the task in prior research. The testing environment included both males and females, potentially making gender even more salient.
Not surprisingly, the research on expectancy and stereotype threat has demonstrated that presenting purported research results consistent with stereotypical beliefs can adversely affect subjects’ expectancy for successful performance on a task. Although these results are quite informative in helping to understand the malleability of expectancy, the tasks involved may not have been representative of many actual assessment settings, particularly those where the tasks are not so novel to the test taker. It is not clear from these results whether such an undermining effect would have occurred if there had been a solid history of performance, positive or negative, on tasks similar to the ones being performed. In addition, the presence of students from nonstigmatized groups may mediate the adverse effects of making stereotypes salient.
The Present Study
The purpose of the present research was to examine the influences that race-based stereotype threat and prior performance may have on performance expectancy and achievement related to academic tasks familiar to middle school students. Of particular interest was whether the characteristics of an all-minority middle school setting (i.e. nonintegrated environment, younger students) might produce results different from those previously documented by studies with older and more diverse populations (i.e. college or high school). It is possible that expectancy and performance in this setting, with no non-stigmatized groups to compare to, will be driven by individual achievement history, even in the presence of stereotype threat. By the time students reach middle school, standardized testing has become all too commonplace in their school environment. A well-established track record of achievement on standardized tests may serve as a more credible source of expected competency than even well-known stereotypes or achievement gap information. The present study examines the possible influence of both prior performance and salient stereotypes on test expectancy and performance.
Prior stereotype threat research has demonstrated a negative relationship between the salience of negative racial stereotypes and test performance (Steele & Aronson, 1995), as well as a negative relationship between stereotype threat and task expectancy (Cadinu et al., 2003; Stangor et al., 1998). However, literature concerning middle school students’ expectancy suggests that different results may be observed in younger students. Expectancy, as defined by Eccles and her colleagues, represents children’s beliefs about how well they will perform on a future task. This construct is closely aligned with Bandura’s self-efficacy construct in that it represents students’ own expectations for success, which are shaped, in part, by the experiences and feedback that students encounter as they transition into middle school (Wigfield & Eccles, 2000). Following this reasoning, we expect that when given a task for which there is a well-established track record of prior performance, middle school students’ expectancy and performance will be driven by their individual performance histories. Stereotype threat may be less influential on outcomes, depending on the strength of those prior performances. We hypothesized that students’ actual performance on a clinical simulation of a standardized test would be significantly correlated with expectancy and prior performance, irrespective of situational manipulation of stereotype threat status.
METHOD
Participants
Seventy-two 11-to 13-year olds (40 boys, 32 girls) in the seventh grade class at a public Southern California middle school participated in the study. The school was designated as a Title I school, as over 80% of the student population qualified for the free or reduced lunch program. The school population of approximately 2800 students was comprised of 87% Latino, 13% African American, and less than 1% “other” race students. There were approximately 940 seventh grade students attending the school. In order to draw a representative cross-section of students, participants were recruited from both the honors and general education seventh grade classes. Students were permitted to participate only if they had received a passing grade (self-reported) in all of their classes on their preceding report card. Although grades were self-reported, requests for participation were submitted to homeroom teachers to confirm that they at least met the criterion. The passing grade requirement was intended to limit inclusion of participants to those who were presumably identified on some level with education, although it is conceivable that some of these students achieved passing grades due to external pressures rather than internal identification. Steele contends that stereotype threat affects the vanguard of stereotyped groups because of their identification with the domain and their worry about being stereotyped in it (Steele, 1997). Per IRB approval, verbal and written assent were obtained from each participant, as well as verbal and written parental consent. Each participant was paid $10 for participating in the study.
Prior standardized test data on the California Achievement Test (CAT/6) were available for 69 of the 72 participants. For the year of this study, the school was ranked in the lowest decile on the state’s Academic Performance Index (API) when compared to schools statewide, and ranked in the second lowest decile when compared to schools with similar characteristics. The California API measures performance and growth in schools, with standardized test scores playing the most significant role in the calculation (“Understanding the Academic Performance Index,” n.d.). Although the school had a low ranking, the study participants represented a wide range of prior performance as indicated by their prior test scores. Forty-one percent of the participants scored at or above the 50th percentile on a composite measure of prior state standardized test scores, and 20% scored at or above the 70th percentile. Beginning level ESL students and special education students were excluded from this study to prevent language or disability factors from skewing performance results.
The participants were randomly assigned to two groups: stereotype threat (n = 37) and a non-stereotype threat control group (n = 35). The stereotype threat group (18 boys, 19 girls) consisted of 33 Hispanic/Latino students, three African Americans, and one “other” (mixed race—Latino and White). The control group (22 boys, 13 girls) consisted of 31 Hispanic/Latinos and four African Americans. Each student was assigned to an after-school session on one of four consecutive school days. The sessions involving the control group participants occurred on the first 2 days of the study, whereas the stereotype threat group participants each attended one of the sessions on the final 2 days. The control group sessions were conducted first in order to prevent the possibility of stereotype threat group participants discussing race elements of the study with control group participants before the control group sessions occurred. The sessions were conducted with groups of between 12 and 26 students each, due to the limited number of computers in the computer lab where the study was conducted. No expectancy or performance differences were observed in our analyses based on session group size or gender, therefore all statistical analyses are reported based on two groupings (stereotype threat group and control group).
Procedure
Each participant completed two computerbased tasks related to this study. The independent variable (stereotype threat status) was manipulated using a method similar to the one employed in Spencer’s stereotype threat research on females in mathematics (Spencer et al., 1999) wherein the threat group was advised that the task they were about to attempt had produced historical differences between men and women. In that study, the “no-threat condition” participants were given no information (or given positive information) about historical comparisons between men and women.
For the present study, the stereotype-threat group sessions each began with a 5-10 minute presentation of Internet-available achievement gap data which were projected on a large screen in front of the room. The presentation included graphs illustrating the achievement gap for Latino and African American middle school students as compared to White and Asian students (African American achievement in America, 2003; Education watch achievement gap summary tables, 2004; Latino achievement in America, 2005). The presentation included national and state level comparisons, as well as performance comparisons for students in the participants’ own local school district. The final slide and comment in the presentation consisted of the following statement: “This study is designed to determine where students in this school rank in comparison to the California and United States statistical data.” This statement was specifically intended to raise the possibility of confirming the negative stereotype of underperformance. This was intended to test whether raising the specter of confirming a negative stereotype would affect performance in this setting. The researcher concluded the presentation with the comment “we would like to be able to sit down with each of you at a later date to discuss which areas you did well in, and in which areas you might need improvement.” This statement was intended to convey to the students that the test was diagnostic in nature, which could presumably lead to them being viewed stereotypically based on their performance.
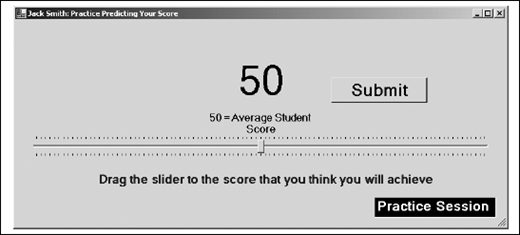
Immediately following the presentation, each of the threat-group participants responded to a popup dialogue box on the computer screen which asked them to provide their race. The control groups were advised initially that the purpose of the study was to conduct research on memory, and their sessions began with a computer screen dialogue box asking them to simply provide their grade level. Participants from both groups then completed a computer-based expectancy measure which required each participant to estimate his or her expected performance on the simulated standardized test they were about to take (see Figure 1). They were advised that the test would be similar to the standardized tests that they normally take at the end of each school year. After completing the expectancy measure, all participants then took a simulated standardized test comprised of items drawn from test preparation materials in several subject areas. Following the study, students were debriefed on the actual intent of the study and given an opportunity to discuss further if desired. In addition, detailed correspondence was provided to each participant’s parent(s) or guardian outlining the study’s intent and inviting them to contact the researchers if further clarification or discussion was desired. The threat groups were also advised that no follow up meetings to discuss their individual performances would actually occur.
Apparatus
In order to facilitate data collection for each participant, a researcher-designed computer software program was utilized for this study. Questions were presented in a multiple-choice format providing a digital version similar to the pencil and paper standardized tests students are familiar with. The study was conducted in a PC-based computer lab at the middle school where the participants were enrolled. There were 30 available PCs connected to a database on the main server. In order to eliminate keyboarding skill level as a possible confounding variable, each of the tasks was designed to be completely mouseclick driven. Each task was preceded by a practice task with an identical procedure to ensure that each participant was familiar with the procedure prior to engaging in the actual task (see Figure 2 for sample screenshot of a practice question). Data collection was immediate and transparent to the user, as all data were recorded to the server-based database file upon completion of each task. The software was pilot-tested for ease of use and comprehensibility with volunteer middle school students.
Measures
Expectancy. Participants from both conditions completed the expectancy measure wherein they were asked to estimate their expected performance on the upcoming simulated standardized test. They used the computer mouse to drag a slider control (scaled from zero to 100) to the overall score they expected to attain. Beforehand, they were advised that “an average student in the United States would be expected to score a 50.” This was intended to elicit a self-comparison to others following the threat manipulation.
Prior Standardized Test Scores. California Standardized Assessment Test (CAT/6) results from the end of the previous school year were obtained from the participants’ school records. Scores were obtained for the mathematics section, as well as the language arts, reading, and spelling subscales on the standardized test. The CAT/6, also referred to as Terra Nova, Second Edition, is widely used nationally and is published by CTB/McGraw-Hill. Its development was the result of an extensive process to ensure reliability and validity (Terra Nova, The Second Edition, Technical Quality, 2001) and has received high marks in independent evaluations (Cizek, 2005; R. L. Johnson & Mazzie, 2005).
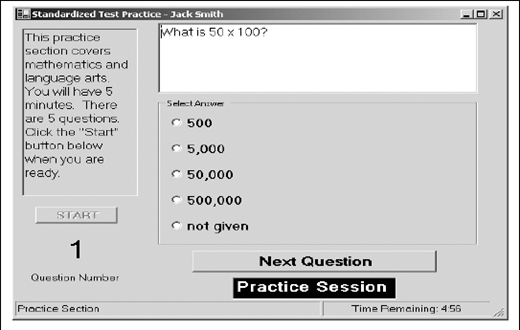
Simulated Standardized Test. The simulated standardized test (SST) was comprised of questions drawn from standardized test preparation booklets for mathematics, reading and vocabulary, language arts and spelling (Curriculum Associates, 2004). The multiple-choice questions were displayed on the computer screen and the participants selected answers from the options presented. The first section was a timed, 15-minute, 20-item math test. This was followed by a 20-minute, 35-item language arts, vocabulary and spelling section, and finally a 15-minute, 12-item reading comprehension section. Correlational analyses were conducted to establish concurrent validity of this measure.
RESULTS
Descriptive Statistics
Table 1 shows the descriptive statistics for the participants’ prior CAT/6 composite scores and the composite scores from the simulated standardized test administered in this study. The CAT/6 Composite Index (Cronbach’s alpha = .91) is a composite of the prior year’s CAT/6 math, language arts and reading scores. The Standardized Composite index (Cronbach’s alpha = .74) is a composite score of the math, language arts, and reading scores from the tasks in this study. We also conducted a Kolmogorov-Smirnov test to check the assumption of normality for both indices, and the results verified that this assumption was satisfied. Both indices demonstrated adequate to good internal consistency.
Correlational Analyses
Table 2 presents the Pearson correlation coefficients for prior performance on standardized tests (CAT/6), expectancy scores, and simulated standardized test scores (SST). As expected, there were significant positive correlations between prior CAT/6 and expectancy for both the stereotype threat condition (r =. 40, p < .05) and the control group (r = .46, p < .01). About 11% of the variance in expectancy was shared between both groups on SST performance: stereotype threat condition (r = .33, p < .05); control group (r = .33, p = .05). CAT/ 6 performance was positively and significantly correlated with student scores on the SST for both the stereotype threat (r = .77, p < .001) and the control (r = .87, p < .001) conditions. Higher prior standardized test scores were associated with higher expectancy and higher test performance, regardless of threat status.
The correlations between the subscales of the CAT/6 the SST are presented in Table 3. Correlations were positive and significant, particularly between the matched content subscales for the four content areas measured. Prior performance on standardized tests was significantly associated, by subject area, with performance on the SST regardless of threat condition. The high correlations between the SST and the CAT/6 composite establish concurrent validity for the simulated standardized test, by subscale, administered in this study (McIntire & Miller, 2000). However, composite performance scores inclusive of all of these subscales were used in subsequent analyses since stereotype threat effects have been observed across subject domains.
Descriptive Statistics for CAT/6 and Standardized Test Composites
| Cell N | Mean | SD | Skew (SE) | Kurt (SE) | |
|---|---|---|---|---|---|
| CAT/6 composite | 69 | 125.43 | 77.34 | -.040 (.414) | -1.428 (.809) |
| Standardized composite | 72 | 35.81 | 9.18 | -.368 (.398) | -.340 (.778) |
Correlations Between Variables of Interest as a Function of Threat Status
| Measure | 1 | 2 | 3 | ||
|---|---|---|---|---|---|
| 1. | CAT\6 composite | — | .40*, N = 37 | .77***, N = 37 | |
| 2. | Expectancy | .46**, N = 32 | — | .33*, N = 37 | |
| 3. | SST composite | .87***, N = 32 | .33, N = 35 | — |
Note: *p < .05. **p < .01. ***p < .001. Intercorrelations for threat condition participants (n = 37) are presented above the diagonal, and intercorrelations for nonthreat condition participants (n = 35) are presented below the diagonal.
Correlations Between Variables of Interest as a Function of Threat Status
| Measure | 1 | 2 | 3 | 4 | 5 | 6 | 7 | 8 |
|---|---|---|---|---|---|---|---|---|
| CAT\6 Subscales | ||||||||
| 1. Math | - | .75*** | .74*** | .48** | .77*** | .55*** | .55*** | .31 |
| N = 37 | N = 37 | N = 37 | N = 37 | N = 37 | N = 37 | N = 37 | ||
| 2. Language arts | .70*** | - | .86*** | .47** | .55*** | .60*** | .74*** | .31 |
| N = 32 | N = 37 | N = 37 | N = 37 | N = 37 | N = 37 | N = 37 | ||
| 3. Reading | .67*** | .88*** | - | .55*** | .58*** | .55*** | .78*** | .32 |
| N = 32 | N = 32 | N = 37 | N = 37 | N = 37 | N = 37 | N = 37 | ||
| 4. Spelling | .48*** | .66*** | .60*** | - | .36* | .46** | .38* | .45** |
| N = 32 | N = 32 | N = 32 | N = 37 | N = 37 | N = 37 | N = 37 | ||
| SST Subscales | ||||||||
| 5. Math | .64*** | .42* | .49** | .33 | - | .49*** | .53** | .26 |
| N = 32 | N = 32 | N = 32 | N = 32 | N = 37 | N = 37 | N = 37 | ||
| 6. Language arts | .74*** | .82*** | .80*** | .63*** | .58*** | - | .63*** | .73*** |
| N = 32 | N = 32 | N = 32 | N = 32 | N = 35 | N = 37 | N = 37 | ||
| 7. Reading | .56** | .75*** | .70*** | .57** | .59*** | .70*** | - | .34* |
| N = 32 | N = 32 | N = 32 | N = 32 | N = 35 | N = 35 | N = 37 | ||
| 8. Spelling | .60*** | .71*** | .69*** | .67*** | .40* | .87*** | .62*** | - |
| N = 32 | N = 32 | N = 32 | N = 32 | N = 35 | N = 35 | N = 35 |
Note: *p < .05. **p < .01. ***p < .001. Intercorrelations for threat condition (n = 37) are presented above diagonal, and nonthreat condition (n = 35) are presented below diagonal.
Prior CAT/6 Scores on Simulated Standardized Test Scores by Condition
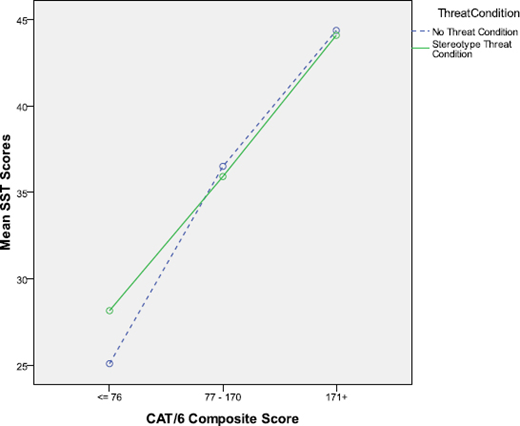
A two-way between-groups analysis of variance (ANOVA) was conducted to explore the impact of prior CAT/6 scores and threat status on the SST. Participants were binned into three equal percentile groups according to their prior Cat/6 composite scores (Low: 76 and below; Medium: 77-170; High: 171 and above) (see Table 4). There was no significant interaction effect between prior CAT/ 6 scores and threat status, F(2, 63) = .69, p = .51. There was a statistically significant main effect for prior CAT/6 score, F(2, 63) = 52.41, p < .001. The effect size was large (partial η2 = .63). Post hoc comparisons using the Tukey HSD test revealed significant differences between all groups (p < .001 for all tests). Figure 3 illustrates the SST scores by CAT/6 groupings and the main effect for prior scores.
Prior CAT/6 Scores on Expectancy by Condition
A two-way between-groups analysis of variance (ANOVA) was conducted to explore the impact of prior CAT/6 scores and threat status on expectancy (see Table 5). Levene’s test of homogeneity of variance was significant (p < .05), therefore a stringent significance level (.01) was used for evaluating the results of the two-way ANOVA. There was a significant interaction effect for prior CAT/6 and threat status on expectancy, F (2, 63) = 6.19, p = .004. In Cohen’s terms (Cohen, 1988), the effect size was large (partial η2 = .16). Figure 4 illustrates the disproportionate effect that stereotype threat status had on the medium group.
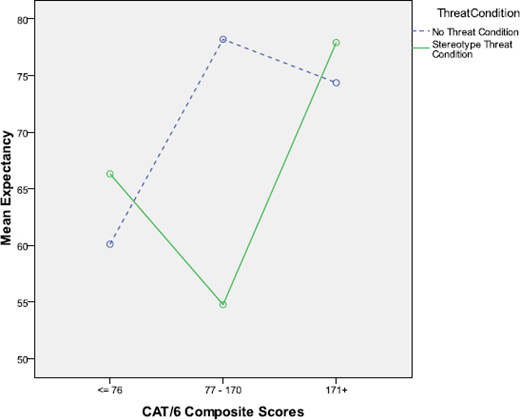
The participants in the medium group (based on prior CAT/6 scores) had the lowest expectancy among the three groups when in a stereotype threat condition, but had the highest expectancy among the three groups when in a nonthreat condition. Follow-up independent t tests were conducted, by prior performance levels (low, medium, and high) to compare the expectancy by performance across threat conditions. There was a significant effect for threat status in the medium group, t(20) = 3.36, p = .005, with threat condition participants scoring lower on expectancy than non-threat participants. There were no significant differences in expectancy by threat condition for the low group t(22) = -.84, p = .41, or the high group t(21) = -.87, p = .39. All means and standard deviations can be observed on Table 5.
Follow-up analyses were conducted to examine this interaction effect by using a split file option to generate separate one-way ANOVA results by threat condition. Since ANOVA results did not indicate homogeneity, Welch and Brown-Forsythe analyses were performed to compare the different CAT/6 score groupings. For the control participants, Welch and Brown-Forsythe analyses were inconclusive, Welch (F(2, 29) = 3.47, p = .053); Brown-Forsythe (F(2, 29) = 4.80, p = .022). Games-Howell post hoc tests did not reach statistical significance in the comparison of expectancy for the Low group and the Medium group (p = .051). There was not a significant difference between the Medium group and the High group (p = .59), or between the Low group and the High group (p = .15), for the control participants.
Means and Standard Deviations for Simulated Standardized Test Composite Scores by Threat Status
| Threat Status | Simulated Standardized Test Scores | Total N | |||||||||
|---|---|---|---|---|---|---|---|---|---|---|---|
| >= 76 | 77-170 | 171+ | |||||||||
| n | M | SD | n | M | SD | n | M | SD | |||
| No threat | 11 | 25.09 | 7.12 10 | 36.50 | 5.93 | 11 | 44.36 | 6.17 | 32 | ||
| Stereotype threat | 13 | 28.15 | 5.46 12 | 35.92 | 4.93 | 12 | 44.08 | 5.70 | 37 | ||
Means and Standard Deviations for Expectancy by Threat Status
| Threat Status | Expectancy | Total N | |||||||||
|---|---|---|---|---|---|---|---|---|---|---|---|
| >= 76 | 77-170 | 171+ | |||||||||
| n | M | SD | n | M | SD | n | M | SD | |||
| No threat | 11 | 60.09 | 21.41 | 10 | 78.20 | 7.33 | 11 | 74.36 | 10.18 | 32 | |
| Stereotype threat | 13 | 66.31 | 14.61 | 12 | 54.75 | 22.80 | 12 | 77.92 | 9.34 | 37 | |
For the stereotype threat group participants, a significant difference was found in the expectancy scores, Welch (F(2, 34) = 6.61, p = .006); Brown-Forsythe (F(2, 34) = 5.87, p = 2
.009). The effect size was large (partial η2 = .26) (Cohen, 1988). Games-Howell post hoc tests revealed a significant difference between the Medium group and the High group (p = .01). There was not a significant difference between Low group and the Medium group (p = .32) or between the Low group and the High group (p = .07).
DISCUSSION
The effect of prior standardized test scores on participant performance on a simulated stan
dardized test in this study followed a predictable pattern. There was a significant main effect of CAT\6 composite scores on the simulated standardized tests regardless of threat condition. The lack of an interaction effect with stereotype threat condition would support the notion that prior performance may have a stronger impact on actual test performance than stereotype threat, at least with regard to the level of challenge associated with the participants and assessments in this study. In contrast, the interaction effect observed for prior CAT/6 and threat status on expectancy suggests that students’ beliefs about their anticipated performance is susceptible to stereotype threat effects. Expectancy for students in the middle group (based on prior performance) was lowest among the three performance groups when under stereotype threat condition, and highest when in a non-threat condition. This pattern of findings is consistent with the theoretical underpinnings of stereotype threat which presume that the threat is greatest when students are challenged at the frontier of their knowledge base (Steele, 1997). The high group would presumably be operating comfortably within their knowledge base if prior performance is any indication. The low group, based on prior performance, may have found the tasks above their knowledge base, and would likely be the least identified with the academic domain among the groups.
Taken together, the ANOVA analyses suggest that stereotype threat’s effect on expectancy for middle school students may not impact all students equally. Prior performance is an important factor when considering how student expectancy might be influenced by the salience of negative group-related stereotypes in testing environments. Furthermore, even when expectancy is affected by threat status, actual academic performance may not be significantly impacted.
Making negative race-based stereotypes salient in a test setting can influence students’ expectancy levels (Stangor et al., 1998), which can in turn lead to subpar performance (Candinu et al., 2003). The vast majority of the evidence for this effect is found in research conducted with college students. In this study of seventh-grade students, expectancy was influenced by stereotype threat manipulation, however its influence was observed only in the medium performing group with respect to the prior standardized test performance. Expectancy for students who had performed moderately on prior standardized tests was significantly lower after viewing a presentation of achievement gap statistics regarding Latino and African American student performance (threat condition). Expectancy was significantly higher for this moderate group than for the low group, and was even higher than the expectancy for the high group under the same threat status condition (although this difference did not reach statistical significance). One would expect that the medium group differs from the high group with respect to the level of challenge they perceive on standardized tests, and differs from the low group in their level of identification with the academic domain in general. The moderate achievers in the middle school setting may experience the optimum level of challenge and academic domain identification to elicit stereotype threat vulnerability.
Expectancy was similar between low and high groups for both the control and threat conditions, suggesting the absence of stereotype threat effects for these groups. The low performing students were presumably those who identified least with academics, and thus were the least susceptible to anxiety over poor performance. The fact that they were performing well enough to pass classes in a low performing school may simply be the result of external pressures rather than academic domain identification. Students who are weakly identified with academic domains have been found to perform no differently under stereotype threat conditions than under no-threat conditions (Perry et al., 2003), presumably because they do not care enough about the domain to feel anxiety about possibly fulfilling a negative stereotype. Alternatively, the lowest performing group may have relied on a consistent pattern of poor performance to inform their expectancy for the test administered in the study.
The absence of a threat-status effect on the expectancy for students who had performed highest on prior standardized tests may represent an important distinction between middle school students and college student populations. Prior research found that college students who were most highly identified with a tested domain were more susceptible to stereotype threat effects than those who were only moderately identified (Aronson et al., 1999). One would expect that the students who performed highest on prior standardized tests would be those most identified with academics, and therefore most susceptible to threat status. However, these students were not affected by threat status in our study. It is possible that the highest performing students in an all-minority low performing school view themselves in an iconoclastic fashion, antithetical to well-known stereotypes. Their consistent performance above the mean would offer credence to such a conviction. This would be consistent with the results of prior research by Stricker that found no performance effects when making race and gender salient for students taking an AP calculus exam following enrollment in an AP calculus course (Stricker, 1998). Minority students in this test environment would likely be the highest achievers amongst their peers, and like the highest achievers in our study, less vulnerable to threat. Alternatively, it is possible that the familiar nature of the tests made performance less vulnerable to threat status because the tasks were perceived as well-learned. Prior research has found that heavily practiced tasks are less susceptible to stereotype threat manipulation (Beilock et al., 2007).
In research with adults, expectancy has been found to be a partial mediator of academic test performance under stereotype threat conditions (Cadinu et al., 2003). We investigated the influence of threat status on academic performance on a simulated standardized test. For our participants, prior CAT/6 standardized test scores were significantly correlated with test performance, irrespective threat status. Despite the significant influence threat status had on expectancy for the medium achieving group, all groups performed on our simulated standardized test consistent with prior school-administered standardized tests, regardless of threat condition. The observed effect that threat status had on expectancy indicates that stereotype threat was present in this K-12 environment, at least for the moderately achieving students in our study. However, at least in this study, the impact that stereotype threat had on expectancy did not translate to impaired test performance, irrespective of prior achievement levels. The highly significant correlations between the subscales of our simulated standardized test and the prior CAT/6 standardized scores for our participants indicate that the test was similar in difficulty to the annual standardized tests used to measure student achievement.
Previous stereotype threat research has demonstrated academic test performance impairment by activating negative stereotypes
in various ways. Subtle forms of threat activation have included presenting the academic task as diagnostic (or not) of intelligence (Croizet & Claire, 1998; Steele & Aronson, 1995), having members of a non-stigmatized group present in the environment (Inzlicht & BenZeev, 2000), or by simply having participants identify their race prior to engaging in an academic task (Steele & Aronson, 1995). Other studies have employed more overt means such as explicitly advising test-takers of historical race or gender related differences prior to the task (Aronson et al., 1999; Spencer et al., 1999). Our intent was to provide an explicit reference to actual group underperformance to ensure that both race and performance stereotypes were salient in the testing environment. Although making stereotypes salient impacted the expectancy for students identified as moderate achievers on prior tests, the impact of the change in expectancy did not appear to alter actual test performance from levels consistent with prior performance.
The dearth of research documenting negative race-related stereotype threat performance effects with K-12 students raises questions as to how it might affect this population of students in certain settings, particularly in all minority settings. The single middle school study documenting stereotype threat related to a negative racial stereotype found a detrimental effect when using a novel task which was uncharacteristic of school assessments, but did not find any effect when using a task similar to normal school activities (McKown & Weinstein, 2003). The only high school study finding negative race-based stereotype threat effects was one conducted with ninth graders that utilized a visual spatial reasoning task not characteristically found on standardized assessments. We submit that the tasks on standardized tests that are typically the measures of academic achievement in K-12 settings, at least in theory, represent familiar tasks to students. To the extent that these assessments are novel, one may expect stereotype threat to affect both expectancy and actual test performance. This highlights the importance of aligning normal school activities with the kinds of tasks found on the standardized assessments to prevent such effects from occurring.
Limitations
A number of contextual issues suggest that the responses to stereotype threat by the participants in this clinical trial setting should be interpreted with some caution. Although threat effects were observed with respect to student expectancy, our small sample size may have prevented detection of any differences in actual SST performance. It is possible that existing stereotype threat effects on actual test performance were simply not detected due to lack of statistical power. Additional research to confirm the performance factors that contribute to stereotype threat vulnerability in middle school minority students would be informative.
The results of the current study also support the notion that while stereotype threat can impact the expectancy of K-12 students in an all-minority setting, these effects may not result in impaired performance on standardized tests. However, the absence of non-stig-matized groups in the test setting may have lessened the level of threat that might be perceived in a more diverse milieu. It is possible that actual test performance would have been influenced by the lowered expectancy exhibited in the stereotype threat condition if this study were conducted in a more diverse and integrated school setting. This research was conducted at a large, low performing, urban middle school with virtually 100% Latino and African American student population. The results may not generalize to middle schools with more diverse enrollment, higher performing schools, or private school settings. We only examined negative, race-related, academic stereotype threat, and therefore the results may not generalize to threat related to gender, socioeconomic status, or positive racial stereotypes.
Conclusion
The results of this study extend the stereotype threat literature in that they provide some evidence in helping to demarcate the empirical boundaries of stereotype threat as called for in the literature (Jordan & Lovett, 2007). Empirical studies in K-12 settings may be fine-tuned by including level of prior performance as a possible contributing factor to stereotype threat related changes in student expectancy. The stereotype threat literature is abundant with research regarding students attending higher education institutions. The myriad of settings and conditions that replicate stereotype threat effects can remind us of how complex such a theory can be in all of its characteristics. K-12 settings in general, and middle school settings in particular, are relatively absent in the vast majority of research conducted on this topic. Contextual differences suggest that blanket transfer of stereotype threat tenets and findings to primary and secondary settings would likely be inappropriate. This research seeks to help illuminate some of the nuanced differences that these environments may possess with respect to how stereotypes might threaten academic performance and under what circumstances. As this area of literature continues to unfold, it is our hope that such undertakings will result in better targeted approaches toward eliminating potential obstacles that may prevent K-12 students from accurately demonstrating their true academic potential.

