

The purpose of this study was to explore through student drawings and corresponding narratives, middle grades students’ perceptions of their learning environment, which we defined to include pedagogy, interactions (teacher-student and student-student), and climate, and how these may differ based on service delivery model (i.e., gifted, special education, or general education settings). Although the use of drawing has been suggested as a compelling method to both inform and facilitate educational change (Haney, Russell, & Bebell, 2004), the extant literature rarely includes student-centered representations of classroom climate or perspectives, particularly as differentiated across common service delivery models. A total of 132 middle grades students participated in this investigation, representing each of the 3 sectors. Findings suggest that middle grade students perceive differential classroom experiences in terms of instructional methods, interactions, and behavior management based upon service delivery. Implications for P–12 practice, and future research are discussed.
School reform efforts in the past decade have focused mainly on legislative mandates and initiatives concerned with assessing teacher, leader, and student effectiveness, teacher and leader preparation programs, and yearly progress benchmarks. The quality of data on teaching and learning that frame these initiatives has increasingly been brought into question, sparking new conversations about the kinds of research educators and scholars need to pursue to inform improvement efforts in P–12 classrooms (Cochran-Smith & Zeichner, 2005). Research suggests that learning environments that exemplify effective instruction (pedagogy), supportive teacher-student and peer relationships, and positive classroom climate leads to increased student engagement and motivation (Allen & Bowles, 2012; Anderman, Andrzejewski, & Allen, 2011; Beghetto, 2007; Wang, & Holcombe 2010; Wentzel, 2010). Currently, most of the research related to learning environments depicts adults’ (e.g., teachers and administrators) voices (Storz, 2008), which leaves out key stakeholders in the educational process—the students themselves. Students’ accounts of their learning environments most often depict factors within teachers’ areas of influence (Ares & Gorrell, 2002), an area that seems ripe for investigating what is actually happening in P–12 classrooms. We believe the inclusion of youth voices can be a powerful contributor to reform efforts (Haney et al., 2004; Patrick, Ryan, & Kaplan, 2007) by providing insight into instructional approaches that either enhance or hinder learning (Ares & Gorrell, 2002; Freiberg & Stein, 1999; Nieto, 1994). While research exploring youths’ perspectives of their learning environment often includes students from diverse backgrounds, the dearth of literature that examines perceptions of students based on service delivery model (gifted, general, and special education) creates an opportunity to address this gap. We believe that exploring middle grades students’ perceptions of their learning environment, which we have defined to include pedagogy, interactions (teacher-student and student-student), and climate, and how such perceptions may differ based on service delivery model (i.e., gifted, special education, or general education settings), increases educators’ chances of producing a positive impact on the academic experience of all students.
Review of Relevant Literature
Students’ Perceptions of Learning Environments
The literature depicts contrasting views of the learning environment, which we define to include instruction (pedagogy), interactions (teacher-student; peer), and classroom climate. Teachers most often portray their classrooms as egalitarian settings in which students are held to high expectations in environments that are student centered and in which active learning is occurring (Ben-Peretz, Mendelson, & Kron, 2003). Students’ perceptions, on the other hand, describe learning environments consistent with Freire’s (1978) concept of “banking education” (p. 73) in which information is deposited into passive learners and which consist of highly routinized learning activities (Ares & Gorrell, 2002). Similar to Ben-Peretz et al. (2003), Cushman and Rodgers (2008) report that perceptions of the learning environment by middle grades students more closely depict researchers’ observations of classroom settings than teachers’ perceptions of the same settings. This finding supports obtaining middle grades learners’ feedback on the learning environment.
In their study of middle school students in Canada, Lapointe, Legault, and Batiste (2005), found that students’ attitudes toward learning and performance in mathematics classrooms was influenced by their perceptions of their teachers. General education and gifted education students in the same investigation experienced greater achievement and motivation in classes where educators were perceived as helpful, caring, thoughtful, and friendly. Conversely, when teachers were perceived as oppositional, middle grades students reported a lower sense of self-efficacy and intrinsic value. Within this same study, middle grades students with learning disabilities were not affected either positively or negatively based on teacher opposition or support. These findings are consistent with other studies (Adams, Lenz, Laraux, Graner, & Pouliut, 2002; Bear, Kortering, & Braziel, 2006).
In another study utilizing middle grades students’ drawings to elicit general and special educators’ perceptions of coteaching, Bessette (2008) found that compared to elementary students, middle graders were five times more likely to draw themselves experiencing academic difficulty in their classes. In addition, the findings suggested that middle school students’ drawings demonstrated a 75% decrease in depictions of both motivated students and positive teacher dispositions in the classroom, as compared to their elementary counterparts.
Differences in students’ perceptions of the learning environment have been found in studies that focus on gifted learners, gender, and “at-risk” factors (Brock, Nishida, Chiong, Grimm, & Rimm-Kaufman, 2008). For example, gifted students’ perceptions of classrooms within magnet programs vary from those of their counterparts in general education settings in P–12 environments. Gifted students in magnet programs report feeling more challenged in their course work than gifted students served in general education settings (Gentry, Rizza, & Owen, 2002). In terms of gender, at the elementary level female students in general education classrooms as compared to male students perceived their learning environments as more supportive (Salmon, 1999). Finally, students identified as “at-risk” of identification for placement in special education perceived more frequent negative teacher interactions and lower teacher expectations as compared to students without disabilities (Montague & Rinaldi, 2001).
Positive Learning Environments
Another aspect on the literature focuses on positive learning environments, which can greatly influence students’ perceptions about the learning process (Patrick et al., 2007; Wang & Holcombe, 2010). Although numerous forces affect perception of the learning environment, the teacher can leverage these perceptions via purposeful decisions pertaining to the following dimensions: classroom layout; use of learner-centered, active, instructional approaches; and inclusion of developmentally appropriate social and cognitive experiences (Ferreira & Bosworth, 2007; L. M. Johnson, 2006; Johnson, Johnson, & Stanne, 2000; Lumpkin, 2007; Newman & Newman, 2001; Taylor-Dunlop & Norton, 1997; Wentzel, 2003; 2010). Classrooms that include these and other dimensions such as positive teacher-student relationships (Wentzel, 2010) have been linked to increased student academic effort, achievement, and self-efficacy (Brock et al., 2008; Patrick et al.).
The American Psychological Association (1997) has identified essential components of successful classrooms in their learner-centered model. The learner-centered model contains 14 key features, including reciprocal respect among teachers and students; valuation of individual developmental needs; promotion of active learning and higher level thinking experiences; facilitation of instruction rather than didactic dissemination of information; recognition of social/relational influences on learning; choice afforded to students in learning direction; and variety in assessments. A metaanalysis conducted by Cornelius-White (2007) examining learner-centered research indicates high correlations between person-centered teaching (i.e., instruction that acknowledges the role of the learner as an active participant in the process) and students’ creative and critical thinking; student’s participation; motivation to learn; social skills; relationships with peers; and overall positive school outcomes. Findings across studies suggest that positive teacher-student relationships coupled with high expectations are more likely to result in higher academic achievement. Positive teacher-student relationships are rooted in care, as defined by the student, thus supporting the need for obtaining student input when examining the learning environment.
Drawing as a Research Tool
Drawing has been suggested as a viable and innovative tool to both inform and facilitate educational change (Bessette, 2008; Haney et al., 2004) and provides voice to all learners. Prosser and Burke (2008) note that the use of drawing with an accompanying narrative acknowledges the child’s experience as vitally important. They go on to state, “to be a child and disabled is to be doubly disadvantaged in terms of voice” (p. 414), and describe several visual methods, including drawing, that can assist with helping us to “understand their experiences in the world” (p. 414). Though learner involvement has been solicited for many years in psychology and sociology (Cherney, Seiwert, Dickey, & Flichtbeil, 2006; Haney et al., 2004; Yuen, 2004), education has only recently recognized that “authorizing student perspectives is essential because of the various ways that is can improve current educational practice” (Cook-Sather, 2002, p. 3). A majority of research related to student drawings and education focuses on student responses to high-stakes testing (Wheelock, Bebell, & Haney, 2000a, 2000b), perceptions on learning styles (Armstrong, 1995, 2004), and differences in student and teacher perceptions of the role of the teacher (Ben-Peretz et al., 2003; Bessette, 2008); school reform (Wheelock et al., 2000a, 2000b); children’s classroom and school experiences (Gamradt & Staples, 1994; Weber & Mitchell, 1995); and students’ perception of coteaching roles within inclusive settings (Bessette, 2008).
Success in school is based on a variety of factors including students’ individual characteristics, past experiences, and perceptions of the classroom as an environment conducive to learning (Juvonen, 2007; Patrick et al., 2007). Student drawings can assist researchers in understanding perceptions of classroom experiences. Such depictions reflect a range of individual experiences and serve as a tool for promoting reflection about instructional practices (Haney, Russell, Gulek, & Fierros, 1998). Students are critical stakeholders in their own educational experiences, and the sharing of these experiences through students’ original drawings provides teachers and other school personnel with valuable insight regarding student needs and perceptions. Acknowledging student voice where all students, regardless of ability level, are able to participate, is the first step in creating a classroom community where students feel cared for and supported, both of which are essential to fostering positive learner outcomes (Lumpkin, 2007).
Methods
Context and Participants
The study was conducted in a middle school environment within a suburban setting in the southeastern United States. This school was identified as a professional development school, meaning that it had strong collaborative and reciprocal relationships with university faculty focused on teacher preparation and research. In addition to general education classes, the school provided classes for gifted students and a continuum of services for students with disabilities. Project researchers met with the school principal to describe the study and gain approval prior to submission of the institutional review board application. After the meeting, the principal presented the project to her faculty, and seven teachers volunteered their middle grades classrooms as settings for the study. The seven settings encompassed all three service delivery models (i.e., gifted classroom, general education classroom, and special education classroom). The participants were middle grades students who were drawn from these seven classrooms—76 males and 56 females, all of whom provided parental consent and student assent.
Of the 132 participants, 49 (37%) were identified as gifted (i.e., scored 130+ on an individually administered IQ test) and were served in gifted education classes, 71 (54%) were served in general education classes, and 12 (9%) were students with disabilities who were served in self-contained settings (classrooms containing only students with disabilities) for a portion (approximately 40%) of their day. The students receiving special education services were identified as having mild/moderate disabilities (e.g., learning disabilities, emotional behavioral disorders) and had been receiving special education services since elementary school.
Procedures
Data collection occurred during one 55-minute session for each of the seven classrooms. Each session began with a brief icebreaker activity in order to build rapport. After the activity, which took approximately 15 minutes, researchers distributed an 8-1/2 by 11 inch paper that provided the prompts for the study (Table 1).
Prompts were also provided verbally to the students. No model drawings were presented to the groups. Students were allotted approximately 25 minutes to complete their drawings using a lead pencil; the final 15 minutes of class was dedicated to debriefing the activity and collecting the materials. Approximately half (58%) of the students receiving special education services asked for and received assistance in writing their narrative responses by dictating their comments to researchers who transcribed what was communicated verbatim.
Analysis
This study utilized four prompts to gain insight into middle school students’ perceptions of their classroom environments. Each prompt was analyzed using either quantitative or qualitative methods (Table 1). Results are presented by prompt with a description of the analysis followed by findings. Quantitative analysis focused Prompts 1 and 2, and included both descriptive statistics as well as statistical analysis (chi-square) when appropriate, which allowed us to compare drawings across service groups. Qualitative analysis was conducted on Prompts 3 and 4 in which students expressed thoughts, ideas, and motivations behind their illustrations and explained what their classes were typically like.
Prompts and Type of Analysis
| Prompt | Analysis | |
|---|---|---|
| 1. | Think about all of the different things your teachers do with you in the classroom. Draw a picture of what a camera would see when one of your teachers is working in the classroom. | Quantitative |
| 2. | Did you draw:
| Quantitative |
| 3. | Tell me about your picture. | Qualitative |
| 4. | What are your classes generally like? | Qualitative |
Quantitative Analysis
Using similar analysis strategy as that described by Haney et al. (2004), a random sample of the drawings (12 from each service group) was reviewed by two of the investigators. Codes were developed through an iterative process. The coding sheet included such items as teacher, student(s), technology, captions, facial features, et cetera. in which each item was defined and a rating attached based on the extent to which the item was evident. For example, if a chalkboard was evident, it would be rated zero if it contained no detail, one if it contained minimal detail (e.g., squiggles for writing), two if it contained moderate detail (e.g., assignments), or three if it contained extensive detail (e.g., assignments, homework, graphic organizer). Two graduate students coded the same sample and their results were compared with the initial coding completed by the investigators. Discrepancies were discussed and ambiguities in the operational definitions were clarified. Each graduate student coded the remaining drawings independently and the results were compared to determine interrater reliability (93%). Due to the categorical nature of the data, chi-square tests were conducted to test for significant differences among the service groups (Glass & Hopkins, 1996).
Limitations
For this study, the sample was drawn from one school in one geographic area. Although delineated by service sector, the sample is not representative of the student population within the school. We acknowledge that generalizability is limited.
Results
Prompt 1: Drawings
Variables were analyzed according to the classroom environment (e.g., presence of a chalkboard or classroom equipment, such as overheads and use of technology), student characteristics (e.g., student talk, activity, presence in the classroom, and affect), teacher characteristics (e.g., gender, talk, presence in the classroom, and affect), and students’ preference towards the teachers and classrooms drawn (e.g., did the student draw a favorite teacher or class?). Frequency counts and percentages for the total sample population and each service group are provided for variables that exhibited statistically significant differences among the service groups.
Classroom Environment. Statistically significant results were found among the service groups based on the classroom setting [χ2 (4, n = 132) = 13.27, p = .01]. Specifically, students in special education (n = 7, 58%) drew student desks in traditional rows more often than students in gifted or general education settings (n = 20, 40% and n = 15, 21% respectively). Statistically significant differences were also found in classroom technology use [χ2 (6, n = 132) = 23.31, p < .01]. Most students did not draw any computers in their pictures (gifted n = 38, 78%; general n = 60, 85%; special n = 8, 67%); however, if technology was present in the drawing it was typically for the teacher’s use (gifted n = 10, 20%; general n = 9, 13%; special n = 1, 8%) rather than the student’s (gifted n = 1, 2%; general n = 2, 3%; special n = 1, 8%). Only two students, both of whom received special education services, drew classroom computers for both student and teacher use.
Student Characteristics. This category was comprised of varied student activity such as student talk, learning, presence and affect. The only item that was significant in this category was the type of activity in which students were engaged [χ2 (6, n = 104) = 16.25, p = .01]. Students in special education (n = 7, 59%) depicted nonacademic activities more often as compared to students in gifted (n = 10, 20%) or general education (n = 8, 11%). Although not statistically significant, approximately one quarter of participants in gifted and general education did not draw any peers in their drawings while all the students in special education did.
Teacher Characteristics. There was a significant difference among the service groups related to the gender of the teacher drawn, [χ2 (4, n = 117) = 26.04,p < .01], with more students in special education drawing male teachers (n = 5, 42%) versus students in gifted (n = 15, 31%) or general education (n = 8, 11%). Although not statistically significant, a higher percentage of students in special education (n = 3, 25%) did not include a teacher in their drawing compared to students in gifted education (n = 2, 4%) or general education (n = 10, 14%).
All teacher talk depicted in the drawings was coded both for existence and content. There was a statistical difference among service groups, [χ2 (4, n = 42) = 9.47, p = .05] when the researchers examined whether the talk was academic (gifted n = 11, 23%; general n = 8, 11%, special n = 0, 0%); behavioral (gifted n = 2, 4%, general n = 10, 14%, special n = 2, 17%); or social (gifted n = 5, 10%, general n = 4, 6%, special n = 0, 0%). Interestingly, while only two students in special education included teacher talk in their drawings, in both cases the talk addressed behavior issues (e.g., “give me the IPod now,” “be quiet or I’ll rite you up [sic]”).
Prompt 2: Four Questions
After drawing the illustration of a classroom, students were asked to respond to four questions: did you draw a classroom you like; did you draw a classroom you dislike; did you draw your favorite teacher; and did you draw your favorite class? Analysis of these four questions indicate there was a statistical difference among the service groups as related to whether they drew their favorite class, [χ2 (4, n = 132) = 10.60, p = .03] with 50% (n = 6) of the students in special education drawing their favorite class compared to 35% (n = 17) of the students in gifted education and 47% (n = 33) of the students in general education. Likewise, there was a statistical difference, [χ2 (4, n = 132) = 10.16, p = .04] in whether participants drew a teacher they liked (gifted n = 36, 74%; general n = 45, 63%; special n = 6, 50%). Approximately 25% (n = 12) of the gifted students and 23% (n = 16) of the general education students answered that they did not like the teacher they drew, while 50% (n = 6) of the students in special education said they did not like the teacher they drew.
Qualitative Analysis
Investigators transcribed responses to prompts three and four in order to facilitate coding; transcriptions totaled 34 doublespaced pages. Then, investigators used an iterative process similar to that employed with the coding of the quantitative analysis. Researchers began with a holistic reading of the transcripts to gain a sense of the student responses. Next, investigators independently coded a subset of the transcripts consisting of comments from 12 drawings from each service sector (n =36) (Corbin & Strauss, 1998).
Investigators convened to review and refine code definitions based on the total sample. One of the research assistants with prior experience in qualitative analysis independently coded the remaining transcripts (n = 96). Three members of the research team met again to review coding and obtain consensus on any discrepancies. Codes were then grouped into three categories as patterns (Yin, 2013) and connections became apparent: (1) classroom environment; (2) student behavior; and (3) teacher behavior. Classroom environment relates to the physical layout of the classroom and the type of instructional activity described. Student behavior pertains to any comments about how the student and/or his or her peers are acting in the classroom with regard to both academic and nonacademic activities. Descriptions by middle grades students of teacher actions (e.g., supportive, engaging, punitive, or mean) are subsumed under teacher behavior.
Findings
Findings from the analysis of the narratives are provided by category and service group followed by the results from the responses regarding what middle grades students’ classrooms are typically like.
Prompt 3: Student Comments
Classroom Environment. Researchers coded comments describing physical layout of the classroom, students’ perceptions of the learning environment, and the type of instruction that takes place (i.e., group work, lecture, and note taking) as classroom environment.
Classroom descriptions by students in gifted education focused on learning environments that were organized and consisted of routines and structures to facilitate student learning. One student noted, “The picture is [of] my favorite class. The class is very organized, everything has its own spot and all of it is labeled.” Another detailed his drawing, labeling each item based on its function or use (e.g., hand-in boxes, math supplies, assignment board); all pertaining to the learning that is taking place in the classroom.
Desks were predominately drawn in clusters of four and staggered throughout the classroom. The majority of gifted students represented instruction as learner-centered and varied, addressing multiple modalities and learning styles. One gifted student reported “This teacher always explains how to do projects on the board while talking about it, helping both visual and auditory learners.” Active learning within the gifted sector was evident in the majority of the descriptions, such as science experiments and academic games. For example, one student exclaimed, “This class is VERY1 hands on. I enjoy it. I also like this class because we learn a lot but we always have a blast doing it! We also do a lot of experiments.” Another noted, “For this project we had to do a model of a part in Asia like the Himalaya Mts. We barely got to sit down.”
Students in general education also provided detailed and at times detached descriptions of their learning environment. Most focused on the physical aspects of the room rather than the learning that took place. For example, one student simply drew and labeled where the fire extinguisher, light switch, pencil sharpener, exit sign, and fire alarm were located. Another student provided a similar description specifying every physical aspect of the room including “a line that holds the two halves of the portable together.” And another described his teacher’s desk as “simple, clean, and plain.”
Students in general education, like those in gifted education, also described routines, but they were more prescribed, regimented and simplistic: “All we do is read our books do our do-nows and do classwork and watch movies about history and we talk because at the end of class for about 10 minutes she lets us talk and pack our stuff up.” Another student wrote, “Mrs. Jones2 is teaching class and [has] set eight worksheets for the class to do today.”
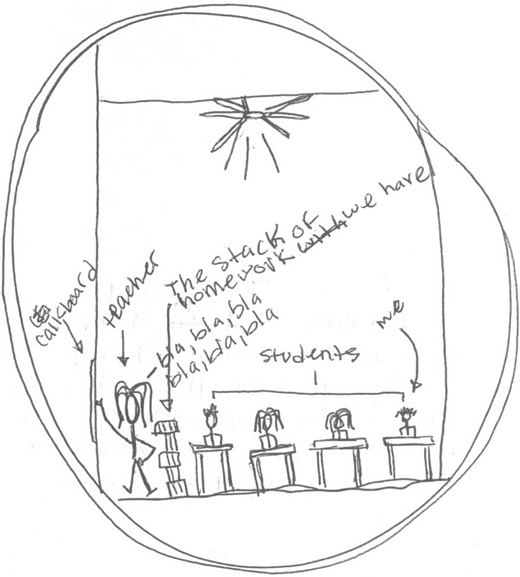
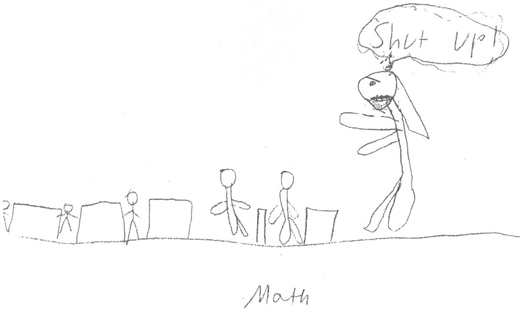
Most of the students in general education settings perceived instructional experiences devoid of physical activity and intellectual stimulation. Only two students in this group explained how activities were learner-centered or targeted different learning modalities. The majority detailed repetitive, passive learning: “The picture is about school and how boring it feels to sit in class for 55 min[utes] and the teacher is talking or reading a book and then [you] switch to the next class and do the same thing” (Figure 1).
None of the drawing descriptions from the special education classes contained hands-on learning or teacher’s use of visual aids for learning. In fact, they presented instruction as activities or work they had to complete (e.g., “writing down vocabulary words”) based on teacher direction with little if any opportunity for student input or choice. One student indicated that in his classroom “most of the time there is nothing to do, just look at the teacher talk.” At the same time a majority of instructional comments were coupled with statements about off-task student behavior, such as, “the teacher is teaching the class and the kids are goofing off behind her [back], but then they start to pay attention because she got mad.”
Only two students in special education described classrooms with positive environments. One explained her drawing: “the class is being good, sitting still and doing their work with nobody talking and the teacher is having no problems.” Another described his class, where “we are all working on something before we go to group and start reading.”
Student Behaviors. Researchers coded students’ comments describing how the student and/or his or her peers are acting in the classroom with regard to both academic and nonacademic activities as student behaviors. Student behaviors in both gifted education and general education were similar in that most students described their peers as on-task; however, students in gifted education were engaged in active learning while students in general education were more often engaged in passive learning activities. Students in special education more frequently described peers as off-task.
As noted in the previous section, learners in the gifted classroom depicted environments with engaged, active student learning. Additionally, the majority of learners in gifted education illustrated positive learning experiences (e.g., “All the kids are in their desks smiling because we all love his class”) and on-task behaviors (e.g., “The class is paying attention to what he has to say;” “The entire class is orderly and quite the opposite of chaotic”). Few portrayed peers as oppositional or defiant. Comments that described off-task behavior pertained to students “dreaming about their typical thoughts” (Figure 2), or singled out one or two students as culprits: “the two people in the back talking are the people that talk a lot.” Even when students disliked the class, student behavior was described as benign: “It shows everyone just sitting there doing nothing. While the teacher sits there and also does nothing [sic].”
 The comic style classroom sketch contains a rectangular border enclosing a chaotle At the center, a large character with spiky hair and an open mouth stands on a desk 2 speech bubbles are marked quiet and shut up. Surrounding this character, student desks arranged in rows, each with a computer screen displaying a smaller stick char students are various speech and thought bubbles marked go jags, this is gonna b looks bad, I love, wicked, hi, Zzzz, huh, and another hi, in the top right come, a large Mr.Dragonetti.The comic style classroom sketch contains a rectangular border enclosing a chaotle At the center, a large character with spiky hair and an open mouth stands on a desk 2 speech bubbles are marked quiet and shut up. Surrounding this character, student desks arranged in rows, each with a computer screen displaying a smaller stick char students are various speech and thought bubbles marked go jags, this is gonna b looks bad, I love, wicked, hi, Zzzz, huh, and another hi, in the top right come, a large Mr.Dragonetti.
Students in general education noted how most classmates adhered to rules. One student explained that “Almost everyone [takes notes] when they are supposed to.” Another student described his math class as a place where “My math teacher [asks] us to tell her the answer to a problem on the board for warm-up and everybody [raises] their hand to answer it.” The compliance of students in general education was evident when a student characterized the classroom as a place where “We sit at tables and just listen to the teacher.” In keeping with this compliant behavior, another student explained his picture as “a student giving a presentation and the others paying attention.”
Students in both general and gifted education described negative behaviors as passive resistance suggesting students and teachers were disengaged in the learning enterprise. For example, one student in general education wrote:
Mr. Harris is on the computer e-mailing teachers or he is researching. He always has papers that we are supposed to be getting [to work on] on his desk. The class always doodles or eats candy. He really is oblivious of anything in the class. Everyone thinks it is soo [sic] boring. They don’t do their work. Pretty much everyone has missing work except for six people and I am one of them.
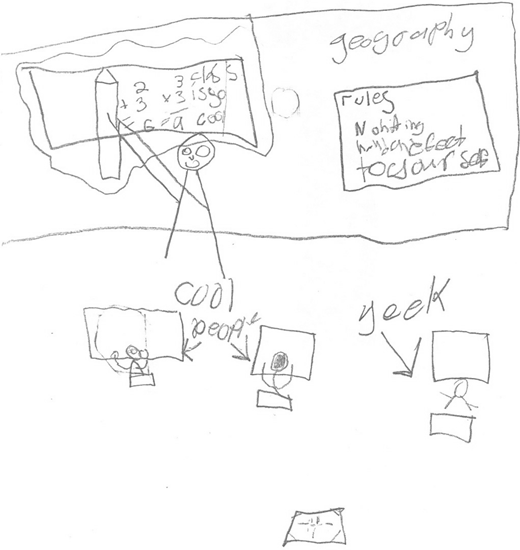
Students in special education also linked their teachers’ instructional acumen (or lack thereof) to their drawings. In one picture and description, many students were “sleeping because that class is boring” (Figure 3). Stu-dents also connected off-task student behaviors to authoritarian teaching, “people are talking and a teacher is telling us to be quiet.” In one drawing, students who are off-task are labeled as “cool people,” while the one student who seems to be paying attention is labeled a “seek.” This particular student (a seventh grader) indicated that he had drawn a class from when he was in fourth grade. When one of the researchers reminded him that the class was to be from the current school year he responded, “It doesn’t matter, [the classroom experience] hasn’t changed since fourth grade”.
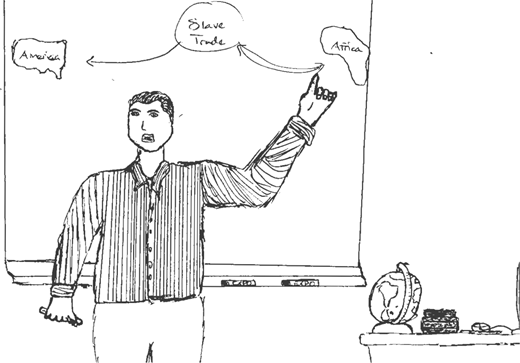
Teacher Behaviors. Researchers coded students’ comments pertaining to teacher actions as teacher behaviors. Students in gifted education expressed that teachers who engaged in talk and activities that were nonacademic in nature seemed to have a better rapport with students. One student stated, “This is my favorite teacher. He is very charismatic and he puts all his energy into teaching us. He is a great teacher and he always captivates our attention.” Another student described a teacher as “the funniest and most fun-to-be-with teacher I have ever met…. He may seem like a mean teacher at first, but I can assure you that he will make everyone laugh” (Figure 4).
Although most of the teacher behaviors described by participants in gifted education were positive, several student pictures suggested teachers exhibited negativity. For example, one student stated that he “drew this teacher yelling at two students he hates” while another drew the teacher at the front of the room saying “quiet” and “shut up” (see Figure 2) to specific students whose names the illustrator blacked out. Another student expressed a similar sentiment, explaining that his picture described as, “The WORST CLASS I’VEEVER BEEN IN.” He lamented that the class was “way too easy,” covering topics that he had learned two years ago.
General education students provided few specifics detailing teacher behaviors. Teachers were typically at the board or telling students to work. One student described the teacher in her drawings as someone who “gives us projects to do and we can choose our partners.” One student portrayed his teacher’s classroom management ability by stating, “Mr. Johnson was getting into an argument with a student about an electronic device. The girl lost the argument.”
Several students in general education also described negative teacher behaviors. One student explained, “Mrs. Butler [is] mean and always picks on me even if I’m doing what she says. She always tells us to be quiet. She is never calm. She is always tense and that is every day.” Another student described his teacher as someone who “does not stop talking. She wants us to give her respect when she doesn’t give it back.” One student writes that his drawing shows
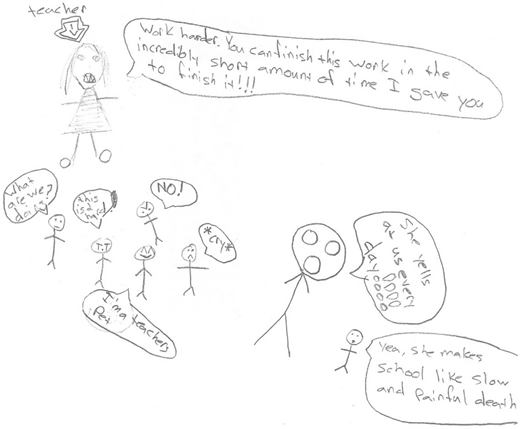
how my teacher gives us too little time to get stuff finished and how she yells at us every day about stupid little things and she makes some girls cry and she has little teacher’s pets that she likes more than everyone else. She makes everyone feel stupid, even me and I get straight A’s and one B (the B is in language arts from last quarter) (Figure 5).
One illustration depicts the teacher as twice the size of the students with the words “SHUT UP” in a dialogue bubble above her head (Figure 6). This was the only classroom in which the teacher remained in the class while the students completed the prompts. Before the researchers were able to divert her, she stopped by this student’s desk and exclaimed, “I do not say that!” to which he replied, “No, but you think it”.
For learners in special education, teacher behaviors were directive and focused on monitoring student behavior. One student explained, “[The] teacher is trying to settle the room down by yelling and telling them to sit down and do work.” Another simply stated “people are talking and a teacher is telling us to be quiet.” A chaotic climate was reflected in one student’s portrayal of his class in which one student is engaged in an academic activity (doing a math problem on the board) while the rest of the students are engaged in nonacademic activities (i.e., making noise, listening to IPod, playing a hand game). One student, who indicated in his commentary that he and his friend were “having fun, not listening [to the teacher],” was asked by one of the researchers to expound on his drawing. He went on to explain, “[The] teacher is trying to teach us…. Sometimes we learn some things. It’s up to the teacher.”
Prompt 4: Description of Typical Class
In order to ensure that the drawings were not illustrative of an isolated event and to assist with triangulation and trustworthiness, we asked students to describe what their classes were generally like. In other words, we sought to determine whether the drawings represented an everyday experience in participants’ classroom or an anomaly. The majority of students in gifted education described their classrooms as student-centered, active, and challenging. Instructional approaches included “lots of fun activities such as debates, games, and life lessons.” Students considered teachers strict and demanding, but nice, commenting “My classes are always very interesting. I always learn something and the teachers don’t just sit and talk, they make it so I actually want to pay attention.” When students did describe some of their classrooms as boring it usually was as a result of a lack of challenge in their course work or of active engagement by the student (e.g., “a lot [classes] are super easy even though they are gifted classes.” “Some are boring but when teachers get creative the classes get fun”).
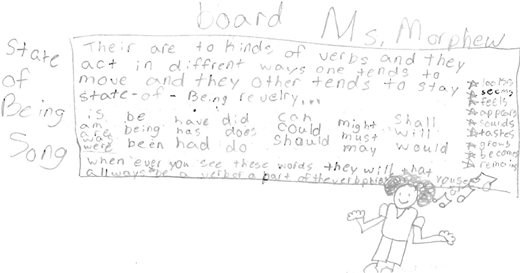
Similar to students in gifted education settings, a number of students in general education described their classrooms as active, engaging learning environments. When they did, they expressed similar sentiments as those of the gifted students, such as “I like those classes because I like the teachers and we like to do projects and physical activities” and “she teaches us all types of songs about grammer [sic]” (Figure 7). Many described highly routinized environments where passive learning is the norm (e.g., “We usually just sit in a desk and listen to the teachers”). Course work was viewed as something that had to be completed rather than as a way to learn, for example “[I] try to get the class work (or what’s assigned) finished so there is no homework” or “They are mostly all the same. The teacher gives us something to work on and we complete it.” Many students complained of noisy, chaotic classrooms that “are generally disruptive” with lots of student conversation competing with teacher instruction.
Only two students in special education indicated that some of their classes were fun. The majority described their classroom environments as “boring,” “crazy,” and “loud.” There were no descriptions of learning other than, “There is nothing to do, just look at the teacher talk” and “We see the teacher and we hear the teacher.”
Discussion
The purpose of this study was to explore through student drawings and corresponding narratives, middle grades students’ perceptions of their learning environment, which we defined to include pedagogy, interactions (teacher-student and student-student), and climate, and how these may differ based on service delivery model (i.e., gifted, special education, or general education settings). Consistent with previous research (Gentry et al., 2002; Montague & Rinaldi, 2001), results from the current study suggest differential learning experiences based on service delivery model. Students’ drawings and descriptions of their learning environment ranged from social, connected, supportive, and stimulating to isolated, disconnected, threatening, and uninteresting. Overall, students in gifted education settings produced drawings depicting positive learning environments representing relevant and engaging instruction that was both intellectually stimulating and nurturing. Similar to previous research (Ferreira & Bosworth, 2007; L. M. Johnson, 2006; Johnson et al., 2000; Lumpkin, 2007; Newman & Newman, 2001; Wentzel, 2003) the gifted students in this study perceived learning as meaningful and active. They attributed these experiences to middle grades teachers who facilitated thoughtful exchanges and interacted purposefully and respectfully with students.
In the general education group, drawings and narratives linked student behavior with classroom climate, as middle grades students drew classrooms where teachers and students appeared disconnected (e.g., working at their desks) and learners were largely apathetic about teachers, academics, and learning tasks. Descriptions of these settings centered primarily on the absence of critical thinking activities, the presence of teacher-centered instruction, and the proliferation of passive learning experiences. For middle grades students in general education settings, schooling is a highly routinized experience that prizes doing time rather than doing learning. Pianta et al. (2007) has documented this type of atmosphere as typical across the nation, with learners in most classrooms afforded few opportunities for coursework beyond basic instruction, limited interactions with classmates, and meaningful exchanges with classroom teachers.
Drawings by middle grades students served in special education settings reflected learning environments that focused more on behavior than academics. These depictions included more instances of teacher-directed instruction, and classrooms focused primarily on problematic student behaviors, which middle grades students attributed to negative student-teacher relationships. Negative teacher talk was the norm when dialogue was included in the drawings. There were low levels of student engagement and high levels of student apathy (e.g. students sleeping, students engaged in social exchanges). These findings are similar to those reported by Montague and Rinaldi (2001), whereby students in special education perceived lower teacher expectations and more negative teacher-student interactions than students in other instructional programs. Further, students in special education settings seemed apathetic about the learning experience.
Engaging middle grades students by using drawing as a data source can elicit rich, detailed, nuanced information from students including those who may have challenges with the writing process, thus providing equitable opportunities for all students to provide input. Findings from this study reveal how drawings can provide data that speak to perceptions differently than surveys, and can offer middle grades teachers and other stakeholders’ novel, individualized representations of students’ perceptions of their learning environment. The addition of narratives to explain the illustrator’s interpretation of the drawing served as a member check increasing accuracy of interpretation by the investigators (McLean, Henson, & Hiles, 2003) and added to the trustworthiness of the findings.
Finally research suggests a difference in the perception of the classroom based on who is doing the perceiving (i.e., student or teacher). Middle school students in our study described different learning experiences based on their service delivery model. Students with disabilities experienced classrooms that emphasize behavior management rather than rigorous academics. The current accountability movement (Individuals with Disabilities Education Improvement Act, 2004; No Child Left Behind Act, 2001) pertains to all students; students with mild/moderate disabilities are required to have access to the general education curriculum and be able to demonstrate adequate yearly progress in line with their nondisabled peers. The lack of emphasis on academics for students with disabilities in this study may place them at risk of failure and may result in higher dropout rates and/or graduating without a standard diploma.
Implications for Future Research
In terms of future research, we believe more representative samples of students from the three service sectors need to be included in order to better understand the phenomena of learning within each setting. In addition, research should also explore how student drawings can be used to inform educator preparation and teacher effectiveness. Research has attempted to explore the link between teacher effectiveness and teacher quality. Teacher quality has been defined in several ways including the framework proposed by Goe (2007) with the National Comprehensive Center for Teacher Quality. This framework includes both what has traditionally been defined as “teacher quality” (i.e., qualifications and certifications) and “teaching quality” (i.e., teacher practices), as well as student outcomes (p. 8). Previous research has found increased student achievement is correlated with higher performing teachers and detracking (Burns, Wiley, Welner, & Murphy, 2008). Are the differences found among the service delivery groups within this study related to teacher quality and setting? Future research is needed to explore the relationship between teacher quality and students’ perceptions of middle school classrooms through the use of drawings. For example, do students with teachers who demonstrate higher levels of teacher quality include more active learning opportunities in student drawings? Research is also needed to explore the use of student drawings in improving teacher quality. Can student drawings be used in both preservice and inservice learning opportunities to help teachers critically reflect on teaching practices and classroom climates in order to improve the quality of their practice?
Analyzing student drawings provides a window into classroom climate, paving the way for teacher reflection, self-evaluation, and conversations around how teachers can create optimal learning environments. Given that the major focus of this research was school reform both at the school level and the classroom level, it seems important that we not lose sight of the implications for social justice that are inherent in our methodology. For not only are we bringing to the foreground middle school students’ perceptions of their learning experiences and environment, but a methodology which extends the research platform to all students and validates their beliefs and perspectives.
Notes
Emphasis within quotations (e.g., capitalization, underlining, bold) were made by the participant.
Pseudonyms are used throughout
