


This study aims to examined the impact of business intelligence (BI) and supply chain ambidexterity (SCA) on operational performance (OP), contributing to dwarf knowledge in small- and medium-sized enterprises (SMEs) in the context of emerging economies. The mediating role of SCA was considered in the proposed model.
The study used the quantitative method to investigate the interdependencies between variables. As a result, 216 senior and middle managers/owners of SMEs in Ghana were surveyed using a purposive and convenient sampling method. SPSS version 23 and Smart PLS version 3 were used to conduct the research.
While the direct link among BI, SCA and OP was confirmed. The outcome also showed that SCA plays a significant mediating role between BI and OP among SMEs.
The outcome of the study indicates that SCA encourages the use of BI to generate superior OP among SMEs. This knowledge will improve the performance of SMEs and their ability to withstand the competition in the global market.
With the discovery of this study, the theory of a resource-based view now has some empirical evidence behind it. As a result, SMEs prioritize aspects that could improve their operations and implement tactics that would nurture better performance and competitive advantages.
Introduction
Identifying competitiveness in businesses remains a crucial issue of concern for managers in both developing and developed economies, thus when managers can identify that competitive strategy, they develop effective strategies for promoting their business (Haiyang et al., 2018). The growth of businesses remains essential to the development of emerging economies and Africa is no exception. Consistently, small- and medium-sized enterprises' (SMEs) contribution in African countries, in particular at the developing level cannot be underestimated. In Nigeria for instance, SMEs contribute 85% of total industrial employment (Shettima, 2017), in Kenya SMEs contribute 3% out of 6.4% growth rate in Kenya (Chege and Wang, 2020), and in Ghana, SMEs are pivotal in sustaining the growth of the economy. This is evidenced by about 90% of businesses registered to be SMEs and with about 70% contribution to GDP (Ghana Statistical Service (GSS), 2016). Despite successive governments in Ghana efforts to boost the activities of SMEs through policy interventions (political and economic policies), government divestiture programs and reforms aimed at encouraging entrepreneurship in Ghana (Kuenyehia, 2012) to increase their performance and competitiveness, available statistics indicate that very few are managing to survive for more than five years of operation (Yamoah et al., 2016; Yamoah and Arthur, 2014). Nonetheless, in keeping up with the commendable initiatives by the government of Ghana, statutory bodies such as the National Board for Small Scale Industries (NBSSI) have been set up in support of SMEs to enhance their performance in the country however, reports reveal that much will need to be done to enhance the performance of SMEs in Ghana (Amoah and Amoah, 2018; Osei, 2017). As a remedy, many firms including SMEs have shifted to the use of emerging information communication technologies including business intelligence (BI). BI has received global recognition over the past decade due to an increase in information availability via electronic means of gathering, analyzing and interpretations for business decisions (Ranjan and Foropon, 2021; Zhang et al., 2022). On the other side, others also believe that owing to globalization, which has introduced stiff competition in the emerging market coupled with rapid technological advancement, firms need to make efficient use of information to remain competitive. Dishman and Calof (2008) opined that information-processing activities advance in firms when they face high uncertainty. Without this, the survival of the business is questioned (Shollo and Kautz, 2010).
There are two dimensions to the concept of BI, according to Cheng et al. (2020). Data integration seeks to combine and give a consistent picture of data from multiple sources, whereas analytical capacity involves the effective deployment of analytical methodologies to transform business data into important decision-making knowledge (Dubey et al., 2019; Wamba et al., 2017). When it comes to product and service innovation, the focus has switched from innovators to first innovators or actors. That is to say, the importance of making strategic decisions is rising. Large firms no longer outperform small ones; first innovators are not always the winners, and in essence, the fast outperform those that are sluggish (Judge and Miller, 1991). According to Van Rijmenam et al. (2019), BI has emerged as a game changer because they help companies make better decisions based on accurate and comprehensive information. Increasing organizational learning and performance, as well as operational and inventive performance, are all correlated with strategic decision-making concepts such as decision quality, speed and comprehensiveness (Alexiev et al., 2020; Rahimnia and Molavi, 2020; Van Rijmenam et al., 2019). Despite the relevance of BI to firms' success, it is still unclear how BI may drive operational performance (OP) among SMEs in emerging economies like Ghana. Amineh et al. (2021) also stressed that literature on the implications of BI on SMEs performance is scarce. The few works of literature also produce mixed outcomes on the association between BI and firm performance (Dykes et al., 2019; Shepherd et al., 2020; Amineh et al., 2021). Apart from the inconsistency in the association of BI and OP, past studies have certain drawbacks. First, prior research has been limited to a few countries in developed regions. Therefore, this study was undertaken in Ghana with a distinct cultural context to determine whether the analyzed context may yield significantly different findings. Second, in addition to the variables listed above, other mediating variables can be investigated based on a particular theory, more than just the resource-based view (RBV). Prior studies (Shepherd et al., 2020; Amineh et al., 2021) have recommended the need to introduce a mediator in the BI-OP direct link.
Drawing from the RBV perspective, firm in their quest to develop and sustain competitive advantage must employ their intangible assets which include human capital, physical assets and organizational assets (Lonial and Carter, 2015; Molina et al., 2004). An essential notion drawn is that firms with valuable and unique resources have a high tendency of building strong competitive advantage, they become more competitive especially when this resource they possess cannot be imitated by their competitors. Among the strategies to achieve a higher competitive advantage in business today is BI (Kristoffersen et al., 2021; Rana et al., 2022). In this study, we see BI as an essential asset of small hotels that should be developed and used as a mechanism that can aid data gathering, processing and dissemination to support business decisions. We operationalized BI as a multidimensional construct which comes with intra-industry comprehensiveness, inter-industry analysis, BI formality and perceived usefulness. While the first two components represent external intelligence, the other two also dwell on internal structure and the use of information. The combination provides a comprehensive knowledge of the intelligence effort to support decision-making. According to the authors, SMEs will be better able to take advantage of existing possibilities and discover new ones if they use BI effectively (Stjepić et al., 2021; Maleki and Sabet, 2022; Wee et al., 2022). This will help them achieve superior OP. Supply chain ambidexterity (SCA) in this study, then, is a reflection of the capability of supply chains to be both efficient in managing current business demands and flexible in light of future perspectives, and it has promising potential for dealing with these trade-offs (Wamba et al., 2020; Sahi et al., 2020; Rialti et al., 2019; Chandrasekaran et al., 2012). As a result, it may encourage the development of company models that combine business knowledge with high levels of OP.
Prior studies (Aljumah et al., 2021; Alamsjah and Asrol, 2022; Belhadi et al., 2021) have argued that managers often face trade-offs between flexibility and efficiency, where giving preference to one over the other is detrimental. Contrarily, others believe that firms can pursue both strategies, flexibility and efficiency, by developing an ambidexterity capability (Ojha et al., 2018; Aslam et al., 2018; Zhao et al., 2021). Supply chain ambidexterity runs contrary to the popularly held view that firms should select the right supply chain for their product: for functional products, an efficient supply chain and innovative products, a responsive supply chain (Fisher, 1997). However, the notion of SCA assumes that the managers are not faced with an either/or decision, but can simultaneously have a flexible and efficient supply chain for their product (Lee and Rha, 2016; Aslam et al., 2018). Thus, while BI systems of firms enable them to have flexible and efficient SC, we also expect that though OP may be achieved via BI systems available to SMEs, superior performance could be achieved if managers of SMEs are to pursue both efficiency and effectiveness simultaneously.
To the best of our knowledge, there has been no attempt to unearth the indirect role played by SCA in the nexus between BI and OP in emerging regions like Sub Sahara Africa. The choice of SCA as a mediator is justified by its ability to combine both performance and capacity to withstand competition which is desired by small businesses. Additionally, this study is also motivated by the call for more studies on how BI will foster enhanced operations of SMEs (Aljumah et al., 2021). There have been only a handful of studies to date that have used DCT theory to examine the impact of BI on small and medium-sized businesses (SMEs) in emerging economies (Alsaad et al., 2022; Maleki and Sabet, 2022). Due to the lack of knowledge in these countries and the importance of SCA in Sub-Saharan Africa (SSA), there is a need for more studies in the region, even though researchers have studied and contributed to the SMEs in the area. The contribution of this study is twofold. First, the study adds to the understanding of the direct link between BI and OP among SMEs in developing economies. Presently, existing studies have largely focused on large industrial firms in developed economies, to the best of the researcher's knowledge no prior study have simultaneously examined how BI and SCA jointly drive OP in developing country like Ghana. Secondly, to date, there exists dwarf knowledge regarding how SCA could mediate the direct link between BI and OP. The rest of the paper is grouped as follows: Section 2 discussed the literature review; the methodology is looked at in section three. Results and discussion of findings are presented in section 4 and section 5 contains conclusions and policy recommendations.
Theoretical review and hypotheses development
Dynamic capability perspective
In the last decade, firms have been pushed to create new ways to manage their enterprises due to the uncertainty and instability of the business environment, coupled with the growing consumer power in recent times. In the wake of the COVID-19 pandemic, many supply chains have been disrupted, managers in their quest to return to normalcy and make their supply chain more responsive rely on both their internal and external competencies. In understanding how firms use their internal resources and competencies to gain a competitive advantage, existing studies have heavily relied on a RBV (Agi and Nishant, 2017; Zailani et al., 2015). The RBV theory argues for firms to improve their capabilities in managing resources, they depend on positive organizational responses (i.e. top management commitment, employee training, R&D technologies and environmental management systems) and this aid them to improve their innovation performance (Keller et al., 2019). From the RBV, resources represent firms' possessions or access to but rather not what the firm is capable of doing (Grobler and Grubner, 2006). A firm's competitive advantage depends on the processing and integration of both tangible and intangible resources (Newbert, 2007; Sirmon et al., 2008). Again, to maintain their competitive advantage, they must integrate their resources and competencies into a specific context (Sirmon et al., 2008). Resource-based theories are criticized for being context insensitive and failing to adequately identify the circumstances in which resources or capabilities are most beneficial (Ling-yee, 2007; Sedera et al., 2016). The dynamic capability approach, on the other hand, focuses on how and what context resources help a company to build a competitive advantage in a rapidly changing business environment (Teece et al., 1997; Sirmon et al., 2010; Singh et al., 2013). Companies' ability to integrate, grow and reconfigure their internal and external skills to adapt to quickly changing business contexts is defined as dynamic capabilities by Teece et al. (1997). Additionally, dynamic capabilities include the ability to recognize and shape possibilities, grasp chances, and maintain a competitive advantage by upgrading, combining, safeguarding and reconfiguring the resources of the organization. It has been argued that dynamic capabilities are simple, experiential, unstable processes that depend on the creation of emerging insights that allow the combination of renewable resources and competencies into dynamic capabilities critical for the unstable environment (Eckstein et al., 2015; Dubey et al., 2018). Drawing from this earlier discourse, BI has been cited as a dynamic capability (Torres et al., 2018; Božič and Dimovski, 2019; Chen and Lin, 2021), which results from the firms' ability to configure both existing and potential opportunities. Hence, we expect a direct link from BI to both OP and SCA through the lens of DCT. The study also anticipates an indirect role of SCA in the link between BI and OP; while we also expect a direct impact of SCA on OP, we expect SCA to influence the BI-OP direct link.
Conceptual framework and hypotheses development
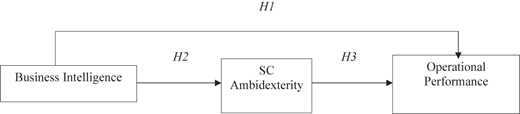
Dynamic Capability View (DCV) remains an essential pillar that supports our theoretical model (see Figure 1). Owing to the dynamic nature of the business environment in recent times, the DCV has acquired a lot of traction among management researchers in their quest to combine firm resources and competencies to give a firm a competitive advantage in a highly uncertain environment. The ability to sense, seize and respond to emerging trends is considered a solution to uncertainty, which is consistent with earlier reasoning. Volatile and complicated work contexts, where high levels of uncertainty make efficient planning and decision-making difficult, exacerbate the requirement for supply chain competencies. Drawing from the Dynamic Capability Theory (DCT), firm BI competencies of various forms are more beneficial in highly uncertain contexts. Thus, BI and SCA form essential dynamic capabilities that SMEs can leverage to achieve superior performance. Though prior studies have showed how these variables individually serves as capabilities and resources that firms leverages to enhance their performance, combining them in this model makes important theoretical extension by validating that BI and SCA remain important capacities and resources to firms. In this regard, we expect a direct link from BI to both SCA and OP via the lens of the DCT. We further examined the indirect role of SCA in the link between BI and OP; while we also expect a direct impact of SCA on OP. The various hypotheses advanced in this study are further discussed below.
Effect of business intelligence on operational performance
A business's success can be measured by assessing how well the business is doing. As a result, firms often assess their performance from its internal business process (Kristoffersen et al., 2021). Subjective (financial) and objective (nonfinancial) metrics, or both, have been widely used to determine adequate performance (Hudson et al., 2001; Nastasiea and Mironeasa, 2016). Meanwhile, because it can be difficult for owners to provide relevant financial information, the addition of nonfinancial measures is much preferred (Hayat et al., 2019). Furthermore, a variety of writings suggests that the underutilization of higher capacity is a crucial factor that hinders the production growth of several SMEs in Africa (Ahiakpor et al., 2014; Worlu and Granville, 2017). The concept of capacity utilization is quite desirably used in the production of simpler-to-measure tangible products (Worlu and Granville, 2017), which is very characteristic of SME manufacturing firms in Ghana. While there is quite a plethora of information on capacity utilization, limited surveys have established capacity utilization as a measure of business performance, particularly in the instance of emerging economies (Ahiakpor et al., 2014). There has been some research into the relationship between BI and firm performance (Nuseir et al., 2021; Chen and Lin, 2021; and Rana et al., 2022; Paulino, 2022; Huang et al., 2022; Lateef and Keikhosrokiani, 2022; Yang et al., 2022; Chen and Lin, 2021; Torres et al., 2018). The available evidence indicates from these studies suggest that achieving superior performance cannot be at the expense of BI. BI offers the firm useful insight through data and technology to support operational decisions, which in return could improve OP of the firms. Nevertheless, there is limited evidence on how firms could leverage the benefits of BI to improve their OP. This study therefore examines the nexus between BI and OP. This interrelationship is suggested to be important due to the actions and the consequent changes that are made by firms to act in accordance with the environmental changes and new opportunities (Nuseir et al., 2021). There are a number of obstacles that businesses must overcome on their way to achieving excellent OP. In order to adapt to evolving environments, they must constantly update their capacities and resources, while also keeping tabs on their established skills in light of recent achievements (Caseiro and Coelho, 2019).
Drawing from the conclusions of previous studies (Popovič et al., 2018; Torres et al., 2018; Božič and Dimovski, 2019; Chen and Lin, 2021; Alzghoul et al., 2022) which found a positive significant relationship between BI and firm performance, we expect that BI in SMEs will improve OP. From the above discussion, the first hypothesis has been made.
BI has a significant positive effect on OP among SMEs.
Effect of business intelligence on supply chain ambidexterity
An ambidextrous organization can take advantage of both current and new opportunities to gain a competitive advantage over its competitors (Fosso Wamba et al., 2019). According to Raisch and Birkinshaw (2008), an organization must reconcile the conflicting expectations placed on it by the external world to be successful. Wong (2004) indicated the need to balance efficiency in taking advantage of already available possibilities with the need to search for and respond to new ones through experimentation. Though several ambidexterity studies exist (Kristal et al., 2010; Blome et al., 2013a; Ojha et al., 2018; Aslam et al., 2018; Altay et al., 2018). Prior studies have focused on the relationship between SCA and supply chain agility (Aslam et al., 2018), cost performance (Blome et al., 2013a) and supply chain strategy (Aslam et al., 2020; Partanen et al., 2020; and Blome et al., 2013b; Aslam et al., 2018). The significance of BI in solving the ambidexterity problem, on the other hand, is still an unanswered question in literature (Boe-Lillegraven, 2014). Firms with ambidextrous supply chain can lessen the impact of supply chain interruptions and improve their bottom line (Lee and Rha, 2016). To achieve long-term efficiency advantages, SCA demands a company's supply chain to be both nimble and flexible at the same time (Aslam et al., 2018). Though the relationship between BI and SCA has not been adequate and empirically justified, few studies (Maghrabi et al., 2011; Božič and Dimovski, 2019; Abdalla and Nakagawa, 2021) have argued that BI plays an essential role in achieving SCA. The above discussion leads to the second hypothesis of the study.
BI has a significant positive effect on SCA among SMEs.
Effect of supply chain ambidexterity on SME's operational performance
SCA has been found to increase the success of corporations in previous research (Im and Rai, 2008; Kristal et al., 2010; Rojo et al., 2016; Patel et al., 2012; Ojha et al., 2018). SMEs can only control so much of their interactions before breaking point. To this end, they provide an additional justification for why SCA matters for firm performance (Agostini et al., 2016; Beekman and Robinson, 2004; Arend and Wisner, 2005). To substantiate this claim, SMEs are regarded as exposed to both the dangers of their small size and their inexperience (Stinchcombe, 1965). Financial, technological, physical and intangible assets are all restricted for small firms. Because of their inexperience, SMEs have a higher risk of bankruptcy (Freeman et al., 1983; Stuart, 2000). Due to a lack of resources and a lack of interest from potential partners, small and medium-sized businesses may find it difficult to pursue both efficiency and adaptability SCA may allow it to focus on exploiting its smaller and smaller partners, whereas larger supply chain partners may be unwilling to spend time and energy establishing connections with their small, low-volume customers (Mudambi et al., 2004). According to a previous distinction, ambidexterity “is necessary to pursue both exploration and exploitation for its inventive redesign of operational processes and continual productivity development simultaneously” (Lee et al., 2015, p. 402). Dynamic capabilities, which are indicative of a high degree of organizational ambidexterity, have been shown to positively impact business performance (O'Reilly and Tushman, 2008). An organization's ability to recognize environmental shifts and capitalize on new openings is directly related to its flexibility and responsiveness to change. Their ability to spot emerging risks and capitalize on emerging opportunities could be enhanced by BI skills that are dynamic (Mikalef et al., 2019a, b). BI helps reduce unnecessary data, allowing businesses to better spot and capitalize on possibilities (Rialti et al., 2018). Information management systems that are flexible in the face of changing conditions and data may help businesses seize emerging possibilities, as the thinking goes (Lu and Ramamurthy, 2011). Companies, like individuals, can benefit from the flexibility of information management systems by learning to spot and capitalize on possibilities. Therefore, ambidexterity may affect how well an act is executed. It may serve as a linchpin linking the efficiency with which an SME uses its BI and its actual efficiency. Hence, we expect not just a direct impact of SCA on OP but also an indirect effect of SCA in the BI-OP relationship. This finds support from prior studies (Aljumah et al., 2021; Pertheban and Arokiasamy, 2019; Chams-Anturi et al., 2019; Belhadi et al., 2021; Zhao et al., 2021; Al-khawaldah et al., 2022), which indicated that organizational ambidexterity plays an indirect role in improving the performance of firms. This study based on the contradictory views expressed re-examines the relationship by posing the third and fourth hypotheses.
SCA has a significant positive effect on OP among SMEs.
SCA mediates BI and OP among SMEs.
Data and methodology
Sample and data collection
In the attempt of understanding how BI could shape SCA and OP, a survey approach was employed to evaluate the hypotheses proposed (see Figure 1). The choice of the survey approach is justified by its ability to provide accurate documentation of norms, identification of extreme information and the delineation of relationships among the constructs in a study sample (Gable, 1994). Flynn et al. (1990) further added that the survey approach facilitates research models with real-world data. The survey approach allowed data gathering from 216 supply chain managers of SMEs in Ghana. 58% of the 216 participants in the study were men, and 42% of them were women. A total of 42.6% held a Higher National Diploma, 41.7% a Bachelor's Degree, and 9.3% a Master's Degree. A total of 39.8% of the respondents are in another department, 26.9% of the respondents are in the stores/procurement department, 24.1% and 9.3% are respondents in the supply chain and warehousing departments, respectively (see Table 1).
Demographic information
| Variable | Category | % |
|---|---|---|
| Gender | Male | 58% |
| Female | 42% | |
| Education | Higher national diploma | 42.6% |
| Bachelor's degree | 41.7% | |
| Master's degree | 39.8% | |
| Department | Stores/Procurement | 26.9% |
| Supply chain | 24.1% | |
| Warehousing | 9.3% | |
| Others | 39.8% | |
| Total | 216 | 100% |
We used both online and personal interviews to collect primary data from senior managers with supply chain experience in the SME setting. Before the main data collection, we piloted the questionnaire among 44 respondents. Reliability and validity measures were explored using the pilot data, aside from the pilot study, two associate professors and three industry professionals reviewed the questionnaire to ensure the content validity. The pilot result showed good reliability and validity measures (i.e. Cronbach' alpha > 0.70; AVE > 0.50). Though the study was conducted during the peak of the COVID-19, the study followed the protocol and ethics of research by first obtaining approval from the owners/HR managers of the sampled firms and continuous assurance of respondents that any information they provide would not be used for any other purpose for which their consent has been sort. Additionally, the questionnaire was designed to include the definitions of the various constructs used in the study. This rigorous approach compensated for the high response rate (72%) and high reliability and validity established in this study.
Measures
The items of the questionnaire were sourced from studies, in all three constructs explored in this study. The items used to measure SCA were adopted from Roth et al. (2008), Kristal et al. (2010), BI was adopted from Cheng et al. (2020), Nuseir et al. (2021) and OP was adapted from Osei et al. (2016). Details of the items used in measuring the variables are provided in Appendix 2.
Survey and common method bias
Nonresponse bias was evaluated using the method proposed by Armstrong and Overton (1977) because survey-based research is always susceptible to bias. The t-test did not indicate any differences between early and late respondents in this study's findings (see Table 2 below). Considering the long duration of the data collection, it is imperative to evaluate the presence of survey bias in the dataset. In this regard, several precautionary procedures were taken in this study to avoid common methods and response bias (Podsakoff et al., 2012). First, as part of strategies to minimize bias in the dataset, questionnaires were translated into the local language for a few respondents who had issues with understanding the concepts used in the study. A prior study by Brislin (1970) opined that translating into one's native language is beneficial for gathering reliable information about phenomena in a foreign environment. Secondly, respondents were informed that the information they submitted would be kept personal and private. This assurance kept them from succumbing to social desirability bias or giving appealing responses (Podsakoff et al., 2012). Thirdly, we also provided definitions of the key constructs as used in the study, to guide respondents where the researcher was not available to provide such an explanation.
Test for none response bias (Independent t-Test)
| Constructs | Groups | F | Sig | T Statistics |
|---|---|---|---|---|
| BI | Early response | 0.780 | 0.378 | 1.684 |
| Late response | ||||
| SCA | Early response | 0.116 | 0.734 | 1.495 |
| Late response | ||||
| OP | Early response | 1.496 | 0.020 | 1.871 |
| Late response |
Apart from these strategies that were used, several statistical tests were conducted to validate the absence of bias in the data. Firstly, the data were subjected to Harman's one-factor test, as suggested by the study of Scott and Bruce (1994). Three components with an eigenvalue greater than one accounted for 70% of the variance, and no single factor exceeded 50% of the total variance (See Table 3). Again, the Partialling out of general factor in the PLS model procedure as recommended by Tehseen et al. (2017) was also employed. The result showed just a slight difference of 0.03 between the original R2 and the R2 after the general factor.
Test for common method bias
| Component | Initial eigenvalues | Extraction sums of squared loadings | ||||
|---|---|---|---|---|---|---|
| Total | % of variance | Cumulative % | Total | % of variance | Cumulative % | |
| 1 | 10.972 | 32.248 | 32.248 | 10.972 | 32.248 | 32.248 |
| 2 | 2.066 | 29.838 | 62.086 | 2.066 | 29.838 | 62.086 |
| 3 | 1.631 | 7.767 | 69.853 | 1.631 | 7.767 | 69.853 |
| 4 | 0.804 | 3.827 | 73.680 | |||
| 5 | 0.645 | 3.073 | 76.753 | |||
| 6 | 0.537 | 2.557 | 79.311 | |||
| 7 | 0.486 | 2.315 | 81.626 | |||
| 8 | 0.460 | 2.190 | 83.816 | |||
| 9 | 0.422 | 2.010 | 85.826 | |||
| 10 | 0.372 | 1.771 | 87.597 | |||
| 11 | 0.344 | 1.637 | 89.235 | |||
| 12 | 0.325 | 1.547 | 90.782 | |||
| 13 | 0.308 | 1.467 | 92.248 | |||
| 14 | 0.269 | 1.280 | 93.528 | |||
| 15 | 0.258 | 1.229 | 94.757 | |||
| 16 | 0.231 | 1.101 | 95.858 | |||
| 17 | 0.212 | 1.008 | 96.866 | |||
| 18 | 0.191 | 0.908 | 97.773 | |||
| 19 | 0.166 | 0.790 | 98.563 | |||
| 20 | 0.156 | 0.743 | 99.306 | |||
| 21 | 0.146 | 0.694 | 100.000 | |||
Note(s): Extraction Method: Principal Component Analysis
Results and discussion
Data analyses in this study are in two phases. The first phase deals with the model measurement which was done via confirmatory factor analysis (CFA). The second phase dealt with the hypotheses testing using the structural equation model (SEM). Both phases of the analyses were conducted using the partial least squares-structural equation modeling (PLS-SEM). The use of PLS-SEM in this study was influenced by its flexibility in terms of sample distributional characteristics and sample size: however, the choice was justified by the inability of the data to meet all the multivariate assumptions (i.e. normality) required in parametric analyses (Hair et al., 2017).
Evaluation of psychometric properties
The first phase which deals with the model measurement was conducted using CFA to validate the reliability and validity of all the constructs in the study (see Figure 2). In assessing internal consistency, the use of CFA was employed. Interestingly, all the CA values were significantly above the recommended threshold (0.7). This implies that the constructs in the model are reliable (Hair et al., 2019, 2020). The result also showed that the indicator loadings ranged between 0.702 and 0.995. Items that could not meet the 0.7 threshold were deleted and the final loading of the constructs was approximately 0.81. This confirms convergent validity (Amora, 2021; Canatay et al., 2022).
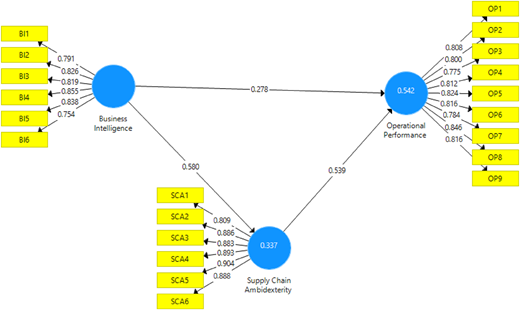
Additionally, the composite reliability coefficient also demonstrated good scale reliability (CR values above 0.7) (Kamis et al., 2020). The result also showed that AVE values were all greater than the 0.5 threshold (see Table 4). Thus, confirming evidence of convergent validity (Amora, 2021; Hair et al., 2019). To further establish discriminant validity, the square root of the constructs was compared with their within (bivariate) correlations and the result evidenced that in any case, the square root of the constructs was higher than they are within correlations, which also depicts evidence of discriminant validity (Ab Hamid et al., 2017) (see Appendix 1).
Reliability and validity
| Constructs | Items | Loadings | CA | CR | AVE | VIF |
|---|---|---|---|---|---|---|
| Business intelligence | BI1 | 0.791 | 0.899 | 0.922 | 0.664 | 2.151 |
| BI2 | 0.826 | 2.486 | ||||
| BI3 | 0.819 | 2.130 | ||||
| BI4 | 0.855 | 2.610 | ||||
| BI5 | 0.838 | 2.375 | ||||
| BI6 | 0.754 | 1.657 | ||||
| Operational performance | OP1 | 0.808 | 0.934 | 0.945 | 0.655 | 2.130 |
| OP2 | 0.800 | 2.130 | ||||
| OP3 | 0.775 | 2.265 | ||||
| OP4 | 0.812 | 2.769 | ||||
| OP5 | 0.824 | 2.130 | ||||
| OP6 | 0.816 | 1.025 | ||||
| OP7 | 0.784 | 2.279 | ||||
| OP8 | 0.846 | 1.225 | ||||
| OP9 | 0.816 | 2.883 | ||||
| Supply chain ambidexterity | SCA1 | 0.809 | 0.940 | 0.953 | 0.770 | 2.316 |
| SCA2 | 0.886 | 1.482 | ||||
| SCA3 | 0.883 | 1.260 | ||||
| SCA4 | 0.893 | 2.888 | ||||
| SCA5 | 0.904 | 2.796 | ||||
| SCA6 | 0.888 | 1.287 |
Testing of hypothesis
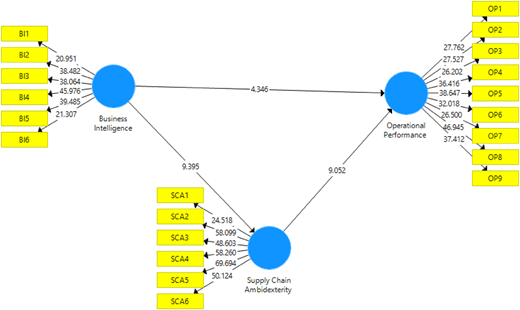
The second phase of the analysis which deals with the structural model evaluation is depicted in Figure 3 below. The result of the structural model evaluation is presented in Table 5 and Figure 2. The PLS bootstrapping with 5,000 samples were used in testing the significance of the four paths in the model. Before the hypotheses testing, multicollinearity was evaluated using Variance Inflation Factor (VIF), the result demonstrated that VIF values recorded in this study were below the 3.3 thresholds recommended by (Kock, 2015). This, therefore, provides evidence to justify that the predictors have no issues of multicollinearity. Model fit was also examined in line with the recommendation of Henseler et al. (2016). The findings evidenced that the SRMR was approximately 0.73, which is way below the 0.8 threshold. This suggests that the proposed model and the observed data are well aligned. Table 5 presents the significance levels of the structural model path coefficients analysis, which shows that all four hypotheses were confirmed. The relationship between BI and OP was found to be significant (=0.155, t = 2.939, p < 0.05) A substantial positive relationship (=0.228, t = 4.928, p < 0.05) was found between BI and SCA. SCA and OP was found to have direct significant relationship (=0.557, t = 10.013). As a consequence, all three of the original hypotheses were supported. SCA was investigated further as a mediator between BI and OP. Result showed that SCA partially mediates the link between BI and OP (=0.14, t = 2.477, p0.05). In other words, BI and OP are linked not just directly but also indirectly via SCA. The outcome demonstrates that though BI enhances OP, superior OP can be achieved via SCA.
Testing of hypothesis
| Hypotheses | Path coefficient | Error | T statistics | p values | Result |
|---|---|---|---|---|---|
| Business intelligence → Operational performance | 0.278** | 0.064 | 4.346 | 0.000 | Supported |
| Business intelligence → Supply chain ambidexterity | 0.580** | 0.062 | 9.395 | 0.000 | Supported |
| Supply chain ambidexterity →operational performance | 0.539** | 0.060 | 9.052 | 0.000 | Supported |
| BI → SCA > OP | 0.313** | 0.050 | 6.315 | 0.000 | Supported |
Note(s): ** = p < 0.05
Discussion of findings, implications and conclusion
This study examined the impact of BI and SCA on OP, contributing to dwarf knowledge in SMEs in the context of emerging economies. The mediating role of SCA was considered in our proposed model. Therefore, the study's findings shed light on the importance of BI and SCA in assuring superior OP in the context of SMEs in an emerging market like Ghana. SMEs and policymakers in Ghana will benefit from the study's findings. The study provides a performance framework for optimal understanding of the effect of BI and SCA in ensuring superior OP in the context of SMEs in the context of developing economies.
The result of this study concludes that BI significantly enhances OP among SMEs in Ghana. This confirms past studies (Paulino, 2022; Huang et al., 2022; Lateef and Keikhosrokiani, 2022; Yang et al., 2022; Chen and Lin, 2021; Torres et al., 2018) which have demonstrated that BI plays an essential role in driving organizational performance. While extant literature generally examines the role of BI in driving organizational performance, this study provides context-specific insight into the impact of BI on OP, thus firm's new product lines, production volume growth and capacity utilization are scarce in extant performance literature, particularly in emerging economies which SSA is no exception. This is also to say that, to ensure superior OP in the SME sector, there is a need for effective use of BI, just the adoption may not produce a favorable outcome but efficient utilization is imperative. Additionally, the findings also showed that BI positively drives SCA. SCA was found to have a positive effect on OP, as the researchers discovered. Several studies have demonstrated a link between SCA and OP, such as Liu et al. (2013), Chen et al. (2015), Gupta and George (2016), Wamba et al. (2017), Mikalef and Pateli (2017) and Mikalef et al. (2017, 2022). To put it simply, this research is an attempt to synthesize information systems management, operations management and strategic business management literature. Several researchers have previously attempted to bridge the gap between information systems and operations management literature by using either the dynamic capability view or the organizational information processing theory or the integration of the resource-based view and institutional theory, but these studies were limited to a single theoretical framework. We can therefore claim that our research offers some intriguing theoretical advances and managerial possibilities. Finally, the result showed that SCA partially mediates the relationship between BI and OP. This implies that the relationship between BI and operational performance is not just a direct link but also through SCA. The outcome demonstrates that though BI enhances OP, superior OP can be achieved via SCA.
Theoretical contribution
There are three ways in which our research has made a significant contribution. If you think that dynamic capabilities are a universal, one-size-fits-all answer, our study gives actual evidence to back that claim. Findings from our empirical research help clarify the channels of dynamic capabilities theory, which is a vital part of any theory to move forward BI-enabled dynamic capabilities are linked to SCA and OP via environmental dynamism, according to our study. Research needs in our field are being addressed by this study: How do BI and SCA differ in their impact on operational efficiency? And does SCA play any role in shaping the direct link between BI and OP through indirect means? In terms of operations and supply chain management, these are among the most urgent questions (Waller and Fawcett, 2013; Schoenherr and Speier-Pero, 2015; Dubey et al., 2018). SCA has emerged as a critical component in the broader operations and supply chain discourse, and our findings are in line with those of earlier operations and supply chain management researchers (see Kristal et al., 2010; Blome et al., 2013; Aslam et al., 2018). No consensus has been reached on how to deal with the SCA conundrum according to Barratt and Oke's (2007) theory that competitive advantages arise from how technology is used, rather than the technology itself Traditional supply chain assumptions that one supply chain approach (e.g. efficient/responsive) is best suited for a given product are challenged by the findings of this study (Gunasekaran et al., 2017; Srinivasan and Swink, 2018). When Dynamic Capabilities (DCs) with BI is used to support a product's supply chain, the supply chain can be both flexible and efficient (BI), we can incorporate the dynamic perspective argument into SCA.
Practical implications
Managers contemplating BI-enabled DC can benefit from the conclusions of our study, which we hope will serve as sound advice. Before investing, investors should take into account the following factors: This includes the ability to recognize changes in the internal and external environment, which may help shape opportunities and mitigate risk; (1) their organizations' ability to seize opportunities and (2) their organizations' ability to reconfigure intangible and tangible assets to maintain a competitive advantage. As a result, firms can improve their exploitation and exploration to achieve superior OP by increasing their use of BI. Dynamic capabilities afforded by BI, on the other hand, aid organizations in achieving their intended performance levels by enhancing the dynamic nature of the surrounding environment. While some routines happen by chance, others necessitate managers' patience and insight in selecting when and how to establish organizational capabilities and how to investigate and utilize the organizational capabilities at the same time to acquire a competitive edge.
Conclusion
This study proposed to investigate the mediating role of SCA in the relationship between BI and OP among SMEs in Ghana. Considering the dearth of literature particularly in the context of emerging economies like Ghana makes this study imperative. Our study hypothesized various relationships which were tested using survey data from SMEs' perspective. This study has proved otherwise albeit presented interesting inferences that can influence supply chain strategies and management in the SME setting in Ghana and Africa. The findings showed a direct significant relationship between BI, SCA and OP, the mediating role of SCA was found to be significant. This study has made managerial and theoretical implications of the above findings and the necessary research recommendations that will influence the industry development as well as future research.
Future research recommendations
Grounded on the study's findings, recommendations are provided for future research; in the future, researchers can expand the area of data collection to cover other sectors in Ghana. Future research can also replicate the model in other sectors or countries to see whether it will produce a similar result. Furthermore, future researchers can look at how commitment, information sharing moderates the relationship. Other studies could also explore the applicability of the model in a different context.
References
Further reading
Appendix 1
Appendix 2 Construct measurement
Supply chain ambidexterity
SCA1: In order to stay competitive, our supply chain managers focus on reducing operational redundancies in our existing processes.
SCA2: Leveraging our current supply chain technologies is important to our firm's strategy.
SCA3: In order to stay competitive, our supply chain managers focus on improving our existing technologies.
SCA4: Our managers focus on developing stronger competencies in our existing supply chain processes.
SCA5: We proactively pursue new supply chain solutions.
SCA6: We continually experiment to find new solutions that will improve our supply chain.
SCA7: To improve our supply chain, we continually explore for new opportunities.
SCA8: We are constantly seeking novel approaches in order to solve supply chain problems.
Business intelligence
To what extent do the organization's data integration systems serve as data sources?
To what extent does your organization depend on spreadsheets and databases as data sources?
To what extent does the organization's data warehouse or data marts serve as data sources?
Full integration of data enables real-time monitoring and analysis
To what extent the organization's information technology systems used to produce reports are?
How extensively does your organization use online analytical processing (OLAP)?
To what extent is the organization using analytical applications, such as trend analysis and “what if” scenarios?
To what extent are cloud data services used in your organization?
To what extent are dashboards used to monitor activities in your organization?
Operational performance
The firm significantly introduces new products to the market on regular basis.
The firm significantly introduces improved product designs on regular basis.
The firm significantly adopts new technologies in its production processes.
The firm is able to produce to meet demands and orders.
The firm's rate of production volume has increased significantly.
The firm has significantly increased its production capacity to meet current demand.
The firm has adequate plant and equipment to meet production demand.
The firm's production capacity can accommodate more product demand from the market.
The firm has increased its rate of production capacity utilization significantly.

