Skip to article sections
Purpose

The paper studies the integration of UX into a cybersecurity project using a longitudinal mixed-method approach, how introducing UX influences design, management decisions and security-relevant outcomes, formalises these mechanisms in a four-phase framework and derives recommendations.

Design/methodology/approach

An exploratory case study follows a multi-year cybersecurity project (2022–2025) with multiple rounds of participant observation, survey and interviews.

Findings

UX integration facilitates consensus-building, fosters a human-centred mindset and serves as the backbone of the project.

Research limitations/implications

Single-case design, small homogeneous sample and context-specific setting prevent statistical generalisation.

Practical implications

Recommendations and framework support safer, more inclusive systems by aligning design with diverse user needs.

Originality/value

Presents a phase-based framework showing how UX practices reshape security decisions across four stages (recognition, anchoring, translation and operationalisation), alongside replicable UX methods and 10 actionable recommendations for development and management teams.

The belief that humans are the weakest link in cybersecurity restricts the scope of potential solutions. Scientific literature predominantly focuses on user education and awareness (Alsharida et al., 2023). Organisations often attempt to exclude humans from systems or, when this is not feasible, rely on training, awareness programs and restrictive policies to control user behaviour (Zimmermann and Renaud, 2019). However, systems that neglect user needs and requirements risk being rejected or mishandled, undermining security. Studies as early as 1996 advocate for human-centred design solutions and adherence to human–computer interaction principles to improve usability and motivate users to engage in safe behaviours and actions (Besnard and Arief, 2004; Pollini et al., 2022). Recognising human interaction as a critical component of cybersecurity highlights the dual role users can play: strengthening defences or introducing vulnerabilities. Recent studies begin to shift this narrative, positioning humans as the first line of defence and essential partners in combating cyber threats (Zimmermann and Renaud, 2019; Pollini et al., 2022; Zimmermann et al., 2024).

To mitigate threats, cybersecurity design must prioritise user needs and requirements. Prior work shows that improving user experience helps users adopt safer behaviours by making systems easier to use (Besnard and Arief, 2004; Pollini et al., 2022). Good user experience (UX) has become a prerequisite for system adoption, as users may reject a system if they cannot efficiently achieve their goals (Bias and Mayhew, 2005; ISO 9241-210, 2019). UX, which encompasses usability, is defined as user's perceptions and responses that result from the use or anticipated use of a system, product or service (ISO 9241-210, 2019). Despite an abundance of related literature (Hinderks et al., 2022), UX integration remains a challenge to practitioners and organisations attempting it (Chamberlain et al., 2006; Salah et al., 2014; Choma et al., 2022). This issue is particularly evident in cybersecurity, where the integration of UX and human–computer interaction principles is largely absent, with very few, if any, projects explicitly addressing this to date (Pollini et al., 2022).

This article [1] presents findings from a two-year case study of a cybersecurity R&D project (2022–2025) supporting the design of cyber range scenarios. Rather than evaluating user compliance, motivation, or satisfaction, which fall outside the study scope, we focus on internal project dynamics during UX integration. Specifically, we analyse how UX activities influenced team coordination, decision-making and perceptions of secure design. Data were collected through systematic participant observation (journaled project events and outcomes), a UX literacy survey (Azevedo et al., 2023) and semi-structured interviews on UX integration and future adoption. The study consolidates these results into: (1) a transferable set of UX methods and procedures tailored to cybersecurity contexts; (2) a framework formalising UX integration across four project phases; and (3) 10 actionable recommendations for development and management teams.

Human-centred design (HCD) offers an approach that aligns secure systems with user capabilities and limitations, improving experience and security. HCD prioritises user satisfaction and performance through four phases: specify the context of use, define user requirements, generate design solutions and evaluate them (ISO 9241-210, 2019). Building on HCD, UX aims to meet user needs, strengthening system security and usability. UX goes beyond usability, defined as “extent to which a system, product or service can be used by specified users to achieve specified goals with effectiveness, efficiency and satisfaction in a specified context of use” (ISO 9241-11, 2018). It encompasses pragmatic and hedonic attributes (Mahlke and Thüring, 2007; Hassenzahl, 2018). Pragmatic qualities concern efficiency, usability and functionality; hedonic qualities concern emotion, aesthetics and the pleasure of use. Effective UX balances these dimensions so systems support tasks with minimal friction and also sustain user satisfaction and engagement.

The cybersecurity community often views humans as the weakest link, attributing failures to carelessness, errors, or negligence (Furnell et al., 2018). This view downplays how culture and the role of group, social and organisational systems shape behaviour and security culture (Wiley et al., 2020). Complex procedures that fail to meet user needs prompt workarounds and non-compliance (Alsharida et al., 2023). Procedures alone are insufficient, since users always find ways around them (Besnard and Arief, 2004). Framing “humans as a problem” biases solutions toward training and protocols and excludes users from systems; Zimmermann and Renaud (2019) instead advocate viewing humans as part of the solution.

Understanding users improves security behaviour. Sociodemographics, decision-making styles and context shape responses to controls (Chowdhury et al., 2018). UX and HCD principles prioritise user needs and guide intuitive, effective security measures (Gratian et al., 2018). Research since 1996 recommends human-centred design and HCI to foster safer behaviour (Besnard and Arief, 2004; Pollini et al., 2022). By incorporating these principles, security measures can become more intuitive and effective.

Incorrect security actions usually stem from a design that conflicts with user goals or workflows rather than malicious intent. Users focus on completing tasks; when controls hinder productivity, they adopt workarounds or bypass protocols without malicious aims (Pollini et al., 2022). Contributing factors include limited understanding or motivation and limited ability to make informed decisions (Cranor, 2008). Common examples include weak passwords (De Bruijn and Janssen, 2017) and credential sharing to expedite work (Chowdhury et al., 2018), often because perceived benefits of bypassing controls outweigh perceived risks (Besnard and Arief, 2004). Users also report unclear communication, time pressure, inaccessible documentation and inadequate instructions (Pollini et al., 2022). When design neglects user needs and behaviour, measures become counter-productive and create vulnerabilities with significant consequences for individuals and organisations (Corradini, 2020). A human-centred approach aligns controls with workflows and reduces usability-driven trade-offs.

Good design considers the full interaction context, not only the system. Environmental stimuli such as competing communication, ambient light or noise can divert attention from security cues (Cranor, 2008). Habituation to repeated, standardised warnings further reduces attention, so users may miss indicators in familiar software (Cranor, 2008). Attention attractors can refocus users on key features but may disrupt workflows, creating a security–usability trade-off (Bravo-Lillo et al., 2013). Human-centred design helps manage these trade-offs by aligning security tasks with user workflows and UX methods reveal gaps between perceived and actual security. For example, Stojkovski et al. (2019) use multi-layered user journeys to uncover misalignments that inform security analysis.

Despite these benefits, few cybersecurity papers engage directly with UX. Many focus on generalisable human characteristics, secure usability, or pragmatic aspects of UX such as effectiveness or efficiency. For instance, Gratian et al. (2018) and Furnell and Clarke (2012) analyse human characteristics to inform design but do not conduct UX research with specific users. By contrast, UX work gathers and applies first-hand user data to fit user needs. Although Rajarathnam and Singh (2024) claim that UX and cybersecurity are well represented, their own NVivo keyword analysis suggests otherwise: “UX” is absent; “user” appears but is likely mostly linked to topics such as authentication or access; and “experience” is also absent. Usability is reported, but usability is limited to functional and efficiency-related concerns, omitting UX's hedonic dimensions such as stimulation (Hassenzahl, 2018) or social acceptance (Mortazavi et al., 2024). Their findings therefore reinforce the lack of genuine research on user experience with secure systems. That is not to say UX is entirely absent from cybersecurity: Wash (2010) identifies user threat models via interviews and mental modelling, and Zimmermann et al. (2024) advocate human-centred cybersecurity, showing how user–system interaction affects outcomes.

Difficulties integrating UX extend beyond cybersecurity. Many organisations and stakeholders struggle to prioritise UX in software development (Gray et al., 2015). Trust matters: teams tend to trust UX practitioners before trusting UX as a field (Nielsen et al., 2023) and building that trust remains challenging (MacDonald, 2017), especially under uncertainty and individual risk aversion (Nielsen et al., 2023).

Misaligned rationales, priorities and practices create friction (Law and Lárusdóttir, 2015). Challenges include developer focus on functionality and efficiency over usability (Bak et al., 2008; Ardito et al., 2014) and weak mutual understanding with designers hinder communication (Jones and Thoma, 2019; Argumanis et al., 2020; Kashfi et al., 2017). Senior management often protects developer time, which lowers the perceived value of UX and expectations for UX quality (Nielsen et al., 2023). Insufficient prioritisation and resources result in disorganised UX management, a lack of strategic representation and inconsistent practice across projects (Nielsen et al., 2023), producing high workloads (Jurca et al., 2014) and bottlenecks (MacDonald, 2017).

Both Agile and Waterfall present integration issues. In agile, despite two decades of research on agile–UX integration (Schön et al., 2023), persistent barriers include resistance to Big Upfront work that limits early research and design (Law and Lárusdóttir, 2015), difficulty incorporating user feedback (Ferreira et al., 2023), weak prioritisation of user needs, poor designer–developer communication (Argumanis et al., 2020; Jones and Thoma, 2019), lack of shared product vision and understaffed UX (Jurca et al., 2014). Waterfall, in turn, fixes requirements early, sidelines later user data and pushes formative evaluation after development (Royce, 1987), which conflicts with the iterative nature of UX that relies on continuous testing, refinement and new insights throughout.

This case study presents how UX is integrated in an R&D cybersecurity project (2022–2025), focusing on facilitating the creation of cyber range scenarios. The expected outcome is an interactive system supporting scenario creation. The project involves three partners: a university (UNI), a centre of excellence (COE) and an industrial partner (IND). UNI's mission is to (1) implement a user-centred development process following the UX Process Reference Model (UXPRM) by Kieffer et al. (2020), (2) design a graphical user interface and (3) model and implement an approach for scenario generation, supervision and guidance. COE implements and integrates the graphical interface, while IND provides the cyber range infrastructure.

The project adopted a hybrid project management approach. WP1 (“Addressing user needs for impactful applied research”) was dedicated to UX and ran iteratively throughout the project, following HCD principles and the UXPRM structure. Insights from WP1 informed priorities, design choices and implementation decisions in all other work packages. However, several development phases—especially within COE and IND – were conducted in a sequential, Waterfall-like manner, fixing requirements early and limiting opportunities for iteration. This hybrid setup shaped UX integration: WP1 ensured continuous user-centred input, while Waterfall phases sometimes constrained the timing and scope of UX-driven changes.

The integration of UX has enabled the achievement of several milestones:

  1. Increased number of UX activities. An expert review of existing cyber ranges was completed three months after project kick-off. This first successful UX activity encouraged non-UX experts to participate, resulting in a higher number of subsequent UX activities.

  2. Established interdisciplinary design team. The team included this paper's 1st and 2nd authors as UX researchers from UNI, plus two researchers from UNI and two from COE specialising in cybersecurity and software engineering. The team collaborated on UX design (e.g. prototyping), evaluation (e.g. user testing) and decision-making (e.g. setting priorities and defining requirements). Non-UX experts attended at least two user testing sessions, using these “meeting points” to coordinate project management and planning.

  3. Increased perceived value of UX. Non-UX experts began to view UX as a transversal asset. The deliberate progression from UX methods without users to UX methods with users strengthened integration and raised the perceived value of UX across partners.

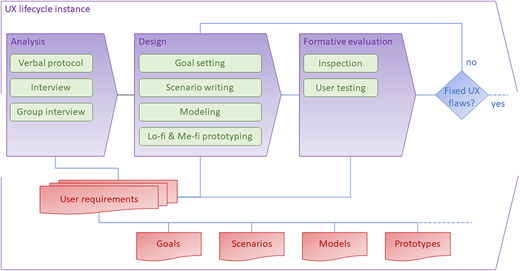
We use the UX process reference model from Kieffer et al. (2020) to define project UX activities. The model distinguishes three primary UX processes – analysis, design and evaluation – and articulates their interrelations within a structured lifecycle. Each process has specific objectives, supported by concrete UX methods and expected outcomes. At the core of this lifecycle sits the specification of user requirements, which serves as the cornerstone of the UX process. The specification consolidates the outcomes of analysis activities (e.g. user needs, contextual insights, user feedback) and steers the design and evaluation of solutions. It plays a critical role in aligning UX efforts with project goals and ensuring continuity across phases. Figure 1 shows the UX methods applied in the project, organised by primary process, along with the UX artefacts that fed into the user requirements specification.

The model fits the project's iterative, incremental development by treating user requirements as a composite artefact that evolves as processes advance. As Figure 1 shows, UX artefacts resulting from the UX primary process directly feed into the user requirements. Specifically, prototypes allow us to document a first version of the user requirements, later refined and completed by other work products (i.e. goals, scenarios, models) as new UX processes took place (e.g. interview or user testing). The resulting specification captures context of use, UX goals, UX design, stakeholder-approved requirements, measurable benchmarks and evidence of usability and UX acceptance, and it directs subsequent development and refinement.

The analysis comprises a verbal protocol and an inspection of the existing system. Verbal protocols serve to make thoughts and cognitive processes explicit during task performance, whereas inspections serve to analyse the learnability and predict the usability or UX problems with systems (Kieffer et al., 2019). A verbal protocol was conducted using the think-aloud technique during a live-demonstration walk-through of the existing system. For the inspection, we used the expert review technique, where two experts evaluated guidelines outlined in Leavitt and Shneiderman (2006) and rated each screen of the system that users interact with to complete a specific task.

Furthermore, data for the intended system were gathered through individual and group interviews. A semi-structured interview collected information on user attitudes and habits through two 1-h sessions, each with 15 questions. Opportunistic group interviews took place as informal discussions during project reviews, designed to gather insights from a selected group of individuals on specific topics.

Using data from the analysis, we set goals and design scenarios, task models, low-fidelity and medium-fidelity prototypes. UX goals are identified and documented to establish specific qualitative and quantitative objectives driving the design. User scenarios and stories are written to illustrate how users achieve their goals with the system and describe software features from the user's perspective. Scenarios are used for user testing, while stories guide developers on what to develop. A task model defines the tasks users should complete in the system, facilitating the design of interactions between cognitive tasks, user tasks and system tasks and grouping tasks into screens. Each member of the design team creates low-fidelity prototypes (sketches) of their design ideas, which are then consolidated on a whiteboard to create a testable mock-up. The consolidated sketches are then turned into an interactive medium-fidelity prototype to capture and illustrate user interactions with the intended system (McCurdy et al., 2006).

The evaluation is strictly formative and consisted of a series of user tests. User tests are conducted individually with users to assess the usability and UX with the system with a sample population. Users complete tasks following specific scenarios to assess system usability and UX. Afterward, users provide feedback through a questionnaire containing seven modules of User Experience Questionnaire+ and the System Usability Scale. Sessions are recorded for observation and semi-structured interviews gather qualitative feedback. Participants sign consent forms prior to data collection to ensure understanding. There are no adverse side effects.

This study adopts an exploratory case study approach due to the limited literature on UX integration in cybersecurity and uncontrollable contextual factors (Baxter et al., 2008; Quintão et al., 2020). Exploratory case studies inherently exhibit qualitative research characteristics such as lack of control over settings, small sample sizes, reliance on narrative data and an absence of intent to statistically generalise findings or demonstrate cause-and-effect (Quintão et al., 2020). Collecting data at multiple occasions and using different methods, including surveys, observations, journaling and interviews, captures both subjective experiences and objective measures and increases reliability (Baxter et al., 2008; Quintão et al., 2020).

We conducted four rounds of data collection using participant observation, survey and interview. The project partners signed a memorandum of understanding, allowing the collection of data among themselves. Survey and interview participants read and signed a consent form prior to data collection. The combination of survey, interview and participant observation enables us to address the research questions through cross-analysis and triangulation of findings. Documenting UX activities at different project stages captures the process, challenges and outcomes, helping us understand how UX can be effectively integrated into cybersecurity projects to support human-centred design (RQ1). The survey's modules on perceived opportunities and barriers (OPP and BAR) for UX integration provide insights into recurring challenges, while interviews allow us to explore these issues in greater depth. Analyzing these responses uncovers specific challenges and opportunities for UX integration in cybersecurity (RQ2).

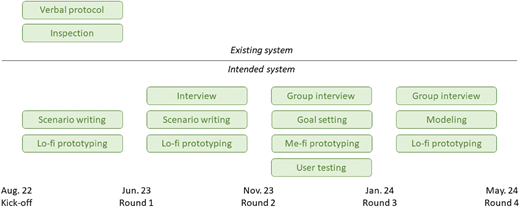
Data collection is structured into four rounds, each aligned with specific project milestones. Round 1 (R1) follows the initial annual project review with the project sponsor. Round 2 (R2) commences after the initiation of direct data collection from users through interviews. Round 3 (R3) occurs post-user testing. Round 4 (R4) follows scientific review during which the project's continuation was decided. Figure 2 shows the articulation of rounds of data collection with the UX activities.

We sample participants from each project partner (i.e. UNI, COE and IND) based on their involvement in UX activities and job roles: researchers, project leaders, product owner and software engineers. Researchers refer to the N = 4 non-UX researchers from the design team involved in UX activities (two from UNI and two from COE). Project leaders (one per project partner), product owner (one from IND) and software engineers (one from COE and two from IND) are not directly involved in UX activities. All participants are male, aged 30 to 65 years, with expertise in software engineering, cybersecurity, or both. Table 1 presents the participant distribution per round and job role for the survey and interview. Participant observation is conducted by researchers from R2 onward during design team events.

R1 involves N = 11 survey participants and N = 6 interview participants evenly distributed per project partner (two from UNI, two from COE and two from IND). In R2, we administer the survey to the N = 4 researchers. In R3, data collection includes survey and interview of the N = 4 researchers. In R4, we survey and interviewed the N = 3 project managers and N = 1 product owner.

Participant observation. We conduct participant observation on the N = 4 non-UX researchers of the design team, two from UNI and two from COE. Data collection includes systematic recording of events in a journal, their categorisation by type (e.g. meetings, workshops) and their detailed documentation with date, attendees, event objectives, descriptive account of proceedings and reflections on outcomes (including decisions, discussions, challenges and advancements). This approach serves to document project activities, offering insights into the implementation of UX methods and their impact on project dynamics. It facilitates a nuanced understanding of participants interactions, decision-making processes and the project's overall evolution.

Survey. We administer the survey proposed by Azevedo et al. (2023). The survey contains six modules and measures respondents' knowledge about UX according to six dimensions, one dimension per module: understanding of HCD (HCD), understanding of UX (UUX), attitude toward users (ATU), awareness of UX ROI (ROI), perceived opportunities (OPP) for and barriers (BAR) to UX integration. Respondents indicate their level of agreement with statements on a 5-point Likert scale to complete the survey, which takes approximately 5 min.

Interview. The interviews address two additional topics related to the survey, namely UX integration and prospects for UX. Questions regarding UX integration include: “How do UX activities integrate into or modify the current software development model?” and “How did the introduction of UX activities affect the way you do your job?”. Questions about prospects for UX explore: “Why would you consider or not consider integrating activities in other projects?” and “What information related to UX would aid your decision-making process?”. Each question aims to gather insights into project partners' perspectives on UX. We conduct and record interviews using an online video conference tool.

Descriptive statistics. Survey responses are first recoded to adjust for reverse-worded items. Descriptive statistics, including means and standard deviations are computed for each participant, UX dimension and round. Finally, participants are compared to identify convergences or divergences in scores across rounds, participant involvement in UX activities or organisation.

Thematic analysis. The interviews undergo thematic analysis in the six steps outlined in Braun and Clarke (2006) (familiarisation, initial coding, searching for themes, reviewing themes, defining and naming themes and reporting). Coding is carried out in a spreadsheet that records participant ID, participant involvement in UX activities, round of data collection, verbatim, subtheme and theme. A second researcher audited the coded corpus. Each sub-theme is counted once per participant per round, regardless of how many times the participant refers to it. Table 2 presents two examples of the thematic analysis coding.

Data triangulation. We use the computed survey scores to group participants showing similar patterns and use the scores as cues to investigate qualitative data. We use participant observation notes to cross-analyse and connect relevant coded interview data and computed scores.

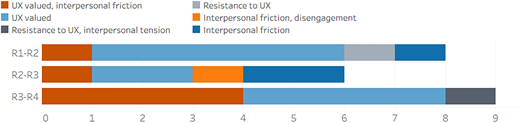
Table 3 presents illustrative field notes. Field notes cover 34 events between September 2023 and July 2024. No eligible events occur before R1. Between R1 and R2, five events were logged (1 workshop, 2 interviews, 1 meeting and 1 other), between R2 and R3, 13 (6 workshops, 4 meetings, 1 interview, 1 review and 1 other) and between R3 and R4, eight (4 workshops and 4 other). Events were coded inductively into four perception labels: UX valued refers to explicit or implicit recognition of UX benefits, resistance refers to verbal or behavioural push-back against UX, disengagement refers to participants' presence without contribution and team friction refers to overt disagreement or affective strain between team members. A single event can carry up to two labels.

Across all events, UX valued appears in 15, resistance in 3 and disengagement in 1. Team friction occurred in 10 events and increased over time. By round, UX valued occurred in 3/5 events between R1 and R2, 7/13 between R2 and R3 and 4/8 between R3 and R4. Interpersonal tension peaked in R3 (6 events) and persisted in R4 (4), mostly between COE and UNI due to differing approaches, goals and missions. Explicit resistance appears once in R3 and once in R4. Figure 3 shows the distribution across rounds.

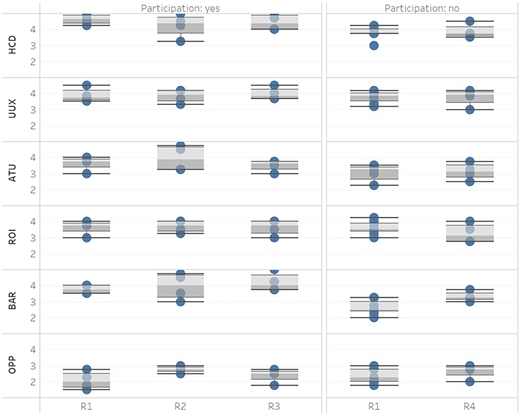
Figure 4 depicts the distribution of knowledge scores per round, UX dimension and involvement in UX activities, while Table 4 presents individual scores per round. Given the small sample, patterns are interpreted descriptively. In R1, participants involved in UX activities (P5–P8) (M = 3.59, SD = 0.70, N = 4) tend to score higher than participants not involved in UX activities (P1–P4, P9–P11) (M = 3.18, SD = 0.86, N = 7). Participants involved in UX activities showed notably higher scores in BAR (+1.11), HCD (+0.85) and ATU (+0.63), similar scores in UUX (+0.14) and ROI (+0.02), but lower scores in OPP (−0.29). In R2, participants involved in UX activities tend to score higher across all UX dimensions except HCD. Scores declined in R3, in some cases falling below R1 levels, with the exception of OPP, which remained higher in R3 than in R1 (+0.19). By contrast, participants not involved in UX activities (P1–P4) in later rounds tend to score notably lower in UUX (−0.19) and ROI (−0.37), but higher in BAR (+0.62) and OPP (+0.37).

The thematic analysis comprises two groups: (1) categories of information participants find useful for decision-making and (2) arguments for and against UX integration.

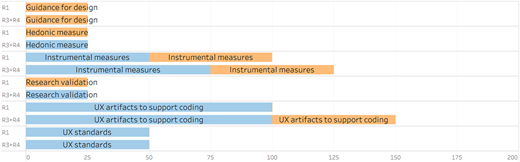
Decision-making. Thematic analysis reveals 7 themes and 21 subthemes that describe information that supports decision-making. The most prevalent theme is instrumental measures (16 occurences) and focuses on objective usability and efficiency metrics, including user feedback (P2, P6), ease of use (P2, P6, P7, P8), click efficiency (P4), ease of learning (P2), usability (P2, P4), usefulness (P2) and avoiding repetitive actions (P2). UX artefacts to support coding (10 occurences) groups deliverables that aid implementation, such as wireframes (P1, P6, P7, P8), user scenarios (P7) and workflow diagrams (P2, P5, P8). UX standards (4 occurences) cover guidance for design consistency, including guidelines or checklists (P7), style guidelines (P7) and good practices (P7). Hedonic measures (2 occurences) address emotional responses, by capturing feelings or emotions (P6) and happiness (P3). UX research validation (2 occurences) covers activities that test whether solutions meet user goals, through verifying user needs (P6) and goal achievement (P4). UX artefacts to support architecture design (2 occurences) lists early-stage deliverables such as data model and requirements (P1). Guidance for design (2 occurences) provides design-decision aids, namely criteria to compare design and methods to design (both P1). Figure 5 shows the distribution of these categories by involvement in UX activities and interview round.

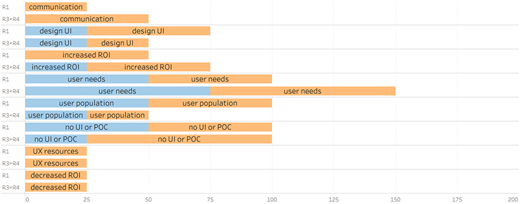
UX integration. Eight themes and 24 subthemes summarise perceived benefits and downsides of integrating UX. The most prevalent, user needs (17 occurrences), addresses alignment with end-user goals: meeting user goals, needs and requirements (P1, P2, P4, P5 and P6), running user tests (P1 and P6), validating requirements before development (P4), ensuring intuitive use (P1 and P4), collecting user requirements (P4) and understanding accessibility needs (P5, P6 and P7). Design UI (6 occurrences) focuses on clear, useable interfaces, including good UI (P1, P4 and P7) and modelling the graphical UI (P1). Increased ROI (6 occurrences) highlights business advantages of UX work: interaction efficiency (P3), easier to sell (P2 and P4), avoiding delays when UX participates (P6) and easier maintenance with fewer iterations and patches (P4). Communication (5 occurrences) highlights stronger stakeholder dialogue: facilitating design discussions (P2 and P4), keeping developers closer to users (P4) and supporting UX–developer communication (P4). No UI or POC (7 occurrences) captures situations where projects present no interface or only a proof-of-concept UI, reflected in the single sub-theme no UI/proof of concept (P1, P3, P4 and P7). User population (5 occurrences) stresses tailoring interfaces for non-technical users, e.g. good UI for non-technical people (P1, P4, P7 and P8). Decreased ROI (3 occurrences) captures concerns about cost or time: development delays (P4), perceived expense (P3) and claims that UX is unnecessary or unevaluated in research contexts (P3). Finally, UX resources (3 occurrences) points to staffing and budget constraints through the sub-themes “no dedicated UX staff” and “not enough resources (budget)” (P3). Figure 6 presents the distribution of argument categories per involvement in UX activities and interview round.

Results are discussed across five themes: participants' UX knowledge, perceptions of UX, UX as a decision-making aid, benefits and downsides of UX integration and UX as common ground. Project partners refers to UNI, COE and IND staff engaged in research and development. Participants denotes the N = 11 study participants; participants involved in UX activities are the N = 4 non-UX researchers from the design team (P5—P8); participants not involved are project leads, product owners and software engineers (P1–P4 and P9–P11).

Participants involved in UX activities tend to score higher and show greater consensus than those not involved, which suggests that participation improves understanding of UX's potential. In R1, non-involved participants tend to keep a project-level focus and prioritise business requirements over user needs, which are “only considered later” (P4, R1). Involved participants tend to adopt a process view and emphasise early UX integration (e.g. “not just at the end” (P6, R1). Large gaps in BAR and OPP align with these profiles; higher HCD and ATU among involved participants reflect proximity to UX staff and users.

Scores for involved participants rise in R2 on ATU, BAR and OPP after first contact with end users, then dip in R3 where testing exposes design gaps and recover by R4. Interviews indicate that user testing recalibrates expectations: expert opinion and internal reasoning do not replace evidence from users. As one participant put it, “some parts of the application are still missing, which we only discovered during user testing” (P5 and R3). Scores for non-involved participants remain stable from R1 to R4 with small changes by dimension; during reviews, they approve progress at each stage, suggesting satisfaction despite limited direct involvement.

Across roles, participants view UX as beneficial and associate good UX with higher system quality. Two trends stand out: UX activities have an impact on participants' mindset and on project management.

A more human-centred mindset. Participants' mindsets become more human-centred in three specific ways: they shift focus from features to user needs, they rely on direct user evidence, and they validate earlier with low-fidelity prototypes. First, early expert inspection redirects attention from features to users, e.g. P4 (R1) stated being more focused on UX, compared to their previous focus on features. Second, direct involvement of users showed that team-approved designs may fail for users. P6 (R3) reported being “mind blown … [when] the user didn't understand the design,” adding that “without understanding user needs, we cannot create a [useable product]”. P5 (R3) noted that missing parts “only [appeared] when testing with users.” Third, early testing with low-fidelity prototypes also changed practice and enabled faster course correction and reduced rework. P7 (R1) argued that the sooner “you can validate with the user … the better,” which supported the decision to pause development until further tests confirmed the new direction.

Project management. Project management became more human-centred in three specific ways: HCD was formalised and UX planned as a continuous, cross-project roadmap; co-creation artefacts (e.g. consolidated wireframes) aligned roles and reduced coding iterations; and early UX integration anchored requirements and prevented misaligned features. First, the project development team implemented UX as a transversal continuous process throughout the project. The project managers planned UX as an ongoing roadmap within the lifecycle (P2, R1), even titling the work package dedicated to project management as “addressing user needs for impactful applied research”. Second, co-creation and agreed design enabled smoother implementation with fewer iterations: “we don't need to iterate a lot […] because we spend time designing and agreeing on the design” and then “I can provide the final wireframe, and developers can build the feature accordingly” (P7, R1). Third, integrating UX early ensured real user needs entered the system and avoided misfit features: “if it's not integrated early, the feature may not be developed [and] doesn't align with user needs” (P6, R3). This approach aligns with Isomursu et al. (2012), which advocates for more collaborative interactions between UX designers and software engineers.

Across rounds, participants mention roughly the same decision aids (Figure 5). Those involved in UX tend to prioritise standards and checklists, and artefacts that support coding, such as wireframes and user scenarios. Those not involved tend to prioritise project-level guidance: design criteria, methods, requirements and data modelling. All participants rely on instrumental measures for decisions. In interviews, non-involved participants focus on features to implement, while involved participants coordinate UX and development and shift emphasis as needed.

Avoiding direct user involvement in analysis, design and evaluation signals low UX maturity. Less mature organisations rely on expert reviews and focus groups. More mature organisations foreground contextual inquiry, observation and user testing, and base design on iterative cycles of prototyping, testing and refinement. Established maturity models and studies consistently associate direct user involvement with higher maturity (Earthy, 1998; Staggers and Rodney, 2012; Venturi et al., 2006; Buis et al., 2023).

Across rounds, participants report more benefits than downsides. They value UX for eliciting user requirements align the design accordingly and for validating them early through user tests. UX is seen as essential for non-technical users and UI work, with limited interest when a project has no UI or remains a proof of concept.

Participants involved in UX focus are more process-oriented, and their focus moves from interface Polish to meeting user needs. They expect fewer late iterations and smoother handovers, and note that wireframes both specify layout for developers and support communication with non-design stakeholders, consistent with Ferreira et al. (2023). They acknowledge a higher short-term workload and possible schedule stretch, yet anticipate less total rework.

Participants not involved are more project-oriented and prioritise ROI, communication and resources. They note that UX “takes time … to make a better interface” (P3, R4) and adds “additional effort” (P01, R4), which can raise costs and delay development. Hence, similar to Bak et al. (2008), resource demands are a challenge to UX integration, as managers weigh immediate effort against longer-term efficiency and economy (Bak et al., 2008). However, participants not involved also cite longer-term gains: higher interaction efficiency, easier marketing and lower maintenance due to fewer patches.

UX artefacts, especially low-fidelity prototypes, act as boundary objects that help communication among partners, particularly those not involved in UX. Consolidated sketches, whiteboards and other outputs are recorded and reused across phases to ensure continuity and knowledge sharing. A participant not involved noted, “Since we do a lot of prototypes, we often ask end users ‘is that what you wanted?”’ (P1, R1/R4), which helped early alignment and facilitated understanding. This role of prototypes as communication aids is well documented (Ferreira et al., 2023).

Workshops enable co-creation: participants reconcile technical constraints with user needs, establish a common language and resolve disagreements by anchoring decisions in user evidence and feasibility. Field notes indicate that workshops served as the primary venue for cross-role decisions on navigation and task flows and for resolving disagreements using user needs and technical feasibility as criteria. Participants involved in workshops set UX goals, recorded decisions and action items and produced shared artefacts (consolidated sketches, whiteboards and low-fidelity prototypes). These observations align with prior work: regular communication and close proximity support UX–development alignment (Jones and Thoma, 2019); explicit UX goals build shared understanding from the user's perspective (Salah et al., 2014); and prototypes materialise ideas, clarify implementation rules and establish a common language (Pillay and Wing, 2019; Ferreira et al., 2023). Such joint practice is essential to UX integration (Isomursu et al., 2012).

Finally, communication spans three pairs: UX–developer, UX–user and developer–user (mediated by shared artefacts). Field notes show that consolidated wireframes let developers implement agreed designs with minimal iteration, that the same artefacts organise dialogue with end users by capturing confirmations and revisions, and that prototypes help non-involved stakeholders track rationale and intended use. This triad is consistent with the role of low-fidelity artefacts as a common language across roles and stages.

Table 5 presents a framework derived from the case study, formalising how UX practices were integrated across four key phases of the cybersecurity project. The framework addresses the need for a lightweight, transferable model by distinguishing between empirical UX activities observed in the project and alternative practices grounded in the UX process reference model (Kieffer et al., 2020). For each phase, it states UX objectives, reports observed outcomes and summarises security impacts.

By capturing how UX activities contributed to security-related decisions – clarifying stakeholder expectations, refining authentication workflows, or reshaping training content – the framework shows the influence of UX beyond usability. It also supports replication by distinguishing between context-specific actions and generalisable practices that may apply to other security-driven development settings.

The framework contributes by: (1) synthesising how to phase, combine and leverage UX practices in cybersecurity to produce effects beyond usability; (2) identifying empirically grounded, theory-informed principles that explain how UX reframes security assumptions, aligns priorities and legitimises design decisions. The novelty lies in the strategic sequencing and formalisation that deliver security-specific outcomes, offering a reusable analytical lens for UX–security integration.

In addition to the analytical framework, a set of practical recommendations facilitates implementation. The framework shows how UX practices influence cybersecurity decisions across project stages; the recommendations translate these insights into guidance for development and management teams.

Recommendations target two stakeholder groups: the development team (researchers, designers, developers and product owners) and the management team (project manager, sponsor and steering committee (ISO 21500, 2021)). The groups are distinguished because they hold different levers and decision horizons: development focuses on design and implementation; management controls prioritisation, staffing, timelines, budgets and risk acceptance. The development team executes UX activities and deliverables; the management team steers strategy, process and resources. Each recommendation specifies actions and, when available, literature support, followed by patterns observed in the data.

Incorporate UX early in the development lifecycle. Involve UX experts from the planning stages to identify user needs early, avoid costly redesigns and guide development (Maguire, 2001; Bias and Mayhew, 2005; Kieffer et al., 2019). Define UX metrics early (e.g. UX goals, usability scores) to align work and evidence ROI (Bias and Mayhew, 2005; Venturi et al., 2006). Integrate UX iteratively so research continuously informs priorities (Maguire, 2001; Bias and Mayhew, 2005; Kieffer et al., 2019).

Observed: Early integration focused solutions on user needs, shifted mindsets towards human-centred choices and made UX goals a reference for design decisions and evaluation.

Start with UX methods without users. Start with methods without users (e.g. expert review) before moving to UX methods with users; this phased start limits disruption in teams new to user involvement and delivers quick, concrete wins (Azevedo et al., 2024). Early results help build confidence, address trust and commitment barriers (Nielsen et al., 2023).

Observed: Initial reluctance to test low-fidelity prototypes stemmed from concerns that their low realism would discredit the work; expert reviews and prototype workshops built confidence in user involvement and enabled user testing.

Foster collaborative workshops. Organise regular UX-led workshops that bring together designers, researchers and developers to align cybersecurity goals and UX requirements, maintain dialogue and build trust in a collaborative environment (Maguire, 2001; Azevedo et al., 2024; Ramelot et al., 2024).

Observed: Workshops served as the primary venue to align perspectives, surface constraints and reach consensus, reducing delays from unresolved disagreements.

Use UX artefacts to bridge the gap between disciplines. Use intuitive, shared artefacts that match existing mental models, supporting collaborative decision-making. Prototypes and user stories aid planning and communication; prototypes clarify ideas and time estimates (Garcia et al., 2017; Kuusinen and Väänänen-Vainio-Mattila, 2012; Ramelot et al., 2024). Teams can collaborate effectively even without identical interpretations of artefacts (Rukonic et al., 2024).

Observed: Collaborative prototyping and use of task or data models helped reconcile technical constraints with user needs and established common ground across roles.

Include development team in continuous user testing. Have developers observe and participate in user tests to see interactions first-hand, understand failures and successes, align priorities with real user needs (Azevedo et al., 2024) and demystify UX (Amant et al., 2024).

Observed: Direct exposure showed that designs acceptable to the team could still fail for end users; involvement increased appreciation of testing with users and the value of their own implemented features.

Clarify what UX entails. Educate stakeholders on UX concepts, methods and terminology to build a positive, accurate view of UX (Azevedo et al., 2023; Amant et al., 2024). Clarify the distinction between UX and graphical UI design to justify early UX activities (Fraser and Plewes, 2015; Azevedo et al., 2023). Present feasible method options and “discount” alternatives to counter perceived cost/time barriers (Bak et al., 2008; Rosenbaum et al., 1999). Demonstrate that users can express needs and inform analysis and evaluation (Ardito et al., 2014).

Observed: Ongoing exposure to UX fostered a more human-centred mindset, increased willingness to run user tests and sharpened the distinction between UX roles and UI design, in both the current and future projects.

Communicate about UX ROI. Explain UX ROI early – ideally before proposal finalisation – to set expectations, plan timelines and reduce resistance (Amant et al., 2024). Link UX to adoption and cost control by preventing rework and recoding; align with security by reducing user errors, encouraging protocol compliance and limiting unsafe workarounds (Gratian et al., 2018).

Observed: Consistent ROI messaging led to a dedicated UX work package (WP1) that shaped decisions across work packages; ROI scores were relatively high from R1 and remained stable and interviews stressed the importance of meeting user needs to deliver meaningful, useable software.

Use UX as a project management tool. Initiate UX reflection before submission and position it as the management framework for a human-centred, iterative lifecycle (Amant et al., 2024). Provide a phased UX process map; adopt a UX process reference model and agile-UX practices; involve UX experts in project management to align goals, staffing and schedules (Kieffer et al., 2019). Allocate time for UX and postpone coding until UX goals are met.

Observed: Treating UX as WP1 anchored subsequent work packages, reduced redesign and delivered a more cohesive product, underscoring UX's role in project success.

Build an interdisciplinary team. Establish an interdisciplinary with UX, ICT and cybersecurity experts to balance user requirements with technical feasibility (Kuusinen and Väänänen-Vainio-Mattila, 2012). Use collaboration to improve internal ROI (communication and integration across work packages) (Ramelot et al., 2024) and external ROI (quality and acceptance) (Amant et al., 2024). Encourage open, reflective dialogue to surface constraints and co-create solutions (Ananjeva et al., 2020; Azevedo et al., 2024) and to promote UX value (Ardito et al., 2014).

Observed: Cross-disciplinary work ruled out infeasible options early, aligned alternatives with user needs and constraints and reduced recoding. For example, user testing gave ICT and cybersecurity experts a clearer view of the context of use and user needs.

Advocate for UX inclusion in project governance. Embed UX in governance structures (roles, responsibilities and policies and decision rights) to align decisions with strategic goals (Müller, 2009; ISO 21500, 2021). Give UX experts standing as trusted advisers on par with project managers (Hinderks et al., 2022; Amant et al., 2024); build trust in people as a path to trust in the discipline (Nielsen et al., 2023). Define UX metrics such as usability scores and user satisfaction indices, for performance tracking, informed decision-making and alignment with project objectives (Atoum, 2023; Trendowicz et al., 2023). Integrate UX into risk management and require UX evidence (validated prototypes, usability results) at stage-gates reviews. While widely advocated in practice (UX Matters, 2010; The Bricks, 2025), these practices merit further academic study to validate and standardise these approaches within governance frameworks.

Observed: The initial proposal was rejected for lacking UX representation; the revised version, with UX in WP1 and an academic UX lead, was approved. Standardised questionnaires and regular usability tests provided quantitative evidence and UX risk management in WP1 supported a Go decision at the intermediate review.

These recommendations echo prior work on UX integration and remain directly relevant to cybersecurity. They go beyond usability to support hedonic qualities. Reducing frustration and building user confidence supports secure behaviour; users who feel ignored, stressed or overwhelmed are more likely to bypass safeguards or adopt risky workarounds. Designing for emotional experience is not optional; it is a prerequisite for secure systems. Even partial adoption can improve UX and strengthen security in complex systems. Table 6 illustrates how each recommendation contributes to reduce security risks and increase resilience.

The following example presents a use case with relevant constraints and user tasks. Consider an internal system for managing physical assets across multiple sites. Some users operate in office environments; others access the system from the field and may be wearing gloves, masks, or protective gear due to weather or hazardous conditions. The system includes authentication (e.g. login, MFA), critical security alerts (e.g. failed access attempts, location mismatches) and procedures for submitting or updating traceable asset information. Terminals may be shared and users are often under time pressure. For example, a user might need to log movement of sensitive materials from location A to B, confirm their identity to enter a restricted location and ensure the update is securely recorded. Another user, responsible for compliance, must rely on the accuracy and traceability of that information.

This exploratory single-case study uses a small, homogeneous, all-male sample drawn from project members and relies mainly on self-reports; behavioural data are limited to meeting field notes. Participant observation by project researchers focuses chiefly on interactions among those involved in UX activities, which can introduce observer and social desirability biases and echo-chamber effects. The grant-funded cybersecurity context with cyber-range scenarios narrows external validity. Findings provide process insight rather than generalisable causal relationships.

However, the project integrates UX from inception as a strategic work package and combines participant observation, surveys and interviews over four rounds across a year, which supports triangulation and improves reliability. The study documents changes in UX knowledge, perceptions and collaboration dynamics in a cybersecurity setting and offers concrete, evidence-based recommendations for development and management teams.

This case study integrates UX from the proposal stage as a dedicated work package in a cybersecurity project centred on a cyber-range interface. UX functions as a backbone and coordination mechanism: it enables consensus on features, balances technical feasibility with user needs and times activities so evidence arrives before key decisions. Progressive integration – initial expert work, then user testing – shifts mindsets toward human-centred choices and clarifies UX return on investment. Wireframes and other artefacts support communication across UX staff, developers, product owners and users. Clear differences emerge between groups. Participants involved in UX activities focus on process and user needs and increase their UX knowledge over time; participants not involved prioritise ROI, communication and resources, with knowledge remaining stable.

The study contributes a methodology and protocol to measure UX knowledge and surface barriers and opportunities to integration, a phase-based framework that formalises UX activities across the project and 10 recommendations for development and management teams linked to cybersecurity risks and benefits. Future work should replicate across multiple cases to test pattern consistency and refine guidance toward a theory of UX integration in cybersecurity.

The authors acknowledge the use of Large Language Models for language refinement. No AI tool or LLMs were used to generate or develop the content of this manuscript.

1.

This article extends a previous HICSS paper by providing a strengthened theoretical background, a mixed-method analysis combining observation, survey and interviews, a formalised framework for UX integration and 10 recommendations. Each recommendation explicitly contrasts project practices with and without UX involvement.
Alsharida
,
R.A.
,
Al-rimy
,
B.A.S.
,
Al-Emran
,
M.
and
Zainal
,
A.
(
2023
), “
A systematic review of multi perspectives on human cybersecurity behavior
”,
Technology in Society
, Vol. 
73
, 102258, doi: .
Amant
,
L.
,
Rukonić
,
L.
and
Kieffer
,
S.
(
2024
), “
Perceived value of UX in organizations: a systematic literature review
”,
International Conference on Human-Computer Interaction
,
Springer
, pp. 
177
-
194
.
Ananjeva
,
A.
,
Persson
,
J.S.
and
Bruun
,
A.
(
2020
), “
Integrating UX work with agile development through user stories: an action research study in a small software company
”,
Journal of Systems and Software
, Vol. 
170
, 110785, doi: .
Ardito
,
C.
,
Buono
,
P.
,
Caivano
,
D.
,
Costabile
,
M.F.
and
Lanzilotti
,
R.
(
2014
), “
Investigating and promoting UX practice in industry: an experimental study
”,
International Journal of Human-Computer Studies
, Vol. 
72
No. 
6
, pp. 
542
-
551
, doi: .
Argumanis
,
D.
,
Moquillaza
,
A.
and
Paz
,
F.
(
2020
), “Challenges in integrating SCRUM and the user-centered design framework: a systematic review”, in
Human-Computer Interaction
, in
Agredo-Delgado
,
V.
,
Ruiz
,
P.H.
and
Villalba-Condori
,
K.O.
(Eds),
Springer International Publishing
:
Cham
, pp. 
52
-
62
. ISBN:
[PubMed]
.
Atoum
,
I.
(
2023
), “
Measurement of key performance indicators of user experience based on software requirements
”,
Science of Computer Programming
, Vol. 
226
, 102929, doi: .
Azevedo
,
D.
,
Ramelot
,
J.
,
Legay
,
A.
and
Kieffer
,
S.
(
2024
), “
With or without U (sers): a journey to integrate UX activities in cybersecurity
”,
International Conference on Human-Computer Interaction
,
Springer
, pp.
212
-
231
.
Azevedo
,
D.
,
Rukonić
,
L.
and
Kieffer
,
S.
(
2023
), “
The gap between UX literacy and UX practices in agile-UX settings: a case study
”,
IFIP Conference on Human-Computer Interaction
,
Springer
, pp. 
436
-
457
.
Bak
,
J.O.
,
Nguyen
,
K.
,
Risgaard
,
P.
and
Stage
,
J.
(
2008
), “
Obstacles to usability evaluation in practice: a survey of software development organizations
”,
Proceedings of the 5th Nordic Conference on Human-Computer Interaction: Building Bridges
, pp.
23
-
32
.
Baxter
,
P.
and
Jack
,
S.
(
2008
), “
Qualitative case study methodology: study design and implementation for novice researchers
”,
Qualitative Report
, Vol. 
13
No. 
4
, pp.
544
-
559
.
Besnard
,
D.
and
Arief
,
B.
(
2004
), “
Computer security impaired by legitimate users
”,
Computers and Security
, Vol. 
23
No. 
3
, pp. 
253
-
264
, doi: .
Bias
,
R.
and
Mayhew
,
D.
(
2005
),
Cost-Justifying Usability
, (2nd ed.) ,
Morgan Kaufmann
,
San Francisco
, p.
660
.
Braun
,
V.
and
Clarke
,
V.
(
2006
), “
Using thematic analysis in psychology
”,
Qualitative Research in Psychology
, Vol. 
3
No. 
2
, pp. 
77
-
101
, doi: .
Bravo-Lillo
,
C.
,
Komanduri
,
S.
,
Cranor
,
L.F.
,
Reeder
,
R.W.
,
Sleeper
,
M.
,
Downs
,
J.
and
Schechter
,
S.
(
2013
), “
Your attention please: designing security-decision UIs to make genuine risks harder to ignore
”,
Proceedings of the Ninth Symposium on Usable Privacy and Security
, pp.
1
-
12
.
Buis
,
E.G.
,
Ashby
,
S.S.
and
Kouwenberg
,
K.K.P.
(
2023
), “
Increasing the UX maturity level of clients: a study of best practices in an agile environment
”,
Information and Software Technology
, Vol. 
154
, 107086, doi: .
Chamberlain
,
S.
,
Sharp
,
H.
and
Maiden
,
N.
(
2006
), “
Towards a framework for integrating agile development and user-centred design
”,
International Conference on Extreme Programming and Agile Processes in Software Engineering
,
Springer
, pp. 
143
-
153
.
Choma
,
J.
,
Guerra
,
E.M.
,
da Silva
,
T.S.
and
Zaina
,
L.M.
(
2022
), “
An approach to explore sequential interactions in cognitive activities of software engineering
”,
Information and Software Technology
, Vol. 
141
,
July 2021
, 106730, doi: .
[PubMed]
.
Chowdhury
,
N.H.
,
Adam
,
M.T.P.
and
Skinner
,
G.
(
2018
), “
The impact of time pressure on human cybersecurity behavior: an integrative framework
”,
2018 26th International Conference on Systems Engineering (ICSEng)
,
IEEE
, pp. 
1
-
10
.
Corradini
,
I.
(
2020
),
Building a Cybersecurity Culture in Organizations
,
Springer
,
Cham
, Vol. 
284
, pp.
63
-
86
.
Cranor, L.F.
(
2008
), “
A framework for reasoning about the human in the loop
”,
UPSec’08, Proceedings of the 1st Conference on Usability, Psychology, and Security
,
USENIX Association, Berkeley
.
De Bruijn
,
H.
and
Janssen
,
M.
(
2017
), “
Building Cybersecurity Awareness: the need for evidence-based framing strategies
”,
Government Information Quarterly
, Vol. 
34
No. 
1
, pp. 
1
-
7
, ISSN:
[PubMed]
, doi: .
Earthy
,
J.
(
1998
), “
Usability maturity model: human centredness scale
”,
INUSE Project deliverable D
, Vol. 
5
, pp. 
1
-
34
.
Ferreira
,
B.
,
Marques
,
S.
,
Kalinowski
,
M.
,
Lopes
,
H.
and
Barbosa
,
S.D.
(
2023
), “
Lessons learned to improve the UX practices in agile projects involving data science and process automation
”,
Information and Software Technology
, Vol. 
155
, 107106, doi: .
Fraser
,
J.
and
Plewes
,
S.
(
2015
), “
Applications of a UX maturity model to influencing HF best practices in technology centric companies–Lessons from Edison
”,
Procedia Manufacturing
, Vol. 
3
, pp. 
626
-
631
, doi: .
Furnell
,
S.
and
Clarke
,
N.
(
2012
), “
Power to the people? The evolving recognition of human aspects of security
”,
Computers and Security
, Vol. 
31
No. 
8
, pp. 
983
-
988
, doi: .
Furnell
,
S.
,
Khern-am-nuai
,
W.
,
Esmael
,
R.
,
Yang
,
W.
and
Li
,
N.
(
2018
), “
Enhancing security behaviour by supporting the user
”,
Computers and Security
, Vol. 
75
, pp. 
1
-
9
, doi: .
Garcia
,
A.
,
Silva da Silva
,
T.
and
Selbach Silveira
,
M.
(
2017
), “
Artifacts for agile user-centered design: a systematic mapping
”,
Proceedings of the 50th Hawaii International Conference on System Sciences
.
Gratian
,
M.
,
Bandi
,
S.
,
Cukier
,
M.
,
Dykstra
,
J.
and
Ginther
,
A.
(
2018
), “
Correlating human traits and cyber security behavior intentions
”,
Computers and Security
, Vol. 
73
, pp. 
345
-
358
, doi: .
Gray
,
C.M.
,
Toombs
,
A.L.
and
Gross
,
S.
(
2015
), “
Flow of competence in UX design practice
”,
Proceedings of the 33rd Annual ACM Conference on Human Factors in Computing Systems
, pp. 
3285
-
3294
.
Hassenzahl
,
M.
(
2018
), “The thing and I: understanding the relationship between user and product”, in
Funology 2: From Usability to Enjoyment
, pp. 
301
-
313
.
Hinderks
,
A.
,
Domínguez Mayo
,
F.J.
,
Thomaschewski
,
J.
and
Escalona
,
M.J.
(
2022
), “
Approaches to manage the user experience process in agile software development: a systematic literature review
”,
Information and Software Technology
, Vol. 
150
, 106957, doi: .
ISO 21500
(
2021
),
Project, Programme and Portfolio Management — Context and Concepts, Standard
,
International Organization for Standardization
,
Geneva, CH
.
ISO 9241-11
(
2018
),
Ergonomics of Human-System Interaction — Part 11: Usability: Definitions and Concepts, Standard
,
International Organization for Standardization
,
Geneva, CH
.
ISO 9241-210
(
2019
),
Ergonomics of Human System Interaction — Part 210: Human-Centred Design for Interactive Systems, Standard
,
International Organization for Standardization
,
Geneva, CH
.
Isomursu
,
M.
,
Sirotkin
,
A.
,
Voltti
,
P.
and
Halonen
,
M.
(
2012
), “
User experience design goes agile in lean transformation–a case study
”,
2012 Agile Conference
,
IEEE
, pp.
1
-
10
.
Jones
,
A.
and
Thoma
,
V.
(
2019
), “
Determinants for successful agile collaboration between UX designers and software developers in a complex organisation
”,
International Journal of Human-Computer Interaction
, Vol. 
35
No. 
20
, pp. 
1914
-
1935
, doi: .
Jurca
,
G.
,
Hellmann
,
T.D.
and
Maurer
,
F.
(
2014
), “
Integrating agile and user-centered design: a systematic mapping and review of evaluation and validation studies of agile-UX
”,
Proceedings - 2014 Agile Conference, AGILE 2014
, pp. 
24
-
32
, ISSN:
[PubMed]
, doi: .
Kashfi
,
P.
,
Nilsson
,
A.
and
Feldt
,
R.
(
2017
), “
Integrating User eXperience practices into software development processes: implications of the UX characteristics
”,
PeerJ Computer Science
, Vol. 
3
, e130, doi: .
Kieffer, S., Rukonić, L., Kervyn de Meerendré, V. and Vanderdonckt, J.
(
2020
), “A process reference model for UX”,
in Cláudio, A.P., Bouatouch, K., Chessa, M., Paljic, A., Kerren, A., Hurter, C., Tremeau, A. and Farinella, G.M. (Eds)
,
Computer Vision, Imaging and Computer Graphics Theory and Applications
,
Springer International Publishing, Cham
, pp.
128
-
152
, ISBN:
[PubMed]
.
Kieffer
,
S.
,
Rukonic
,
L.
,
de Meerendré
,
V.K.
and
Vanderdonckt
,
J.
(
2019
), “
Specification of a UX process reference model towards the strategic planning of UX activities
”,
VISIGRAPP
, Vol. 
2
,
HUCAPP
, pp.
74
-
85
.
Kuusinen
,
K.
and
Väänänen-Vainio-Mattila
,
K.
(
2012
), “
How to make agile UX work more efficient: management and sales perspectives
”,
Proceedings of the 7th Nordic Conference on Human-Computer Interaction: Making Sense Through Design
, pp. 
139
-
148
.
Law
,
E.L.-C.
and
Lárusdóttir
,
M.K.
(
2015
), “
Whose experience do we care about? Analysis of the fitness of scrum and kanban to user experience
”,
International Journal of Human-Computer Interaction
, Vol. 
31
No. 
9
, pp. 
584
-
602
, doi: .
Leavitt
,
M.O.
and
Shneiderman
,
B.
(
2006
),
Research-Based Web Design & Usability Guidelines
,
US DHHS
,
Washington, DC
.
MacDonald
,
C.M.
(
2017
), “
‘It takes a village’: on UX librarianship and building UX capacity in libraries
”,
Journal of Library Administration
, Vol. 
57
No. 
2
, pp. 
194
-
214
, ISBN:
[PubMed]
,
[PubMed]
, doi: .
Maguire
,
M.
(
2001
), “
Methods to support human-centred design
”,
IJHCS
, Vol. 
55
No. 
4
, pp. 
587
-
634
, ISSN:
[PubMed]
, doi: .
Mahlke
,
S.
and
Thüring
,
M.
(
2007
), “
Studying antecedents of emotional experiences in interactive contexts
”,
Proceedings of the SIGCHI Conference on Human Factors in Computing Systems
, pp. 
915
-
918
.
McCurdy
,
M.
,
Connors
,
C.
,
Pyrzak
,
G.
,
Kanefsky
,
B.
and
Vera
,
A.
(
2006
), “
Breaking the fidelity barrier: an examination of our current characterization of prototypes and an example of a mixed-fidelity success
”,
Proceedings of the SIGCHI Conference on Human Factors in Computing Systems
, pp.
1233
-
1242
.
Mortazavi
,
E.
,
Doyon-Poulin
,
P.
,
Imbeau
,
D.
and
Robert
,
J.M.
(
2024
), “
Development and validation of four social scales for the UX evaluation of interactive products
”,
International Journal of Human-Computer Interaction
, Vol. 
40
No. 
20
, pp. 
6608
-
6621
, doi: .
Müller
,
R.
(
2009
),
Project Governance
,
Gower Publishing
,
London
.
Nielsen
,
S.
,
Ordoñez
,
R.
,
Skov
,
M.B.
and
Jochum
,
E.
(
2023
), “
Strategies for strengthening UX competencies and cultivating corporate UX in a large organisation developing robots
”,
Behaviour and Information Technology
, Vol. 
43
No. 
9
, pp. 
1
-
29
, doi: .
Pillay
,
N.
and
Wing
,
J.
(
2019
), “
Agile UX: integrating good UX development practices in Agile
”,
2019 Conference on Information Communications Technology and Society (ICTAS)
,
IEEE
, pp. 
1
-
6
.
Pollini
,
A.
,
Callari
,
T.C.
,
Tedeschi
,
A.
,
Ruscio
,
D.
,
Save
,
L.
,
Chiarugi
,
F.
and
Guerri
,
D.
(
2022
), “
Leveraging human factors in cybersecurity: an integrated methodological approach
”,
Cognition, Technology and Work
, Vol. 
24
No. 
2
, pp. 
371
-
390
, doi: .
Quintão
,
C.
,
Andrade
,
P.
and
Almeida
,
F.
(
2020
), “
How to improve the validity and reliability of a case study approach?
”,
Journal of Interdisciplinary Studies in Education
, Vol. 
9
No. 
2
, pp. 
264
-
275
, doi: .
Rajarathnam
,
S.
and
Singh
,
V.
(
2024
), “
Systematic literature review of cybersecurity and user experience
”,
2024 Cyber Awareness and Research Symposium (CARS)
,
IEEE
, pp. 
1
-
9
.
Ramelot
,
J.
,
Azevedo
,
D.
,
Legay
,
A.
and
Kieffer
,
S.
(
2024
), “
Toward interdisciplinary practice and increased social ROI: a case study on downstream effects of integrating UX in cyber system design
”,
Proceedings of the Annual Hawaii International Conference on System Sciences
, pp.
7365
-
7374
.
Rosenbaum
,
S.
,
Bloomer
,
S.
,
Rinehart
,
D.
,
Rohn
,
J.
,
Dye
,
K.
,
Humburg
,
J.
,
Nielsen
,
J.
and
Wixon
,
D.
(
1999
), “
What makes strategic usability fail? Lessons learned from the field
”,
CHI’99 Extended Abstracts on Human Factors in Computing Systems
, pp.
93
-
94
.
Royce
,
W.W.
(
1987
), “
Managing the development of large software systems: concepts and techniques
”,
Proceedings of the 9th international conference on Software Engineering
, pp. 
328
-
338
.
Rukonic
,
L.
,
Fastrez
,
P.
and
Kieffer
,
S.
(
2024
), “
Social practices of creating and using UX artifacts in agile organizations
”,
Proceedings of the Annual Hawaii International Conference on System Sciences
, pp.
6667
-
6676
.
Salah
,
D.
,
Paige
,
R.F.
and
Cairns
,
P.
(
2014
), “
A systematic literature review for agile development processes and user centred design integration
”,
Proceedings of the 18th International Conference on Evaluation and Assessment in Software Engineering - EASE ’14, No. October 2016
, pp. 
1
-
10
,
eprint: 1304.1186
, ISSN:
[PubMed]
, doi: .
Schön
,
E.-M.
,
da Silva
,
T.S.
,
Hinderks
,
A.
,
Sharp
,
H.
and
Thomaschewski
,
J.
(
2023
),
Introduction to Special Issue on Agile UX: Challenges, Successes and Barriers to Improvement
,
Elsevier
,
Cham
, Vol. 
158
.
Staggers
,
N.
and
Rodney
,
M.
(
2012
), “
Promoting usability in organizations with a new health usability model: implications for nursing informatics
”,
NI 2012 : 11th International Congress on Nursing Informatics
,
June 23-27
, Vol. 
2012
,
American Medical Informatics Association
, Montreal, Canada, p.
396
. PMID:
[PubMed]
.
Stojkovski
,
B.
,
Sandoval
,
I.V.
and
Lenzini
,
G.
(
2019
), “
Detecting misalignments between system security and user perceptions: a preliminary socio-technical analysis of an e2e email encryption system
”,
2019 IEEE European Symposium on Security and Privacy Workshops (EuroS&PW)
,
IEEE
, pp. 
172
-
181
.
The Bricks
(
2025
), “
The stage-gate process: a comprehensive guide
”,
available at:
 https://www.thebricks.com/resources/the-stage-gate-process-a-comprehensive-guide (
accessed
 20 January 2025).
Trendowicz
,
A.
,
Groen
,
E.C.
,
Henningsen
,
J.
,
Siebert
,
J.
,
Bartels
,
N.
,
Storck
,
S.
and
Kuhn
,
T.
(
2023
), “
User experience key performance indicators for industrial IoT systems: a multivocal literature review
”,
Digital Business
, Vol. 
3
No. 
1
, 100057, doi: .
UX Matters
(
2010
), “
Barriers to adoption and how to uncover them
”,
available at:
 https://www.uxmatters.com/mt/archives/2010/11/barriers-to-adoption-and-how-to-uncover-them.php (
accessed
 20 January 2025).
Venturi
,
G.
,
Troost
,
J.
and
Jokela
,
T.I.
(
2006
), “
People, organizations, and processes: an inquiry into the adoption of user-centered design in industry
”,
International Journal of Human-Computer Interaction
, Vol. 
21
No. 
2
, pp. 
219
-
238
, doi: .
Wash
,
R.
(
2010
), “
Folk models of home computer security
”,
Proceedings of the Sixth Symposium on Usable Privacy and Security
, pp. 
1
-
16
.
Wiley
,
A.
,
McCormac
,
A.
and
Calic
,
D.
(
2020
), “
More than the individual: examining the relationship between culture and information security awareness
”,
Computers and Security
, Vol. 
88
, 101640, doi: .
Zimmermann
,
V.
and
Renaud
,
K.
(
2019
), “
Moving from a ‘human-as-problem’ to a ‘human-as-solution’ cybersecurity mindset
”,
International Journal of Human-Computer Studies
, Vol. 
131
, pp. 
169
-
187
, doi: .
Zimmermann
,
V.
,
Schöni
,
L.
,
Schaltegger
,
T.
,
Ambuehl
,
B.
,
Knieps
,
M.
and
Ebert
,
N.
(
2024
), “
Human-Centered cybersecurity revisited: from enemies to partners
”,
Communications of the ACM
, Vol. 
67
No. 
11
, pp. 
72
-
81
, doi: .
Published in Organizational Cybersecurity Journal: Practice, Process and People. Published by Emerald Publishing Limited. This article is published under the Creative Commons Attribution (CC BY 4.0) license. Anyone may reproduce, distribute, translate and create derivative works of this article (for both commercial and non-commercial purposes), subject to full attribution to the original publication and authors. The full terms of this license may be seen at Link to the terms of the CC BY 4.0 licence.

Data & Figures

Figure 1
A UX lifecycle diagram shows analysis, design, and evaluation stages with feedback loops and outputs.The diagram is enclosed within a boundary labeled “UX lifecycle instance” and is arranged from left to right with connected stages, the horizontal lines, and looping lines. On the left, a block labeled “Analysis” contains three vertically stacked items: “Verbal protocol”, “Interview”, and “Group interview”. To the right, a block labeled “Design” contains four vertically stacked items: “Goal setting”, “Scenario writing”, “Modeling”, and “Lo-fi & Me-fi prototyping”. Further right, a block labeled “Formative evaluation” contains two items: “Inspection” and “User testing”. To the right of this, a diamond-shaped node labeled “Fixed UX flaws”? is shown. The word “yes” appears on the right side of the diamond, and “no” appears on the upper side. A connecting line from the “no” side loops back across the top toward the earlier stage “Design”, forming an iterative cycle. The lines extending down from each block and merging into a stacked shape labeled “User requirements”. A horizontal connecting line extends from it toward the right. Along this bottom line, four boxes are arranged from left to right labeled “Goals”, “Scenarios”, “Models”, and “Prototypes”. Vertical connector lines link these boxes upward to the main stages.

UX lifecycle instance inspired by Kieffer et al. (2020). Color scheme: UX primary processes in purple, UX methods in green, UX artifacts in red, milestones in blue

Figure 1
A UX lifecycle diagram shows analysis, design, and evaluation stages with feedback loops and outputs.The diagram is enclosed within a boundary labeled “UX lifecycle instance” and is arranged from left to right with connected stages, the horizontal lines, and looping lines. On the left, a block labeled “Analysis” contains three vertically stacked items: “Verbal protocol”, “Interview”, and “Group interview”. To the right, a block labeled “Design” contains four vertically stacked items: “Goal setting”, “Scenario writing”, “Modeling”, and “Lo-fi & Me-fi prototyping”. Further right, a block labeled “Formative evaluation” contains two items: “Inspection” and “User testing”. To the right of this, a diamond-shaped node labeled “Fixed UX flaws”? is shown. The word “yes” appears on the right side of the diamond, and “no” appears on the upper side. A connecting line from the “no” side loops back across the top toward the earlier stage “Design”, forming an iterative cycle. The lines extending down from each block and merging into a stacked shape labeled “User requirements”. A horizontal connecting line extends from it toward the right. Along this bottom line, four boxes are arranged from left to right labeled “Goals”, “Scenarios”, “Models”, and “Prototypes”. Vertical connector lines link these boxes upward to the main stages.

UX lifecycle instance inspired by Kieffer et al. (2020). Color scheme: UX primary processes in purple, UX methods in green, UX artifacts in red, milestones in blue

Close modal
Figure 2
A timeline presents existing system and intended system activities across four rounds from August 2022 to May 2024.The timeline is divided into two horizontal sections labeled “Existing system” on the top and “Intended system” below, separated by a horizontal line. Activities are shown as rectangular boxes arranged across time from left to right. At the bottom, five time points are labeled: “August 2022 Kick-off”, “June 2023 Round 1”, “November 2023 Round 2”, “January 2024 Round 3”, and “May 2024 Round 4”. Near “August 2022 Kick-off”, two boxes appear in the “Existing system” section: “Verbal protocol” and “Inspection”. In the “Intended system” section: Near “August 2022 Kick-off”, two boxes appear: “Scenario writing” and “Lo-fi prototyping”. Near “June 2023 Round 1”, three boxes appear: “Interview”, “Scenario writing”, and “Lo-fi prototyping”. Near “November 2023 Round 2”, four boxes appear: “Group interview”, “Goal setting”, “Me-fi prototyping”, and “User testing”. Near “January 2024 Round 3”, three boxes appear: “Group interview”, “Modeling”, and “Lo-fi prototyping”.

Articulation of rounds of data collection with the UX activities (UX methods in green)

Figure 2
A timeline presents existing system and intended system activities across four rounds from August 2022 to May 2024.The timeline is divided into two horizontal sections labeled “Existing system” on the top and “Intended system” below, separated by a horizontal line. Activities are shown as rectangular boxes arranged across time from left to right. At the bottom, five time points are labeled: “August 2022 Kick-off”, “June 2023 Round 1”, “November 2023 Round 2”, “January 2024 Round 3”, and “May 2024 Round 4”. Near “August 2022 Kick-off”, two boxes appear in the “Existing system” section: “Verbal protocol” and “Inspection”. In the “Intended system” section: Near “August 2022 Kick-off”, two boxes appear: “Scenario writing” and “Lo-fi prototyping”. Near “June 2023 Round 1”, three boxes appear: “Interview”, “Scenario writing”, and “Lo-fi prototyping”. Near “November 2023 Round 2”, four boxes appear: “Group interview”, “Goal setting”, “Me-fi prototyping”, and “User testing”. Near “January 2024 Round 3”, three boxes appear: “Group interview”, “Modeling”, and “Lo-fi prototyping”.

Articulation of rounds of data collection with the UX activities (UX methods in green)

Close modal
Figure 3
A horizontal bar chart shows UX-related themes across R1 to R2, R2 to R3, and R3 to R4 segments.The horizontal bar chart compares three categories: “R1 to R2”, “R2 to R3”, and “R3 to R4”. The horizontal axis ranges from 0 to 9 in increments of 1 unit. A legend at the top identifies six color-coded segments: dark orange for “UX valued, interpersonal friction”, light blue for “UX valued”, dark gray for “Resistance to UX, interpersonal tension”, light gray for “Resistance to UX”, bright orange for “Interpersonal friction, disengagement”, and dark blue for “Interpersonal friction”. For “R1 to R2”, the bar begins with dark orange from 0 to 1, followed by light blue from 1 to 6, then light gray from 6 to 7, and ends with dark blue from 7 to 8. For “R2 to R3”, the bar starts with dark orange from 0 to 1, followed by light blue from 1 to 3, then bright orange from 3 to 4, and dark blue from 4 to 6. For “R3 to R4”, the bar begins with dark orange from 0 to 4, followed by light blue from 4 to 8, and ends with dark gray from 8 to 9.

Distribution of perceptions across rounds

Figure 3
A horizontal bar chart shows UX-related themes across R1 to R2, R2 to R3, and R3 to R4 segments.The horizontal bar chart compares three categories: “R1 to R2”, “R2 to R3”, and “R3 to R4”. The horizontal axis ranges from 0 to 9 in increments of 1 unit. A legend at the top identifies six color-coded segments: dark orange for “UX valued, interpersonal friction”, light blue for “UX valued”, dark gray for “Resistance to UX, interpersonal tension”, light gray for “Resistance to UX”, bright orange for “Interpersonal friction, disengagement”, and dark blue for “Interpersonal friction”. For “R1 to R2”, the bar begins with dark orange from 0 to 1, followed by light blue from 1 to 6, then light gray from 6 to 7, and ends with dark blue from 7 to 8. For “R2 to R3”, the bar starts with dark orange from 0 to 1, followed by light blue from 1 to 3, then bright orange from 3 to 4, and dark blue from 4 to 6. For “R3 to R4”, the bar begins with dark orange from 0 to 4, followed by light blue from 4 to 8, and ends with dark gray from 8 to 9.

Distribution of perceptions across rounds

Close modal
Figure 4
A set of multiple box plots compares six variables across rounds with participation yes and no.The two-panel layout is divided vertically into “Participation: yes” on the left and “Participation: no” on the right. Six horizontal rows are labeled along the left as “HCD”, “UUX”, “ATU”, “ROI”, “BAR”, and “OPP”. Each row contains gray boxplots with median lines, quartile boxes, whiskers, and overlaid circular data points. Participation: yes In “HCD”, three boxplots labeled “R1”, “R2”, and “R3” are aligned horizontally. The boxes are positioned near the upper range around 4, with whiskers extending slightly above and below, and several points are clustered close to the box, with one lower point near 3 for R2. In “UUX”, three boxplots for “R1”, “R2”, and “R3” are centered between about 3 and 4. The boxes show moderate spread with points distributed both above and below the median line, with R3 slightly higher than R1 and R2. In “ATU”, three boxplots are shown. The R2 box is higher and wider, extending closer to 4.5, while R1 and R3 are lower, centered around 3 to 4 with narrower spreads. Points are scattered around each box with one lower point near 3 in R3. In “ROI”, three boxplots appear around the range of 3 to 4. The boxes are compact with median lines near the center and points clustered close to the boxes, with slight variation among R1, R2, and R3. In “BAR”, three boxplots are displayed. R2 shows a wider vertical spread from about 3 to above 4, while R1 and R3 are narrower and centered slightly below 4. Points are scattered above and below the medians. In “OPP”, three boxplots are positioned lower on the scale, around 2 to 3. The boxes are compact with points clustered near the lower half of the range, with slight variation among R1, R2, and R3. Participation: no In “HCD”, two boxplots labeled “R1” and “R4” are shown. Both are positioned near the upper range around 4, with whiskers extending slightly and points clustered near the box, with one lower point near 3 in R1. In “UUX”, two boxplots are centered between about 3 and 4. The boxes show moderate spread with points distributed above and below the median lines for both R1 and R4. In “ATU”, two boxplots are positioned between about 2.5 and 3.5. The R1 box is slightly lower, while R4 is slightly higher, with points scattered around each box. In “ROI”, two boxplots appear around 3 to 4. The boxes are compact with median lines near the center and points clustered close to the boxes, with R1 slightly higher than R4. In “BAR”, two boxplots are shown lower on the scale compared to the left panel, centered around 2 to 3.5, with points scattered near the whiskers and medians. In “OPP”, two boxplots are positioned around 2 to 3. The boxes are compact, with points clustered near the lower range, showing a similar spread for R1 and R4. Note: All numerical data values are approximated.

Distribution of knowledge scores per round, UX dimension and involvement in UX activities. The “yes” quadrant presents scores in R1, R2 and R3 of participants involved in UX activities. The “no” quadrant presents scores in R1 and R4 of participants not involved in UX activities

Figure 4
A set of multiple box plots compares six variables across rounds with participation yes and no.The two-panel layout is divided vertically into “Participation: yes” on the left and “Participation: no” on the right. Six horizontal rows are labeled along the left as “HCD”, “UUX”, “ATU”, “ROI”, “BAR”, and “OPP”. Each row contains gray boxplots with median lines, quartile boxes, whiskers, and overlaid circular data points. Participation: yes In “HCD”, three boxplots labeled “R1”, “R2”, and “R3” are aligned horizontally. The boxes are positioned near the upper range around 4, with whiskers extending slightly above and below, and several points are clustered close to the box, with one lower point near 3 for R2. In “UUX”, three boxplots for “R1”, “R2”, and “R3” are centered between about 3 and 4. The boxes show moderate spread with points distributed both above and below the median line, with R3 slightly higher than R1 and R2. In “ATU”, three boxplots are shown. The R2 box is higher and wider, extending closer to 4.5, while R1 and R3 are lower, centered around 3 to 4 with narrower spreads. Points are scattered around each box with one lower point near 3 in R3. In “ROI”, three boxplots appear around the range of 3 to 4. The boxes are compact with median lines near the center and points clustered close to the boxes, with slight variation among R1, R2, and R3. In “BAR”, three boxplots are displayed. R2 shows a wider vertical spread from about 3 to above 4, while R1 and R3 are narrower and centered slightly below 4. Points are scattered above and below the medians. In “OPP”, three boxplots are positioned lower on the scale, around 2 to 3. The boxes are compact with points clustered near the lower half of the range, with slight variation among R1, R2, and R3. Participation: no In “HCD”, two boxplots labeled “R1” and “R4” are shown. Both are positioned near the upper range around 4, with whiskers extending slightly and points clustered near the box, with one lower point near 3 in R1. In “UUX”, two boxplots are centered between about 3 and 4. The boxes show moderate spread with points distributed above and below the median lines for both R1 and R4. In “ATU”, two boxplots are positioned between about 2.5 and 3.5. The R1 box is slightly lower, while R4 is slightly higher, with points scattered around each box. In “ROI”, two boxplots appear around 3 to 4. The boxes are compact with median lines near the center and points clustered close to the boxes, with R1 slightly higher than R4. In “BAR”, two boxplots are shown lower on the scale compared to the left panel, centered around 2 to 3.5, with points scattered near the whiskers and medians. In “OPP”, two boxplots are positioned around 2 to 3. The boxes are compact, with points clustered near the lower range, showing a similar spread for R1 and R4. Note: All numerical data values are approximated.

Distribution of knowledge scores per round, UX dimension and involvement in UX activities. The “yes” quadrant presents scores in R1, R2 and R3 of participants involved in UX activities. The “no” quadrant presents scores in R1 and R4 of participants not involved in UX activities

Close modal
Figure 5
A horizontal bar chart compares UX-related categories using color-coded segments.The horizontal bar chart compares two groups labeled “R1” and “R3 plus R4” across multiple categories. The horizontal axis ranges from 0 to 200 in increments of 25 units. Each category appears twice, once for “R1” and once for “R3 plus R4”, with color-coded bars. For “Guidance for design”, both “R1” and “R3 plus R4” show orange bars from 0 to 25. For “Hedonic measure”, “R1” shows an orange bar from 0 to 25, while “R3 plus R4” shows a light blue bar from 0 to 25. For “Instrumental measures”, “R1” shows a light blue bar from 0 to 50, followed by an orange bar from 50 to 100. “R3 plus R4” shows a light blue bar from 0 to 75 followed by an orange bar from 75 to 125. For “Research validation”, “R1” shows an orange bar from 0 to 25, while “R3 plus R4” shows a light blue bar from 0 to 25. For “UX artifacts to support coding”, “R1” shows a light blue bar from 0 to 100. “R3 plus R4” shows a light blue bar from 0 to 100 followed by an orange bar from 100 to 150. For “UX standards”, both “R1” and “R3 plus R4” show light blue bars from 0 to 50. Note: All numerical data values are approximated.

Distribution of information that supports decision-making across arounds. Participants involved in UX activities are in blue, those not involved are in orange

Figure 5
A horizontal bar chart compares UX-related categories using color-coded segments.The horizontal bar chart compares two groups labeled “R1” and “R3 plus R4” across multiple categories. The horizontal axis ranges from 0 to 200 in increments of 25 units. Each category appears twice, once for “R1” and once for “R3 plus R4”, with color-coded bars. For “Guidance for design”, both “R1” and “R3 plus R4” show orange bars from 0 to 25. For “Hedonic measure”, “R1” shows an orange bar from 0 to 25, while “R3 plus R4” shows a light blue bar from 0 to 25. For “Instrumental measures”, “R1” shows a light blue bar from 0 to 50, followed by an orange bar from 50 to 100. “R3 plus R4” shows a light blue bar from 0 to 75 followed by an orange bar from 75 to 125. For “Research validation”, “R1” shows an orange bar from 0 to 25, while “R3 plus R4” shows a light blue bar from 0 to 25. For “UX artifacts to support coding”, “R1” shows a light blue bar from 0 to 100. “R3 plus R4” shows a light blue bar from 0 to 100 followed by an orange bar from 100 to 150. For “UX standards”, both “R1” and “R3 plus R4” show light blue bars from 0 to 50. Note: All numerical data values are approximated.

Distribution of information that supports decision-making across arounds. Participants involved in UX activities are in blue, those not involved are in orange

Close modal
Figure 6
A horizontal bar chart comparing two groups across multiple categories with paired bars.The horizontal bar chart compares two groups labeled “R1” and “R3 plus R4” across multiple categories. The horizontal axis ranges from 0 to 200 in increments of 25 units. Each category appears twice, once for “R1” and once for “R3 plus R4”, with color-coded bars. For “communication”, “R1” shows an orange bar from 0 to 25, while “R3 plus R4” shows an orange bar from 0 to 50. For “design UI”, “R1” shows a light blue bar from 0 to 25 followed by an orange bar from 25 to 75. “R3 plus R4” shows a light blue bar from 0 to 25 followed by an orange bar from 25 to 50. For “increased ROI”, “R1” shows an orange bar from 0 to 50. “R3 plus R4” shows a light blue bar from 0 to 25 followed by an orange bar from 25 to 75. For “user needs”, “R1” shows a light blue bar from 0 to 50, followed by an orange bar from 50 to 100. “R3 plus R4” shows a light blue bar from 0 to 75 followed by an orange bar from 75 to 150. For “user population”, “R1” shows a light blue bar from 0 to 50, followed by an orange bar from 50 to 100. “R3 plus R4” shows a light blue bar from 0 to 25 followed by an orange bar from 25 to 50. For “no UI or POC”, “R1” shows a light blue bar from 0 to 50 followed by an orange bar from 50 to 100. “R 3 plus R 4” shows a light blue bar from 0 to 25 followed by an orange bar from 25 to 100. For “U X resources”, both “R 1” and “R 3 plus R 4” show orange bars from 0 to 25. For “decreased R O I”, both “R 1” and “R 3 plus R 4” show orange bars from 0 to 25. Note: All numerical data values are approximated.

Distribution of perceived downsides and benefits to UX integration across arounds. Participants involved in UX activities are in blue, those not involved are in orange

Figure 6
A horizontal bar chart comparing two groups across multiple categories with paired bars.The horizontal bar chart compares two groups labeled “R1” and “R3 plus R4” across multiple categories. The horizontal axis ranges from 0 to 200 in increments of 25 units. Each category appears twice, once for “R1” and once for “R3 plus R4”, with color-coded bars. For “communication”, “R1” shows an orange bar from 0 to 25, while “R3 plus R4” shows an orange bar from 0 to 50. For “design UI”, “R1” shows a light blue bar from 0 to 25 followed by an orange bar from 25 to 75. “R3 plus R4” shows a light blue bar from 0 to 25 followed by an orange bar from 25 to 50. For “increased ROI”, “R1” shows an orange bar from 0 to 50. “R3 plus R4” shows a light blue bar from 0 to 25 followed by an orange bar from 25 to 75. For “user needs”, “R1” shows a light blue bar from 0 to 50, followed by an orange bar from 50 to 100. “R3 plus R4” shows a light blue bar from 0 to 75 followed by an orange bar from 75 to 150. For “user population”, “R1” shows a light blue bar from 0 to 50, followed by an orange bar from 50 to 100. “R3 plus R4” shows a light blue bar from 0 to 25 followed by an orange bar from 25 to 50. For “no UI or POC”, “R1” shows a light blue bar from 0 to 50 followed by an orange bar from 50 to 100. “R 3 plus R 4” shows a light blue bar from 0 to 25 followed by an orange bar from 25 to 100. For “U X resources”, both “R 1” and “R 3 plus R 4” show orange bars from 0 to 25. For “decreased R O I”, both “R 1” and “R 3 plus R 4” show orange bars from 0 to 25. Note: All numerical data values are approximated.

Distribution of perceived downsides and benefits to UX integration across arounds. Participants involved in UX activities are in blue, those not involved are in orange

Close modal
Table 1

Distribution of participants per round and job roles for survey and interview

Round 1Round 2Round 3Round 4
RoleSurveyInterviewSurveyInterviewSurveyInterviewSurveyInterview
Researchers424444  
Project Managers33    33
Product Owners11    11
Software Engineers3       
Table 2

Example of thematic coding

IDRoundQuoteSubthemeTheme
P1R4A majority of the projects I work on do not involve UIs. Since we do a lot of prototypes, we don't develop the UIs very much, just the minimum so that people understand what we are doingUX not needed for POCno UI/POC only
P7R1I expect UX to provide good practices and say what should be doneguidelines/checklistsUX standards
Table 3

Example of fieldnotes

DatePhaseLabelPurpose and one-line summaryParticipants
11.23DesignTeam frictionIn-person design review. Trainee assessment design validated; trainee n+1 design postponed due to tension between participantsP5–P8
12.23ResearchUX valuedOnline interview with IND trainer to obtain missing contextual data; P5–P8 were actively engagedP5–P8
Table 4

Mean ± standard deviation per participant and per UX dimension for all rounds

IDHCDUUXATUROIBarOPP
Round 1
P13.75 ± 0.433.83 ± 0.373.00 ± 0.713.50 ± 0.872.50 ± 0.872.25 ± 0.43
P24.00 ± 0.714.17 ± 0.693.25 ± 1.304.25 ± 0.432.75 ± 1.791.75 ± 0.83
P33.00 ± 0.713.17 ± 1.072.25 ± 0.433.00 ± 0.712.25 ± 0.433.00 ± 0.71
P44.00 ± 0.004.00 ± 0.003.50 ± 1.503.75 ± 1.093.25 ± 0.832.00 ± 0.00
P54.25 ± 0.433.67 ± 0.943.75 ± 1.303.75 ± 1.094.00 ± 0.712.25 ± 0.83
P64.75 ± 0.433.50 ± 0.964.00 ± 1.733.00 ± 1.224.00 ± 0.711.50 ± 0.50
P75.00 ± 0.004.50 ± 0.503.00 ± 1.004.00 ± 0.713.50 ± 0.871.75 ± 0.43
P84.50 ± 0.503.83 ± 1.343.75 ± 0.833.75 ± 0.433.50 ± 0.872.75 ± 0.43
P94.25 ± 0.433.33 ± 0.753.50 ± 0.504.00 ± 1.223.25 ± 0.432.75 ± 0.43
P103.75 ± 0.434.00 ± 0.003.25 ± 0.833.50 ± 0.872.00 ± 0.002.00 ± 0.00
P113.75 ± 0.833.67 ± 0.472.25 ± 0.433.25 ± 0.832.50 ± 0.502.75 ± 0.43
Round 2
P54.50 ± 0.504.17 ± 0.694.50 ± 0.504.00 ± 0.714.75 ± 0.432.75 ± 1.09
P65.00 ± 0.004.17 ± 0.694.75 ± 0.434.00 ± 1.224.50 ± 0.872.50 ± 1.12
P73.25 ± 0.833.33 ± 0.753.25 ± 0.833.25 ± 0.833.00 ± 0.002.75 ± 0.43
P84.25 ± 0.433.67 ± 0.473.25 ± 0.433.50 ± 0.873.50 ± 0.503.00 ± 0.71
Round 3
P54.00 ± 0.003.67 ± 0.753.50 ± 0.503.50 ± 0.503.75 ± 0.432.75 ± 0.43
P65.00 ± 0.004.50 ± 0.503.75 ± 1.303.00 ± 1.225.00 ± 0.001.75 ± 0.83
P74.00 ± 0.004.00 ± 0.003.00 ± 0.714.00 ± 0.003.75 ± 0.432.50 ± 0.50
P84.75 ± 0.433.67 ± 0.473.75 ± 1.304.00 ± 0.714.25 ± 0.432.50 ± 1.12
Round 4
P13.75 ± 0.433.83 ± 0.693.00 ± 1.003.50 ± 0.873.75 ± 0.432.75 ± 0.43
P23.50 ± 0.874.17 ± 0.373.25 ± 0.832.75 ± 1.303.00 ± 0.003.00 ± 0.00
P33.75 ± 0.433.00 ± 0.822.50 ± 0.502.75 ± 0.433.25 ± 0.432.75 ± 0.83
P44.50 ± 0.504.00 ± 1.003.75 ± 1.644.00 ± 1.223.25 ± 0.832.00 ± 0.00
Table 5

A phase-based framework for integrating UX into cybersecurity projects. The table synthesises how UX activities were deployed across four phases of the project, highlighting both empirical practices and alternative methods grounded in the UX process reference model (Kieffer et al., 2020). Each row addresses a specific dimension of UX integration: activities, transferable alternatives, specific UX objectives, observed outcomes and cybersecurity impacts. The framework formalises how UX influenced security-related decisions and behaviours throughout the project lifecycle

RecognitionAnchoringTranslationOperationalisation
Case study UX activitiesAnalysis: with users (observation, recorded walkthrough) or without users (expert review based on usability guidelines)Specification: UX goals definition; modelling (entity-relationship diagrams, task flows, persona-based scenarios); screen design standardsDesign and Evaluation: prototyping (sketches, wireframes); collaborative design workshops with project team; user testing (think-aloud, scenario-based)Monitoring: reuse of UX artefacts; integration into project practices; adoption monitoring via stakeholder feedback
Alternative UX activitiesAnalysis: with users (contextual inquiry, experience sampling, interviews) or without users (heuristic evaluation or inspection)Specification: user journey mapping; concept mapping; service blueprinting; persona creation; work modelling; storyboardingDesign and Evaluation: video prototyping; coded prototyping; Wizard-of-Oz simulation; remote usability testing; controlled or instrumented experimentsMonitoring: definition of reusable design principles; style guides; automated monitoring of performance and acceptance (log files)
Specific UX objectivesUX makes problems visible and helps reframe initial assumptions; it highlights inconsistencies and latent user needsUX anchors discussion in tangible artefacts; it formalises abstract requirements and enables shared understanding across rolesUX turns user input into actionable guidance; it facilitates multidisciplinary collaboration and supports iterative refinementUX becomes embedded in project reasoning; it supports organisational learning and strengthens the legitimacy of decisions
Observed outcomesUX exposed blind spots in the creation of cyber range scenarios and triggered a reprioritisation of risks and goalsUX artefacts (e.g. models) served as boundary objects that helped align design proposals with security expectationsUX evidence-informed key decisions on authentication flows and control mechanisms; it validated assumptions with the project teamUX contributions were sustained over time; practices were re-used and UX arguments supported the acceptability of security trade-offs
Cybersecurity impactsSecurity blind spots identified early; mismatch between cyber range scenarios and user needs revealed; clearer articulation of stakeholder expectationsDesign priorities aligned across roles; authentication flows clarified through early wireframes; initial security requirements revised through UX artefactsSecurity controls adjusted based on user feedback; authentication and interface workflows refined; cross-team decisions improved; user errors reducedTraining scenarios updated to reflect user workflows; security practices better internalised; increased confidence in UX; long-term reuse of UX practices observed
Table 6

Examples of cybersecurity risks and benefits per recommendation

RecommendationRiskBenefit
For development
Incorporate UX early in the development lifecycleUX issues with security features (e.g. MFA setup) appear late. Fixes either involve a quick patch (with flaws), an expensive redesign, or leave users frustrated and use workaroundsEarly UX input helps design security features that users can handle, avoiding late fixes and risky workarounds
Start with UX methods without usersForcing full UX integration too early may trigger resistance. Security-relevant UX work (e.g. alert placement for shared terminals) may be sidelined or dismissedLightweight methods allow teams to improve secure design (e.g. make alerts legible from field terminals), while gradually introducing UX in environments where user access is limited
Include users before finalising the solutionCritical actions (e.g. MFA recovery, alert response) are misunderstood or ignored, increasing exposure to attacksUser testing reveals if users can follow secure workflows, helping prevent misuse and non-compliance
Foster collaborative workshopsUX and security teams make isolated decisions. File upload rules conflict with workflows, pushing users to bypass the secure systemTeams align technical and user requirements, making secure flows useable and less likely to be bypassed
Support UX artefact reuseInconsistent alerts and file flows confuse users. Security cues are missed, distrusted or ignoredReusing UX artefacts helps consistent design. Users recognise, trust and act on security signals
For management
Clarify what UX entailsUX is confused with interface design. Core security interactions (e.g. confirming asset transfer or responding to alerts) lack feedback, structure, or guidance, leading to errors or omissionsClarifying that UX includes interaction, feedback and error handling helps teams design secure tasks that are understandable, traceable and less prone to risky user behaviour
Communicate about UX ROIUX is seen as optional. Budget is cut for research, so contextual needs (e.g. field constraints) are overlooked. After deployment, key security features are unusable in real environmentsCommunicating UX ROI helps justify early research. Security features (e.g. biometric login, alerting) are adapted to actual use conditions, reducing rework and risk
Use UX as a project management toolTeams miss key context. Secure features (e.g. biometric login) work in testing but fail in real environments where users wear gloves or masksUX activities guide planning with real usage data. Security features align with context, reducing redesigns and security gaps
Advocate for UX inclusion in project governanceUX concerns (e.g. alert visibility, recovery usability) are dropped under time pressure. Critical incidents may go unnoticed or be mishandledGovernance support ensures issues like unreadable alerts on shared terminals or recovery flows for field users are prioritised, even under tight deadlines
Build an interdisciplinary teamSecurity, development and UX are siloed. MFA or incident flows are secure but impractical. Users fail to act securely under stress or time pressureCross-functional teams design mechanisms that are both secure and useable. MFA, alerts and uploads work as integrated, actionable flows, even during crises

Supplements

References

Alsharida
,
R.A.
,
Al-rimy
,
B.A.S.
,
Al-Emran
,
M.
and
Zainal
,
A.
(
2023
), “
A systematic review of multi perspectives on human cybersecurity behavior
”,
Technology in Society
, Vol. 
73
, 102258, doi: .
Amant
,
L.
,
Rukonić
,
L.
and
Kieffer
,
S.
(
2024
), “
Perceived value of UX in organizations: a systematic literature review
”,
International Conference on Human-Computer Interaction
,
Springer
, pp. 
177
-
194
.
Ananjeva
,
A.
,
Persson
,
J.S.
and
Bruun
,
A.
(
2020
), “
Integrating UX work with agile development through user stories: an action research study in a small software company
”,
Journal of Systems and Software
, Vol. 
170
, 110785, doi: .
Ardito
,
C.
,
Buono
,
P.
,
Caivano
,
D.
,
Costabile
,
M.F.
and
Lanzilotti
,
R.
(
2014
), “
Investigating and promoting UX practice in industry: an experimental study
”,
International Journal of Human-Computer Studies
, Vol. 
72
No. 
6
, pp. 
542
-
551
, doi: .
Argumanis
,
D.
,
Moquillaza
,
A.
and
Paz
,
F.
(
2020
), “Challenges in integrating SCRUM and the user-centered design framework: a systematic review”, in
Human-Computer Interaction
, in
Agredo-Delgado
,
V.
,
Ruiz
,
P.H.
and
Villalba-Condori
,
K.O.
(Eds),
Springer International Publishing
:
Cham
, pp. 
52
-
62
. ISBN:
[PubMed]
.
Atoum
,
I.
(
2023
), “
Measurement of key performance indicators of user experience based on software requirements
”,
Science of Computer Programming
, Vol. 
226
, 102929, doi: .
Azevedo
,
D.
,
Ramelot
,
J.
,
Legay
,
A.
and
Kieffer
,
S.
(
2024
), “
With or without U (sers): a journey to integrate UX activities in cybersecurity
”,
International Conference on Human-Computer Interaction
,
Springer
, pp.
212
-
231
.
Azevedo
,
D.
,
Rukonić
,
L.
and
Kieffer
,
S.
(
2023
), “
The gap between UX literacy and UX practices in agile-UX settings: a case study
”,
IFIP Conference on Human-Computer Interaction
,
Springer
, pp. 
436
-
457
.
Bak
,
J.O.
,
Nguyen
,
K.
,
Risgaard
,
P.
and
Stage
,
J.
(
2008
), “
Obstacles to usability evaluation in practice: a survey of software development organizations
”,
Proceedings of the 5th Nordic Conference on Human-Computer Interaction: Building Bridges
, pp.
23
-
32
.
Baxter
,
P.
and
Jack
,
S.
(
2008
), “
Qualitative case study methodology: study design and implementation for novice researchers
”,
Qualitative Report
, Vol. 
13
No. 
4
, pp.
544
-
559
.
Besnard
,
D.
and
Arief
,
B.
(
2004
), “
Computer security impaired by legitimate users
”,
Computers and Security
, Vol. 
23
No. 
3
, pp. 
253
-
264
, doi: .
Bias
,
R.
and
Mayhew
,
D.
(
2005
),
Cost-Justifying Usability
, (2nd ed.) ,
Morgan Kaufmann
,
San Francisco
, p.
660
.
Braun
,
V.
and
Clarke
,
V.
(
2006
), “
Using thematic analysis in psychology
”,
Qualitative Research in Psychology
, Vol. 
3
No. 
2
, pp. 
77
-
101
, doi: .
Bravo-Lillo
,
C.
,
Komanduri
,
S.
,
Cranor
,
L.F.
,
Reeder
,
R.W.
,
Sleeper
,
M.
,
Downs
,
J.
and
Schechter
,
S.
(
2013
), “
Your attention please: designing security-decision UIs to make genuine risks harder to ignore
”,
Proceedings of the Ninth Symposium on Usable Privacy and Security
, pp.
1
-
12
.
Buis
,
E.G.
,
Ashby
,
S.S.
and
Kouwenberg
,
K.K.P.
(
2023
), “
Increasing the UX maturity level of clients: a study of best practices in an agile environment
”,
Information and Software Technology
, Vol. 
154
, 107086, doi: .
Chamberlain
,
S.
,
Sharp
,
H.
and
Maiden
,
N.
(
2006
), “
Towards a framework for integrating agile development and user-centred design
”,
International Conference on Extreme Programming and Agile Processes in Software Engineering
,
Springer
, pp. 
143
-
153
.
Choma
,
J.
,
Guerra
,
E.M.
,
da Silva
,
T.S.
and
Zaina
,
L.M.
(
2022
), “
An approach to explore sequential interactions in cognitive activities of software engineering
”,
Information and Software Technology
, Vol. 
141
,
July 2021
, 106730, doi: .
[PubMed]
.
Chowdhury
,
N.H.
,
Adam
,
M.T.P.
and
Skinner
,
G.
(
2018
), “
The impact of time pressure on human cybersecurity behavior: an integrative framework
”,
2018 26th International Conference on Systems Engineering (ICSEng)
,
IEEE
, pp. 
1
-
10
.
Corradini
,
I.
(
2020
),
Building a Cybersecurity Culture in Organizations
,
Springer
,
Cham
, Vol. 
284
, pp.
63
-
86
.
Cranor, L.F.
(
2008
), “
A framework for reasoning about the human in the loop
”,
UPSec’08, Proceedings of the 1st Conference on Usability, Psychology, and Security
,
USENIX Association, Berkeley
.
De Bruijn
,
H.
and
Janssen
,
M.
(
2017
), “
Building Cybersecurity Awareness: the need for evidence-based framing strategies
”,
Government Information Quarterly
, Vol. 
34
No. 
1
, pp. 
1
-
7
, ISSN:
[PubMed]
, doi: .
Earthy
,
J.
(
1998
), “
Usability maturity model: human centredness scale
”,
INUSE Project deliverable D
, Vol. 
5
, pp. 
1
-
34
.
Ferreira
,
B.
,
Marques
,
S.
,
Kalinowski
,
M.
,
Lopes
,
H.
and
Barbosa
,
S.D.
(
2023
), “
Lessons learned to improve the UX practices in agile projects involving data science and process automation
”,
Information and Software Technology
, Vol. 
155
, 107106, doi: .
Fraser
,
J.
and
Plewes
,
S.
(
2015
), “
Applications of a UX maturity model to influencing HF best practices in technology centric companies–Lessons from Edison
”,
Procedia Manufacturing
, Vol. 
3
, pp. 
626
-
631
, doi: .
Furnell
,
S.
and
Clarke
,
N.
(
2012
), “
Power to the people? The evolving recognition of human aspects of security
”,
Computers and Security
, Vol. 
31
No. 
8
, pp. 
983
-
988
, doi: .
Furnell
,
S.
,
Khern-am-nuai
,
W.
,
Esmael
,
R.
,
Yang
,
W.
and
Li
,
N.
(
2018
), “
Enhancing security behaviour by supporting the user
”,
Computers and Security
, Vol. 
75
, pp. 
1
-
9
, doi: .
Garcia
,
A.
,
Silva da Silva
,
T.
and
Selbach Silveira
,
M.
(
2017
), “
Artifacts for agile user-centered design: a systematic mapping
”,
Proceedings of the 50th Hawaii International Conference on System Sciences
.
Gratian
,
M.
,
Bandi
,
S.
,
Cukier
,
M.
,
Dykstra
,
J.
and
Ginther
,
A.
(
2018
), “
Correlating human traits and cyber security behavior intentions
”,
Computers and Security
, Vol. 
73
, pp. 
345
-
358
, doi: .
Gray
,
C.M.
,
Toombs
,
A.L.
and
Gross
,
S.
(
2015
), “
Flow of competence in UX design practice
”,
Proceedings of the 33rd Annual ACM Conference on Human Factors in Computing Systems
, pp. 
3285
-
3294
.
Hassenzahl
,
M.
(
2018
), “The thing and I: understanding the relationship between user and product”, in
Funology 2: From Usability to Enjoyment
, pp. 
301
-
313
.
Hinderks
,
A.
,
Domínguez Mayo
,
F.J.
,
Thomaschewski
,
J.
and
Escalona
,
M.J.
(
2022
), “
Approaches to manage the user experience process in agile software development: a systematic literature review
”,
Information and Software Technology
, Vol. 
150
, 106957, doi: .
ISO 21500
(
2021
),
Project, Programme and Portfolio Management — Context and Concepts, Standard
,
International Organization for Standardization
,
Geneva, CH
.
ISO 9241-11
(
2018
),
Ergonomics of Human-System Interaction — Part 11: Usability: Definitions and Concepts, Standard
,
International Organization for Standardization
,
Geneva, CH
.
ISO 9241-210
(
2019
),
Ergonomics of Human System Interaction — Part 210: Human-Centred Design for Interactive Systems, Standard
,
International Organization for Standardization
,
Geneva, CH
.
Isomursu
,
M.
,
Sirotkin
,
A.
,
Voltti
,
P.
and
Halonen
,
M.
(
2012
), “
User experience design goes agile in lean transformation–a case study
”,
2012 Agile Conference
,
IEEE
, pp.
1
-
10
.
Jones
,
A.
and
Thoma
,
V.
(
2019
), “
Determinants for successful agile collaboration between UX designers and software developers in a complex organisation
”,
International Journal of Human-Computer Interaction
, Vol. 
35
No. 
20
, pp. 
1914
-
1935
, doi: .
Jurca
,
G.
,
Hellmann
,
T.D.
and
Maurer
,
F.
(
2014
), “
Integrating agile and user-centered design: a systematic mapping and review of evaluation and validation studies of agile-UX
”,
Proceedings - 2014 Agile Conference, AGILE 2014
, pp. 
24
-
32
, ISSN:
[PubMed]
, doi: .
Kashfi
,
P.
,
Nilsson
,
A.
and
Feldt
,
R.
(
2017
), “
Integrating User eXperience practices into software development processes: implications of the UX characteristics
”,
PeerJ Computer Science
, Vol. 
3
, e130, doi: .
Kieffer, S., Rukonić, L., Kervyn de Meerendré, V. and Vanderdonckt, J.
(
2020
), “A process reference model for UX”,
in Cláudio, A.P., Bouatouch, K., Chessa, M., Paljic, A., Kerren, A., Hurter, C., Tremeau, A. and Farinella, G.M. (Eds)
,
Computer Vision, Imaging and Computer Graphics Theory and Applications
,
Springer International Publishing, Cham
, pp.
128
-
152
, ISBN:
[PubMed]
.
Kieffer
,
S.
,
Rukonic
,
L.
,
de Meerendré
,
V.K.
and
Vanderdonckt
,
J.
(
2019
), “
Specification of a UX process reference model towards the strategic planning of UX activities
”,
VISIGRAPP
, Vol. 
2
,
HUCAPP
, pp.
74
-
85
.
Kuusinen
,
K.
and
Väänänen-Vainio-Mattila
,
K.
(
2012
), “
How to make agile UX work more efficient: management and sales perspectives
”,
Proceedings of the 7th Nordic Conference on Human-Computer Interaction: Making Sense Through Design
, pp. 
139
-
148
.
Law
,
E.L.-C.
and
Lárusdóttir
,
M.K.
(
2015
), “
Whose experience do we care about? Analysis of the fitness of scrum and kanban to user experience
”,
International Journal of Human-Computer Interaction
, Vol. 
31
No. 
9
, pp. 
584
-
602
, doi: .
Leavitt
,
M.O.
and
Shneiderman
,
B.
(
2006
),
Research-Based Web Design & Usability Guidelines
,
US DHHS
,
Washington, DC
.
MacDonald
,
C.M.
(
2017
), “
‘It takes a village’: on UX librarianship and building UX capacity in libraries
”,
Journal of Library Administration
, Vol. 
57
No. 
2
, pp. 
194
-
214
, ISBN:
[PubMed]
,
[PubMed]
, doi: .
Maguire
,
M.
(
2001
), “
Methods to support human-centred design
”,
IJHCS
, Vol. 
55
No. 
4
, pp. 
587
-
634
, ISSN:
[PubMed]
, doi: .
Mahlke
,
S.
and
Thüring
,
M.
(
2007
), “
Studying antecedents of emotional experiences in interactive contexts
”,
Proceedings of the SIGCHI Conference on Human Factors in Computing Systems
, pp. 
915
-
918
.
McCurdy
,
M.
,
Connors
,
C.
,
Pyrzak
,
G.
,
Kanefsky
,
B.
and
Vera
,
A.
(
2006
), “
Breaking the fidelity barrier: an examination of our current characterization of prototypes and an example of a mixed-fidelity success
”,
Proceedings of the SIGCHI Conference on Human Factors in Computing Systems
, pp.
1233
-
1242
.
Mortazavi
,
E.
,
Doyon-Poulin
,
P.
,
Imbeau
,
D.
and
Robert
,
J.M.
(
2024
), “
Development and validation of four social scales for the UX evaluation of interactive products
”,
International Journal of Human-Computer Interaction
, Vol. 
40
No. 
20
, pp. 
6608
-
6621
, doi: .
Müller
,
R.
(
2009
),
Project Governance
,
Gower Publishing
,
London
.
Nielsen
,
S.
,
Ordoñez
,
R.
,
Skov
,
M.B.
and
Jochum
,
E.
(
2023
), “
Strategies for strengthening UX competencies and cultivating corporate UX in a large organisation developing robots
”,
Behaviour and Information Technology
, Vol. 
43
No. 
9
, pp. 
1
-
29
, doi: .
Pillay
,
N.
and
Wing
,
J.
(
2019
), “
Agile UX: integrating good UX development practices in Agile
”,
2019 Conference on Information Communications Technology and Society (ICTAS)
,
IEEE
, pp. 
1
-
6
.
Pollini
,
A.
,
Callari
,
T.C.
,
Tedeschi
,
A.
,
Ruscio
,
D.
,
Save
,
L.
,
Chiarugi
,
F.
and
Guerri
,
D.
(
2022
), “
Leveraging human factors in cybersecurity: an integrated methodological approach
”,
Cognition, Technology and Work
, Vol. 
24
No. 
2
, pp. 
371
-
390
, doi: .
Quintão
,
C.
,
Andrade
,
P.
and
Almeida
,
F.
(
2020
), “
How to improve the validity and reliability of a case study approach?
”,
Journal of Interdisciplinary Studies in Education
, Vol. 
9
No. 
2
, pp. 
264
-
275
, doi: .
Rajarathnam
,
S.
and
Singh
,
V.
(
2024
), “
Systematic literature review of cybersecurity and user experience
”,
2024 Cyber Awareness and Research Symposium (CARS)
,
IEEE
, pp. 
1
-
9
.
Ramelot
,
J.
,
Azevedo
,
D.
,
Legay
,
A.
and
Kieffer
,
S.
(
2024
), “
Toward interdisciplinary practice and increased social ROI: a case study on downstream effects of integrating UX in cyber system design
”,
Proceedings of the Annual Hawaii International Conference on System Sciences
, pp.
7365
-
7374
.
Rosenbaum
,
S.
,
Bloomer
,
S.
,
Rinehart
,
D.
,
Rohn
,
J.
,
Dye
,
K.
,
Humburg
,
J.
,
Nielsen
,
J.
and
Wixon
,
D.
(
1999
), “
What makes strategic usability fail? Lessons learned from the field
”,
CHI’99 Extended Abstracts on Human Factors in Computing Systems
, pp.
93
-
94
.
Royce
,
W.W.
(
1987
), “
Managing the development of large software systems: concepts and techniques
”,
Proceedings of the 9th international conference on Software Engineering
, pp. 
328
-
338
.
Rukonic
,
L.
,
Fastrez
,
P.
and
Kieffer
,
S.
(
2024
), “
Social practices of creating and using UX artifacts in agile organizations
”,
Proceedings of the Annual Hawaii International Conference on System Sciences
, pp.
6667
-
6676
.
Salah
,
D.
,
Paige
,
R.F.
and
Cairns
,
P.
(
2014
), “
A systematic literature review for agile development processes and user centred design integration
”,
Proceedings of the 18th International Conference on Evaluation and Assessment in Software Engineering - EASE ’14, No. October 2016
, pp. 
1
-
10
,
eprint: 1304.1186
, ISSN:
[PubMed]
, doi: .
Schön
,
E.-M.
,
da Silva
,
T.S.
,
Hinderks
,
A.
,
Sharp
,
H.
and
Thomaschewski
,
J.
(
2023
),
Introduction to Special Issue on Agile UX: Challenges, Successes and Barriers to Improvement
,
Elsevier
,
Cham
, Vol. 
158
.
Staggers
,
N.
and
Rodney
,
M.
(
2012
), “
Promoting usability in organizations with a new health usability model: implications for nursing informatics
”,
NI 2012 : 11th International Congress on Nursing Informatics
,
June 23-27
, Vol. 
2012
,
American Medical Informatics Association
, Montreal, Canada, p.
396
. PMID:
[PubMed]
.
Stojkovski
,
B.
,
Sandoval
,
I.V.
and
Lenzini
,
G.
(
2019
), “
Detecting misalignments between system security and user perceptions: a preliminary socio-technical analysis of an e2e email encryption system
”,
2019 IEEE European Symposium on Security and Privacy Workshops (EuroS&PW)
,
IEEE
, pp. 
172
-
181
.
The Bricks
(
2025
), “
The stage-gate process: a comprehensive guide
”,
available at:
 https://www.thebricks.com/resources/the-stage-gate-process-a-comprehensive-guide (
accessed
 20 January 2025).
Trendowicz
,
A.
,
Groen
,
E.C.
,
Henningsen
,
J.
,
Siebert
,
J.
,
Bartels
,
N.
,
Storck
,
S.
and
Kuhn
,
T.
(
2023
), “
User experience key performance indicators for industrial IoT systems: a multivocal literature review
”,
Digital Business
, Vol. 
3
No. 
1
, 100057, doi: .
UX Matters
(
2010
), “
Barriers to adoption and how to uncover them
”,
available at:
 https://www.uxmatters.com/mt/archives/2010/11/barriers-to-adoption-and-how-to-uncover-them.php (
accessed
 20 January 2025).
Venturi
,
G.
,
Troost
,
J.
and
Jokela
,
T.I.
(
2006
), “
People, organizations, and processes: an inquiry into the adoption of user-centered design in industry
”,
International Journal of Human-Computer Interaction
, Vol. 
21
No. 
2
, pp. 
219
-
238
, doi: .
Wash
,
R.
(
2010
), “
Folk models of home computer security
”,
Proceedings of the Sixth Symposium on Usable Privacy and Security
, pp. 
1
-
16
.
Wiley
,
A.
,
McCormac
,
A.
and
Calic
,
D.
(
2020
), “
More than the individual: examining the relationship between culture and information security awareness
”,
Computers and Security
, Vol. 
88
, 101640, doi: .
Zimmermann
,
V.
and
Renaud
,
K.
(
2019
), “
Moving from a ‘human-as-problem’ to a ‘human-as-solution’ cybersecurity mindset
”,
International Journal of Human-Computer Studies
, Vol. 
131
, pp. 
169
-
187
, doi: .
Zimmermann
,
V.
,
Schöni
,
L.
,
Schaltegger
,
T.
,
Ambuehl
,
B.
,
Knieps
,
M.
and
Ebert
,
N.
(
2024
), “
Human-Centered cybersecurity revisited: from enemies to partners
”,
Communications of the ACM
, Vol. 
67
No. 
11
, pp. 
72
-
81
, doi: .

Languages

or Create an Account

Close Modal
Close Modal