The purpose of this paper is to investigate the role of distinct types of heating technology and their price impact in German residential real estate markets, considering a wide range of other housing market determinants. The authors aim to test and to verify specifically, whether the obsolescence of heating technology leads to a significant price discount and whether higher technological standards (and environmental friendliness) come with a price premium on the market.
The authors create housing market models for rental and sales segments by constructing generalized additive models with explicit multi-layered spatial components. To elaborate a profound and contemporary answer using these models, the authors perform large-sample regression analyses based on more than 400,000 observations covering German residential properties in 2015.
First and foremost, the heating system indeed shows significant explanatory importance for measuring housing rents and purchasing price. Second, the authors find that it makes a difference whether clean “green” technologies are implemented or whether “brown” systems with obsolete technology or fossil energy sources is on hand. Ultimately, the authors conclude that while low energy consumption indeed comes with a price premium, this needs to be interpreted together with the property’s heating type, as housing markets seem to outweigh the “green premium” by “brown discounts” if low energy consumption figures are powered by a certain type of heating technology system.
Aside of a possible omitted variable bias, the main research limitation is constituted by the integration of asking prices in the analysis, as actual transaction prices are not systematically transparent on national level in Germany. Limitations are discussed at the end of the paper.
This work supports investors who face the challenge of making environmental- and energy-related decisions as well as appraisers who deliver financial fundamentals for such. Third, the paper supports both asset managers as well as investment strategists in argumentation pro-environmental investments beyond all ecological necessity.
This paper contributes to the current discussion on climate change and the eclectic role of real estate in this context. The authors deliver evidence on pricing effects as a measure of socioeconomic acceptance of progressive heating technology and environmental friendliness as an imperative of twenty-first century societies.
This is the first study on “green premiums” or “brown discounts” that includes heating technology as a potential and distinct driver of value and rents. It is a contemporary contribution and delivers original information on the quantitative impact of contemporary and anachronistic technology in heating to researchers as well as investors and appraisers.
1. Introduction
Over the last two decades, research on additional property values and rents, which were generated or empowered by a high standard of green features, has attracted increased research interest. In particular, high energy efficiency or good scores from sustainability certificates were identified as possible drivers of a property’s financial performance (Miller et al., 2008). And indeed, this financial impact is not only limited to a cost-reducing effect regarding operating costs of the property (which would depict a typical benefit on the tenant’s side), but also refers to the net rent as direct income of the owner, which could be increased by energy efficiency measures. Also, in terms of property values or sales prices (a logical continuation of the rental situation), this positive effect on market prices was observed.
In this context, this paper aims to extent evidence on these “green premiums” by:
performing a large-sample hedonic study on German residential real estate, incorporating more than 140,000 contemporary observations from the sales and 260,000 contemporary observations from the rental market;
implementing a logic for the identification of properties in urban centers to eventually account for the specific price situation arising from the lifestyle and image of urban centers in contrast to other areas; and
raising and answering the question, if the additional consideration of the type of heating technology installed in the property leads to a significant result and explanatory improvement of the model, compared to previous approaches.
The study finds itself within a context and history of literature that has aimed to isolate the financial effect of high energy efficiency in the property market. The paper aims at broadening the understanding of a “green” property beyond mere energy efficiency by incorporating types of heating technology and thus, representing a more comprehensive view on residential buildings and their ecological footprint.
2. Literature review
In the context of residential real estate, early contributions on US markets have confirmed a positive impact of energy efficiency and fuel types on property prices. Fundamentally, Halvorsen and Pollakowski (1981) constructed theoretical models and ran empirical analysis that proved how changes in fuel prices significantly impacted house prices eventually. With fuel prices being only one possible determinant of energy costs, Gilmer (1989) made use of nascent energy performance certificates, or specifically a previous system of energy rating systems, by investigating the impact of this market transparency, finding that energy labeling could moderately shorten search efforts and search time necessary to identify appropriate residential properties[1]. The author admits, however, that the impact could have been clearer and stronger in a study that exceeded the barely diverse sample market of Minnesota. Nevin and Watson (1998) confirmed that housing markets incorporate an incremental value to energy-efficient homes, which reflects a present value of annual fuel savings based on an expected capitalization rate of 4 to 10 percent. The study, however, supposes a certain linearity in consumption patterns, while there may be a certain “bottom-line” consumption and probably a ceiling in consumption levels. Also, the connection between fuel savings were not ultimately related to the number of household members, so that smaller households would be suggested to realize capitalization gains, while savings in annual expenditures were not generated technologically. In a study on California homes sold between 2000 and 2009, Hoen et al. (2011) found evidence that the volume of an on-site photovoltaic energy system has positive marginal impact on home sales prices that ranges between $3.90 and $6.40 per installed watt. However, photovoltaic is not an adequate comparable to the approach in this study, as photovoltaic has the main purpose of producing electricity – contrary to, for instance, thermal solar systems that aim at providing heating to homes. For the case of Ireland, Hyland et al. (2013) found evidence that energy efficiency comes with a positive impact on purchasing prices as well as residential rents, whereas the sales market shows a stronger effect. In an extension toward a cross-market analysis, they find that energy ratings play a stronger role and amount higher if the general market conditions are worse. Based on data from the IPD database, Cajias and Piazolo (2013) established a more portfolio-oriented approach for measuring green property price premiums c.p. and isolated that energy-efficient buildings in Germany showed up to €0.76 higher rents per square meter and increased returns of up to 3.15 percent in comparison to energy-inefficient assets. Also, the total return (TR) of the property appeared positively affected by energy efficiency: A 1 percent decrease of energy consumption could be linked to a 0.015 percent increase of the TR, aside of 0.08 percent higher rent prices and 0.45 percent increase in market value. Fuerst et al. (2015) analyzed a data set of over 300,000 housing units that were sold repeatedly between 1995 and 2012. They investigated whether energy performance ratings are reflected in sales prices and indeed found a positive relationship between a dwelling’s energy efficiency rating and its transaction price per square meter. The applied model incorporated property characteristics such as the building type and found that top-rated properties generate a 5 percent premium c.p., and even a “good” standard (rating class C) still generates a 1.8 percent premium in the purchasing price. Performed by Fuerst et al. (2016), a comparable study covering Helsinki delivered a slightly lower energy efficiency premium at approximately 1.3 percent considering several control variables. While green signaling effects could be confirmed, they did not ultimately result in accelerated sales. Cajias et al. (2016) analyzed a data set of 570,000 observations covering the time span between 2013 and 2015 for German residential rental markets. The analysis covered the equipment of the property as well as its overall condition as control variables. As the excessive data scope caused superior computational requirements, sub-samples of top 7 city locations as well as secondary markets were created. For this sub-sample, the effect of energy efficiency turned out to be a lot less clear and more unexpected than in the secondary markets. However, the existence of a green premium for German housing markets could be generally confirmed. Also, Mense (2016) performed analysis in a comparable direction covering German real estate. However, no clear results on the role of local gas prices or regional climate were identified. Especially, different fuel types did not deliver a consistent picture toward price premia from the data set used.
The overall picture of existing research results is also confirmed in the commercial real estate segments; as further evidence in this context, Eichholtz et al. (2010) showed that Energy Star labeled properties, which belong to the top 25 percent of the most energy-efficient buildings, achieve a rent level of 2–3 percent above the level of comparable regular offices. In terms of transaction prices, even higher premiums were observed at 13–16 percent, proving a strong tendency for capitalization of energy savings. Fuerst and McAllister (2011) performed a cross-sectional analysis to identify the effect of energy performance ratings on appraised values, rents and yields of 708 commercial properties in the UK. The hedonic regression model incorporated additional market factors such as the vacancy rate, the unexpired lease term and the tenant’s credit risk in order to isolate the effect of the EPC rating. A significant relationship could, however, not be confirmed for the overall sample, which might be due to the fact that energy efficiency did not yet have the relative importance (i.e. political as well as social awareness in a property context) of today. Newell et al. (2014) compared a portfolio of approximately 200 green office buildings in Australia with a set of non-green properties through hedonic regression in order to identify the effect of better NABERS[2] or GreenStar ratings (both are built environment rating schemes) on office values and rents. In this sample, premiums are most evidently at the top end of the “greenness scale,” although also discounts for poorer energy performance (“brown discount”) are significant.
In addition to the literature discussed before, Table I gives an overview of selected related studies and specifically the variables applied in the underlying models.
As this composition of variables and the overall review of literature reveals, there is a research gap in the field of sustainable real estate research and “green pay-off” studies as the heating technology of the property has not been systematically taken into account nor has it been made the core object of investigation[3]. We intend to close this gap and therefore derive the research question whether the consideration of heating technology standards affects the regression results regarding a potential green premium from energy efficiency and which price impact can be assigned to heating technology and to different levels of technological progressiveness therein.
Why heating technology could matter, too
In German housing markets, the role of energy consumption and costs and its financial handling is diverse: on the residential sales market, of course, owner-occupiers bear operating costs – including heating costs – themselves. Looking at rental housing, two general contractual constellations are possible: in one scenario, a gross rent is agreed on; thereby, the tenant pays a flat fee and all operating costs are covered. In this scenario, energy savings are completely collected by the investing landlord. However, this scenario is a (significant) minority, as most landlords spare the risk of paying for unreasonable energy consumption by the tenants or the risk of price increases in operating expenses over time. The more common scenario is that tenants perform monthly advance payments, which are then accounted for once a year. Excess costs are then paid for by the tenant, while excess funds are then paid out to the tenant. This comes with an inherent incentive to save energy for the tenant. At the same time, energy efficiency improvements – usually paid for by the investing landlord – benefit the tenant by reduced operating costs. In order to solve this split-incentive problem, German legislation has introduced regulations that enable the recovery of investment costs toward energy efficiency, thereby increasing the net rent paid by the tenant (“legal green premium”). The question arises, whether the reimbursement of these investments is actually and empirically visible in both net rents as well as purchasing prices, eventually.
Most of the studies discussed before refer to similar market constellations and mainly incorporated fundamental property characteristics and energy consumption data as explanatory variables for an estimation of the respective “green premium.” However, underlying data sets typically do not allocate information on the respective type of heating technology. Yet, this aspect may be of specific interest in property transactions both on the sales as well as the rental market for several reasons: conventional or fossil heating technology may come with a negative outlook for future demand and sustainability. This is in particular observable by the fact that, although the consumption horizon for oil or gas reserves may be determined by decades, already today several nations have declared their intention to become a lot more independent of these energy sources[4]. Germany and its energy shift concept (“Energiewende”) is one of these countries. Second, energy consumption levels alone are a very condensed perspective on sustainability, as this variable does not appreciate the fact that sustainability may arise in the building envelope or the heating system separately. In addition, using energy consumption information from energy performance certificates does not necessarily ensure comparability between properties, as user/tenant behavior may impact these levels in residential certificates. In addition, “green” heating technology features a shorter learning curve in terms of technological development and application compared to fossil heating technology, which already had decades of time to evolve. This leads to a situation where deciding in favor of modern technologies in a property typically comes with higher investment costs for the owner compared to a conventional, fossil heating system. At the time of sale, it should be expected that the owner tries to recover these higher investment costs from a potential buyer or a tenant over time. And ultimately, the concept of social responsibility has received high recognition and currentness, not least because of public pressure from the Paris climate agreement and international ambitions to conserve resources for the next generations. Renewable energy sources and low-emission heating may, therefore, thoroughly create financial benefits on property markets. Existing evidence has already suggested an altering demand-side behavior on housing markets. However, the role of “green” or obsolescent heating technology appears still under-researched in this context.
Therefore, our study is based on an individually adjusted data set that compiles the commercial information and the property characteristics with a variable on the urban vs rural land use pattern of the micro location as well as the type of heating technology that is implemented in the property.
As consequence of the considerations before, we formulate the hypothesis that aside of higher housing prices from low energy consumption there is also a difference in the price structure considering the obsolescence of certain heating technology, especially fossil heating systems (which we expect to quote at a “brown discount”). We also expect that promoting the global efforts for sustainability comes with financial benefits (“green price premium” for properties that are fueled by “green” heating technology). In the following section, we will analyze what is actually reflected in the market prices.
3. Empirical analysis
Methodology
In order to receive respective evidence, we construct a multivariate regression model to isolate and to control for the effect of several driving impact factors on asking prices of landlords and sellers. The model is set up as a generalized additive model (GAM), as we assume that the market-related behavior patterns may not always be of pure linear nature and GAM can reflect this non-linearity. Our GAMs follow the fundamental form:
where errors ε are independent of Xj, E(ε)=0 and Var(ε)=σ2 and fj describes univariate smooth functions, one for each variable included, in order to account for possible non-linearity.
We incorporate property rent or property value as Y and functions of several (financial and technical) property characteristics as well as geographic and geo-based information as explaining variables. Therefore, we estimate:
where c0 is the intercept, fi depicts functions to reflect non-linearity, ∂ depicts linear or dummy variable, log(floorspace) is floor space in square meters (logarithmic),numberofstories the number of floors in the building, constructionyear the year of construction, energyconsumption the final energy consumption in kWh per square meter and year, numberofrooms the total number of rooms, x_y_coordinates the x,y coordinates of the property location, balcony the whether the property has a balcony, listed_building the whether the property is a listed building and therefore of historic substance,heatingtype_class the class of the heating system type (green/standard mix/brown),quality_of_equipment the standard of property fit-out, urban_center the whether the property is located in an area that is subject to centrally urban use per the CORINE logic,propertytype the type of the property (house vs apartment), and federal_state the applicable from 16 federal states in Germany.
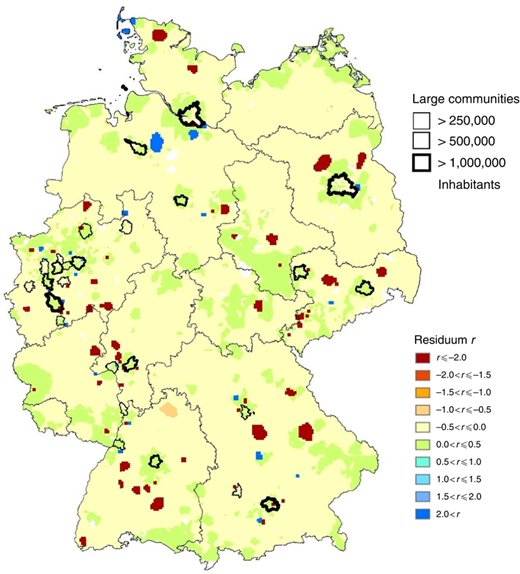
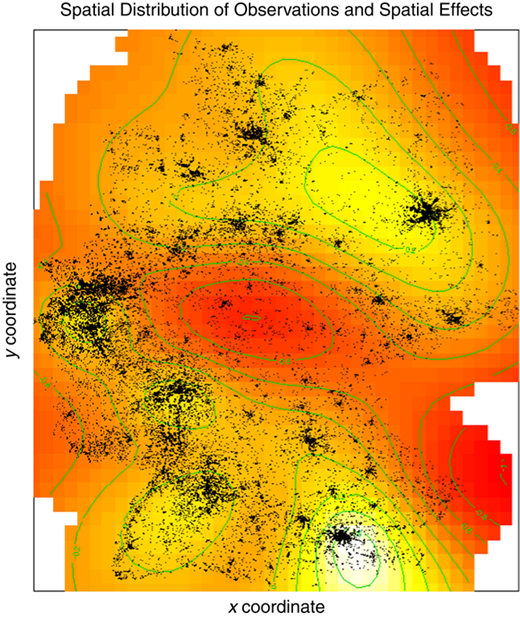
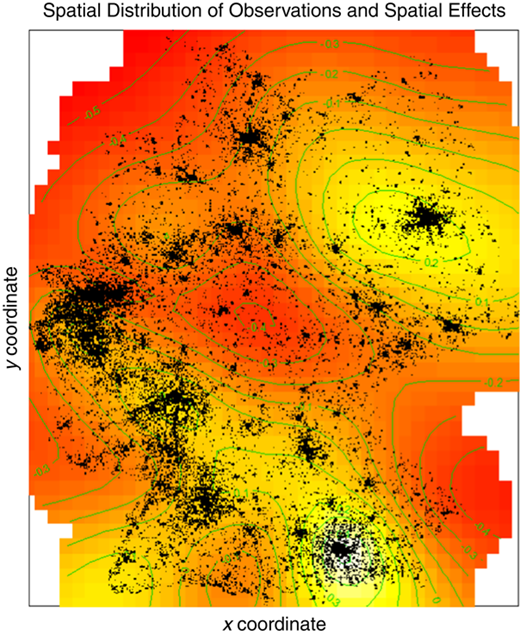
In addition to performing the estimates, we analyze the data for several statistical phenomena that might be expected given the scope and extent of the data as well as its timeline. This analysis comprises, but is not limited to, questions of spatial autocorrelation and heteroscedasticity of error terms. And while the data shows the expected variations in statistical dispersion, we found that spatial autocorrelation is very limited and does not happen systematically across the whole sample. Most importantly, we can confirm that spatial autocorrelation specifically not occurred excessively in the big city regions of Germany and also the majority of the rest of the country did not show exaggerations in similarities between nearby observations (Figure 1).
Data
In our estimates, we included residential properties (apartments and houses) in the Federal Republic of Germany, which were advertised for lease or sale in 2015 on the web platform Immobilienscout24. The total underlying data basis for that year comprises 3.2m observations. However, only a small share of these did actually provide information on the energy consumption as well as all other variables required by the model. Therefore, the total sample eventually comprised 408,000 observations.
The observations comprised financial information (rent or sales prices), property characteristics – including the heating type installed – and location information. Descriptive statistics of all explanatory variables included are listed in Tables II and III.
We performed data optimization in terms of excluding several implausible entries from the total data stock, according to a set of clear rules and patterns. This optimization was necessary in order to account for the fact that the information provided was put in by the users themselves and due to these free-hand inputs, respective values may have been entered mistakenly[5]. In addition to the raw information provided, we also enriched the given data set in terms of location and land use. Specifically, we added urban_center as a control variable to isolate price differences between locations with specific “urban usage” and other areas. While the pure distinction between rural areas and urban area is already contained in the x-/y-coordinates included, the urban usage identifies urban central districts, which enables the analysis of average price premia for the specific status of residing in an urban center in general, independent of cardinal directions. For the identification of these urban centers amongst the given data, we allocate spatial information to each data line using information from CORINE Land Cover, an EU-initiated project on gathering land use information. This brings the advantage that the study can reflect non-radial CBD patterns and do not have to approximate the urban land use by price information or other indirect information. As the analysis is performed on the basis of square meter rents and prices, the joint integration of houses and apartments comes with the advantage of direct comparability in terms of the price impact from the two major types of housing on the market.
And ultimately, we created three baskets amongst all properties to distinguish the type of heating system used. The first group depicts the benchmark group containing those properties where no distinct information on specifically good or bad quality of the heating ecology was given. This group comprises properties, where houses and apartments were advertised to feature heating fueled with a standard or rather unspecific fuel mix. We regard this group as the reference group in order to isolate the market reaction pattern toward properties that feature more specific information. These properties are organized in the two other baskets, where those properties subsumed that are advertised with highly green heating features (e.g. pellet heating or thermal solar systems) and, therefore, explicitly apply “green technology” or advertised to contain fossil or even obsolete heating systems (such as coal or oil heating) and are, therefore, considered to apply obsolescent technology. Through this segmentation, we will be able to answer which effect can be associated with the explicit offering of “green” or “brown” heating technology. The segmentation is summarized in Table IV.
Results
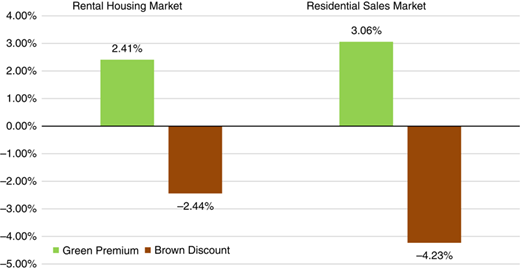
Our study finds that properties that were specifically advertised as including “brown” heating technology were offered for sale at a discount of approximately 4.23 percent c.p. in comparison to those properties that were offered with heating technology that depends on the regional standard energy mix. In the rental market, this brown discount quotes lower at – 2.44 percent c.p.
Contrary to that, properties with “green” heating technology were offered at an attributable sales price premium of 3.06 percent c.p. in comparison to housing that was offered without specific “green” or “brown” heating technology. In rental housing markets, this “green premium” amounts to 2.42 percent c.p. These figures are found to be highly significant at 0.1 percent level (Figure 2, Table V)[6].
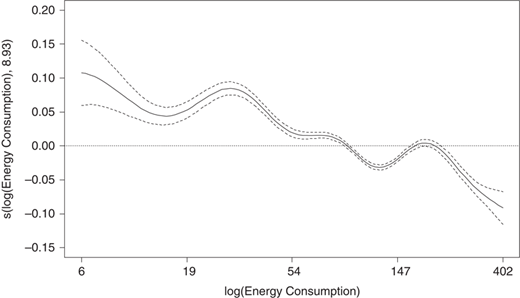
In terms of general energy efficiency and energy consumption levels, this study is in line with existing evidence and confirms the existence of “green premiums” from low energy consumption figures. Spline illustration given in Figure 3 shows the structural sales price pattern that can be attributed to the energy consumption level of the properties.
This pattern is significant at a 0.1 percent level and illustrates how lowest energy consumption figures of less than 30 kWh per square meter and year come with a sales price premium of 5–10 percent compared to the baseline of energy efficiency class C at between 75 and 100 kWh per square meter and year or lower. Simultaneously, extremely high energy consumption figures c.p. show a price discount of up to 10 percent. We find that the market reaction in that sense appears very reasonable and rational investors do on average increase prices due to good energetic characteristics.
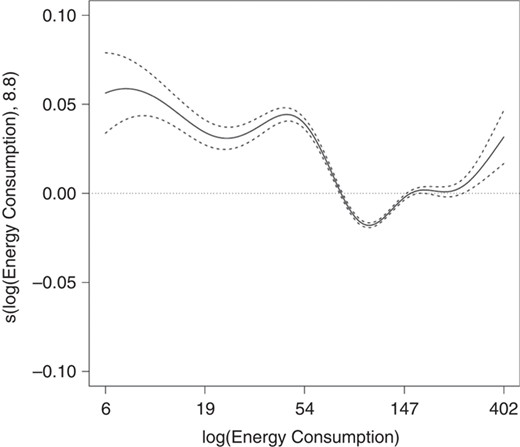
In that sense, the market seems to price in a superior energetic performance of a property. Something similar seems true for the rental market, as illustrated in the following graph, however, the sales market’s strict depreciation for poor energy efficiency cannot consistently be confirmed for the rental perspective. Apart from that, appreciation patterns for good energy efficiency are quite comparable to the insights gathered from sales markets (Figure 4).
Generally, the results of this study show higher “green premiums” in sales markets than in rental markets. Also, the general level of sales price premiums appears higher than in comparable previous studies. But clearly, the confidence and distribution of the premium estimates show that the premium range increases especially in terms of buildings with extremely low consumption levels. Higher confidence, however, is observed in terms of “brown discount” estimations regarding buildings with rather high energy consumption levels.
In addition to the energy- and technology-related aspects, we gather additional general insights into German housing markets from the integrated control variables that characterize the market structure by means of additional determinants.
Regional differences in the price structure are both controlled by the specific geographic micro location (given as x and y coordinates) as well as by assigning the respective state-level perspective as the macro market environment. While the macro environment accounts for effects that show common framework conditions (such as economic attractiveness on state-level, the North-South/Eastern-Western divide or the land transfer tax, which differs between the states), the consideration of micro location reveals regional price differences in connection to local differences on a very local scale of a few kilometers. Figures 5 and 6 show the spatial distribution of observations within this study on German housing markets as well as a heat map of the spatial effects in terms of sales prices.
Regarding the state-level alignment, the following regional differences as impact of the macro location could be observed (Table VI).
The general picture regarding the state-level variation of property prices seems coherent with other sources, e.g. sociodemographic and property data from the Federal Statistical Office (2018), including official housing statistics, with Southern states as well as single-city states (including Berlin) showing higher price levels than, for instance, the Eastern states of the former socialist republic. However, in terms of the quantification of price differences, these sources may show different figures. The reason for that is that official statistics typically evaluate the blank price differences without controlling for the full range of price-building determinants. The residual for the impact of the respective state in this paper is, therefore, generally lower than in other publications.
We find a sales price premium for housing in urban areas of 16.99 percent c.p. and a rental price premium of 9.51 percent c.p., both statistically significant at 0.1 percent level. Compared to houses, apartments are typically offered at a lower price per square meter with a statistically significant (***) difference of 10.14 percent on sales and 10.75 percent on rental markets. The building type-related price differences from sales markets are, therefore, very simultaneously reflected in rental markets. Properties that feature a balcony are offered at a 9.87 percent c.p. sales price premium (4.80 percent c.p. in rental markets) and listed properties show a sales price premium of 17.86 percent (rents: 5.64 percent) c.p. The price structure arising from the quality of housing equipment is shown in Table VII.
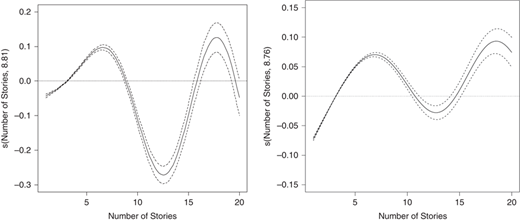
All non-linear constituents the model (reflected by thin-plate spline functions with a number of knots automatically adjusted to the respective scale on the software side, as shown in the following graphs) of are highly significant at <0.1 percent level (***).
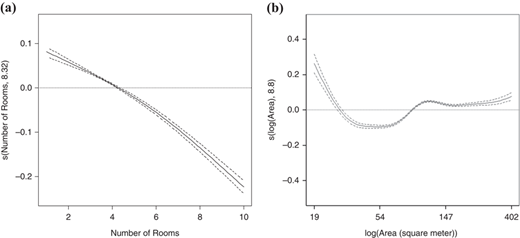
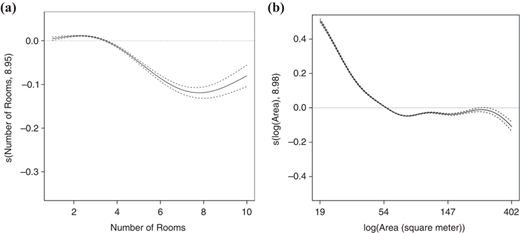
We find that properties of up to five rooms generate price premiums, while properties with six or more rooms in contrast deliver price discounts of up to 20 percent across building typologies. We review this information in the light of additional insights on the living area. For that variable, the study complementarily confirms higher prices for smaller living areas (as typical, for instance, in student housing, shared apartments or micro housing) as well as for very large living areas of more than 100 square meters. At around 50 square meters, housing generates lowest sales prices, as shown in Figures 7 and 8.
In terms of rooms and living area, rental markets draw similar patterns, although especially the impact of number of rooms happens on a smaller scale for small housing than on sales markets. In terms of area sizes, the appreciation for extensively large property cannot be observed on rental markets, although it is indeed confirmed on sales markets. However, this may also be caused by the sale of multi-family houses, which are frequently traded as investment objects and, therefore, may realize price premiums.
The following spline delivers a characteristic price pattern regarding the number of stories of the building. Houses with a higher number of stories come with higher prices, however, there is an illustrative gap between 8 and 15 stories – which is a typical height for a certain property type, known for lower quality and mass housing as “plattenbau” in both German and English language. This clear gap can only be observed for sales markets: while rental markets do also show lower prices for living space in houses with 10 to 15 stories, the amplitude is significantly smaller. Houses of more than 15 stories come with a price premium in both sales and rental markets, again, which may be rather traded as locations for higher-price luxury penthouse apartments. However, these premiums are subject to higher uncertainty in estimates, as shown in Figure 9.
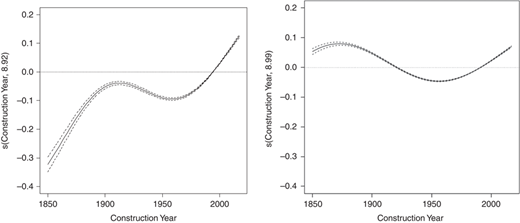
Also in terms of the building age (construction year), very characteristic patterns could be observed. It is illustrated in the spline shown in Figure 10.
While new buildings generate significantly higher sales prices, also due to higher property quality and specifically increased building costs, broad differences are observed in existing buildings. Especially a war and post-war gap of quality housing is observable, c.p. showing lower prices. Art Noveau buildings between 1900 and 1920, however, show lower discounts and are actually more expensive than properties from the 1940s–1970s. Interestingly, rental prices are tremendously smoother in terms of the construction year impact with effects between +10 and –5 percent in the time span between 1850 and 2000.
4. Conclusion and discussion
Our study finds that:
Housing markets incorporate progressive “green” heating technology in pricing considerations and higher sales prices are demanded, if those technologies are on hand. This “green premium” amounts to roughly 3 percent c.p.
Also, a “brown discount” is equally evident. This refers to those properties that explicitly advertise conventional heating technologies which are subject to technical obsolescence in the long term. The “brown discount” amounts to approximately 4.2 percent c.p.
The same pattern can be confirmed for rental housing markets. Here, we observe a heating technology-driven “green premium” of 2.4 percent c.p. on average and a “brown discount” of approximately the same magnitude. We conclude that rental markets react smoother towards heating technology features than the investment and purchasing side.
There is a premium in sales prices of residential properties, which feature low energy consumption levels. The same is true for rental markets. In that sense, also general energy efficiency seems to “pay off.”
Bringing both dimensions together, however, we see that low energy consumption levels alone seem to be only the necessary condition, but not the sufficient condition for generating sales or rent price premia in housing markets. The question, which heating technology is causing the low consumption levels, appears at least equally important.
Going beyond the specific research question raised, this study features more general insights and evidence on German housing markets from a large data sample. Selected aspects cover regional differences between Northern and Southern or rather Eastern and Western Germany. Also, quality of equipment or listed properties seems to cause highly significant results.
While specific limitations of the analysis are outlined at the end of this work, it appears expedient to contrast the findings in the light of existing findings from previous studies. Unfortunately, there is not a great quantity of comparable research with similar focus on heating technology and its impact on pricing in residential markets. The incorporation of technological aspects was limited to photovoltaic in related literature as reviewed in this paper. While Hoen et al. (2011) conclude that the property price premium they identified should be explained by reduced utility bills from using photovoltaic technologies, this study and its results suggest that additional factors such as market development, market regulation as well as behavioral aspects may cause the price structure from different levels of technological progressiveness in heating.
In addition, there is a comprehensive body of existing literature with a majority of results directing to a “green premium” of energy-efficiency features, which we analyzed by energy consumption levels as control variables and which we can confirm, also. In this context, the identified amount of the price premium is comparable to previous findings, while this study additionally accounts for the specific non-linearity of price patterns. Peak and floor values of the premium and discount, however, seems in line with other studies such as Fuerst and McAllister (2011), Cajias and Piazolo (2013) or Fuerst et al. (2015).
In terms of the general discussion on housing and its role for climate change, energy efficiency or retrofitting, this paper aims to contribute one further input. Looking at the core question of the study (being the price impact of heating technology) and its innovation specifically, it becomes obvious that a differentiation between building-related and system-related measures should be made when estimating prices in residential real estate. This is of particular importance, as a lot of renovation activity is not performed holistically, but rather focusing on only either building-related measures such as insulation or system-related measures such as replacing a boiler in the home. However, both effects may be adverse, as this study has shown: we found that properties with generally good energy efficiency (e.g. due to sealed building envelopes) may still experience a brown discount if the heating system integrated does not reflect an equally good standard.
Moving forward, the results delivered may advise real estate decision making in several ways: first, they might be suitable to develop an addition to existing theory on “green premiums” and “brown discounts” by bringing forward the argument that building renovation should be performed in its entirety by rather suggesting a price premium for performing single components of a renovation package. Second, the results should encourage policy makers to start or to continue promoting building renovation in a connected view in order to avoid the above-mentioned one-dimensionality of renovation: consequently, public funds should be assigned to both building- as well as system-related measures and to encourage both an improvement of building substance as well as technical property equipment, as the latter is the driving consumer of energy in the operation of properties. And ultimately, the results may advise appraisers and investment practitioners to identify price determinants on a more detailed level, as the effects may be adverse and the expected “green premiums” may be unachievable by the investment due to only partial measures performed.
Further research
To gather further insights into the field of this study and to expand related existing research on the market reaction patterns and behavior of the housing market, we suggest to perform analysis covering a longer time span. This should provide further evidence on how the effect of energy efficiency and the heating type develops over time. We might expect that the amounts of “green premium” and “brown discount” deviate between years. Also, changes in energy standards may bias the role of energy efficiency throughout the years (low-energy buildings may lose their deluxe appearance in the market over time, given increasing technological standards and regulation). In addition, we suggest to contrast the identified premium and discount to the differences in production and installation costs of respective “new” or “old” technology. Also, adding a distinction between consumption-driven energy performance certificates and demand-driven energy performance certificates might refine the results on the general green premium from energy efficiency: with that approach, a difference could be made between ordinary baseline heating demand from the property and possibly additional energy consumption caused by the occupant’s behavior.
Limitations
This study is subject to certain limitations in methodology and the data set applied: first, an omitted variable bias is possible. We assume this could be the case with regard to a variable on the status of the property (e.g. maintenance situation) or the building type. At the same time, some of the integrated variables may show a certain consonance with other variables. If multicollinearity should be on hand to an extent, where certain variables should actually influence others, the standard errors may mis-estimated. However, the expected values should remain valid and unbiased. Furthermore, as we integrate asking prices of the properties and have no information on the actual transaction price, a difference should be made between willingness-to-pay and “willingness-to-demand.” We analyze with the implicit assumption that landlords can enforce their asking price, which should be the case in the clear majority, but not all situations. Throughout the large-sample size, this may constitute an upward bias in property prices. And ultimately, the set-up of heating technology baskets is based on valid assumptions, but might be designed in other compositions in a rather inter-disciplinary approach. As soon as not only cost- and market-based considerations, but also clearly technologically driven standards would be integrated, the compositions of what is treated “green” or “brown” might be subject to discussion.
This research paper is part of a project that has received funding from the European Union’s Horizon 2020 research and innovation programme under Grant Agreement No. 649656.
Notes
Similar studies comprise Laquatra (1986), who has shown that the energetic standard of a property, measured by the Thermal Integrity Factor (TIF) as a proxy, is positively correlated to the transaction price. Dinan and Miranowski (1989) produced comparable findings and quantified that 1 dollar in energy costs saved would c.p. multiply to US$11.63 of increased sales transaction price in their sample.
National Australian Built Environment Rating System.
Also, structural price differences between urban and rural areas were not systematically considered in all studies and only approximated by “distance to CBD” or the underlying land prices. In this study, we will suggest and incorporate an alternative for that based on structural land use data from a European Union program. This depicts a more direct approach that can also handle non-radial distance structures of urban land use patterns.
During the 2016 United Nations Climate Change Conference in Marrakech, 47 countries of the “Climate Vulnerable Forum” declared their intention to produce even a 100 percent of their domestic energy using renewable energy sources. These nations are mainly developing countries.
For instance, offers with purchasing or rent price of €0 or €1 were excluded. Other sample selection logics refer to implausibly high room numbers or living areas of the property offer, excessive energy consumption, the year of construction or the actual geographic location. In the rental model, the original n=761,854 was reduced to n=266,583 and in the sales model, it was reduced from n=312,087 to n=141,859 through the optimization.
Significance levels in Generalized Additive modeling is subject to specific considerations, as they typically come with a downward bias, cf. Wood (2013). However, due to the large-sample size included in the study, high levels of confidence should be supposed nevertheless.