

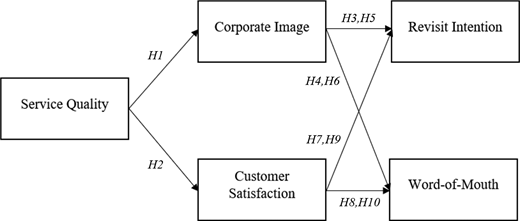
This paper aims to understand the impact of service quality on corporate image and customer satisfaction. Furthermore, this study also examined the influence of corporate image and customer satisfaction on revisit intention and word of mouth. The mediation effect of corporate image and customer satisfaction on the relationships between service quality–revisit intention and service quality–word of mouth was also examined.
This study used the survey questionnaire method and collected data from 253 respondents comprising of customers who had karaoke singing experience in the Karaoke television (KTV). The partial least squares structural equation modeling was used in this study.
This study found that service quality has a significant positive influence on corporate image and customer satisfaction. Corporate image does not have a significant influence on revisit intention but has a significant positive influence on word of mouth. Furthermore, customer satisfaction has a significant positive influence on revisit intention and word of mouth. The mediation effect of corporate image and customer satisfaction is also found to be significant for most of the relationships.
This study showed the importance of service on customers’ reactions and behaviors in the KTV context, which have not been previously investigated. Businesses should always provide superior service quality to their customers because it impacts their subsequent behaviors such as revisit intention and word of mouth.
Introduction
A karaoke house, also known as a Karaoke television (KTV), is a place where private rooms furnished with karaoke equipment are rented out to customers who want to sing in private (Fung, 2009). It allows ordinary singers to enjoy singing in a private KTV room instead of singing on stage in front of the general public, which can avoid the pressure of being criticized (Ruismäki et al., 2013). Karaoke singing is a popular leisure activity in Asian countries such as Japan, Hong Kong, China, Taiwan and Malaysia. The KTV is a place not only for customers to express their feelings through singing but also for to talk about businesses.
China’s karaoke-booth market alone is currently worth about $600m and is expected to reach $1.2bn by the end of 2018 (The Wall Street Journal, 2018). In Malaysia, there is no statistics on the total sales of the KTV industry but the increasing number of KTVs opening up in Malaysia shows the rising demand for karaoke consumption among Malaysians. Some of the popular Karaoke operators in Malaysia include RedBox, Loudspeaker, Neway and Superstar Family KTV (Tan, 2016). Given the stiff competition in the KTV industry, KTV companies need to project good service quality to attract and retain customers (Koay et al., 2019). It is important to offer service elements that satisfy customers’ expectations and simultaneously, reflect positive companies’ identities. With satisfied customers and positive corporate image, positive word of mouth will be generated and customers are more likely to revisit the business (Hussain, 2016).
However, the question remains that how existing service model of KTV operators, particularly in Malaysia, manage to attract and retain customers. Therefore, the study aims to examine the influence of service quality on corporate image and customer satisfaction and how corporate image and customer satisfaction influence revisit intention and word of mouth. Furthermore, this study also investigates the mediating role of corporate image and customer satisfaction on the relationships between service quality–revisit intention and service quality–word of mouth.
The findings will be very useful for managers whose aim is to improve the current practices of their KTV businesses.
Literature review
Equity theory
Equity theory posits that people compare their sacrifices and rewards that they receive during an exchange process (Adams, 1963). In line with this, several studies have adopted equity theory to understand the relationship between customers and companies (Chen et al., 2019; Lim, 2020; Pai et al., 2018). These studies argue that when customers feel that they are equitably treated during an exchange with the company, they feel satisfied.
Equity theory suggests that when customers receive good quality of service, they are more likely to show commitment to the company in different forms, such as repeat patronage (Kelley and Davis, 1994; Andreassen, 2000). Jiang et al. (2016) conducted a study in the e-commerce context and found that service quality significantly influenced customer loyalty based on equity theory. In another study of Chen et al. (2012), equity theory is used to examine how service quality affects customer satisfaction in the banking industry. This theory provides a profound theoretical lens to understand how customers perceive KTV service quality. Customers are likely to revisit and create positive word of mouth if they believe KTV service quality satisfies them.
Service quality
Providing superior service quality is crucial in achieving long-term success in the service industry (Shahin and Dabestani, 2010). Service quality refers to consumers’ evaluation of the excellence and superiority of the service encountered (Zeithaml and Bitner, 2003). Customers who experience positive feelings and attitudes toward the services during the service consumption process are more likely to perceive favorably toward the service provider, which subsequently leads to customer loyalty (Ishaq, 2012). This is consistent with past studies which have shown that in the hotel industry, customers who are satisfied with the service quality are more likely to become loyal customers (Cheng and Rashid, 2013; Cheng et al., 2014). In the context of tourism, a research by Wu and Li (2015) on a sample of visitors to the Museums of Macau revealed that service quality is critical to customer satisfaction. In addition, a recent study by Kasiri et al. (2017) indicated that service industry can improve customer satisfaction through service quality.
To date, consumers pay considerable attention to the reputation of a company. According to Bos (2007), corporate image is an organization’s overall beliefs and impressions in the public’s mind. Aydin and Özer (2005) asserted that consumers’ perception of quality of the service provider influences their perceptions of corporate image. A substantial amount of service marketing literature has shown the relationship between service quality and customer satisfaction (Ahrholdt et al., 2017; Priporas et al., 2017; Famiyeh et al., 2018). For instance, Cheng et al. (2014) discovered that tourists who experience high levels of service quality from a hotel are more likely to have high levels of customer satisfaction and favorable corporate image toward the hotel. More recently, Zameer et al. (2018) showed that service quality has a significant positive influence on corporate image in the banking industry. Based on these studies, the following hypotheses are developed:
Service quality has a significant positive influence on corporate image.
Service quality has a significant positive influence on customer satisfaction.
Corporate image
Corporate image is defined as “the immediate mental picture an individual holds of the organisation” (Foroudi et al., 2014, p. 2271) which is formed based on a customer’s overall consumption experiences (Aydin and Özer, 2005). In another words, corporate image refers to customers’ perception of the organization image. According to Virvilaite and Daubaraite (2011), corporate image is a form of competitive advantage which is hard for competitors to imitate as it can only be developed over a long period of time. Therefore, maintaining a positive corporate image is critical because it significantly impacts customer repurchase decisions and willingness to provide word of mouth (Andreassen and Lindestad, 1998).
In the context of service marketing and entertainment, corporate image was found to have a significant positive influence on behavioral intention in Taiwan’s quick service restaurant industry (Wu, 2013), gaming industry (Wu, 2014) and theme park industry (Wu et al., 2018). For example, Wu et al. (2015) discovered that corporate image greatly affects revisit intention in the context of the hot spring industry. Quintal and Polczynski (2010) described revisit intention as customers’ judgment about the likelihood of revisiting the same destination. In the long run, such behavioral intention will contribute to the business profitability (Jani and Han, 2014). On the other hand, when the corporate image is favorable, customers are more likely to spread a positive word of mouth. Word of mouth refers to “informal, person-to-person communication between a perceived non-commercial communicator and a receiver regarding a brand, product, organization, or service” (Harrison-Walker, 2001, p. 70). In a study investigating a company’s green image, Wang et al. (2018) found out that corporate image affects consumers’ word of mouth about green hotels.
Corporate image is viewed as an intervening variable that acts as a mediator between service quality and behavioral intentions including loyalty, revisit intention and word of mouth. For example, Lai et al. (2009) found that higher quality of service significantly increases corporate image, which in turn increases behavioral intentions. Consistent with past studies, corporate image should have a significant positive influence on revisit intention and word of mouth in the context of the KTV industry. Considering all of this evidence, behavioral intention indicates a stated likelihood to return to the place, to provide favorable comments regarding the place and to recommend the place to others in the future (Andreassen and Lindestad, 1998).
The following hypotheses are developed:
Corporate image has a significant positive influence on revisit intention.
Corporate image has a significant positive influence on word of mouth.
Corporate image mediates the relationship between service quality and revisit intention.
Corporate image mediates the relationship between service quality and word of mouth.
Customer satisfaction
Customer satisfaction is a measure of how products and the services provided meet or surpass customer expectations (Kotler and Armstrong, 2018). It refers to the final state of a process in which the customers evaluate the perceived benefits obtained from using service (Oliver, 2010). If a company wants customers to perceive their products or services as valuable, customer satisfaction must be fulfilled (Zameer et al., 2015). Satisfied customers tend to stay loyal with products that can satisfy their needs and wants (Mohd Suki, 2017).
A study conducted by Agnihotri et al. (2019) reported that customer satisfaction with the sales personnel has a significant positive influence on customers’ willingness to pay more. This shows that when customers’ needs are met efficiently, the satisfaction will drive them to spend more money and make more repeated purchase. On the other hand, Reynolds and Beatty (1999) found out that high level of satisfaction with the company results in spreading positive word of mouth about the company. Ardnt (1967, p. 1) described word of mouth as informal conversation which is “probably the oldest mechanism by which opinions on products and brands are developed, expressed, and spread.” In another words, a satisfied customer would likely give the company a good reference (Leung, 2020). For example, Han and Ryu (2012) empirically verified that customer satisfaction is positively related to word of mouth in a full service restaurant.
Numerous studies suggested that service quality increases behavioral intentions through customer satisfaction. For example, Saleem et al. (2017) found customer satisfaction acts as a mediator between service quality and repurchase intentions in the airline industry. In another recent study, Hussain (2016) examined the relationship between service quality, value, image, satisfaction and loyalty on a sample of 253 airline passengers. They found that quality of a service is an important factor in generating favorable behavioral intentions through customer satisfaction. In view of all that has been mentioned so far, the following hypotheses are developed:
Customer satisfaction has a significant positive influence on revisit intention.
Customer satisfaction has a significant positive influence on word of mouth.
Customer satisfaction mediates the relationship between service quality and revisit intention.
Customer satisfaction mediates the relationship between service quality and word of mouth.
The full research model is shown in Figure 1.
Research method
Sample
A survey questionnaire method was used in this study to achieve our research objectives. Before we distribute the survey questionnaires to our target respondents, we conducted a pre-test on several academic experts and several respondents. Their feedback was later used in amending the final questionnaire. Some wordings and the layout were corrected for better clarity. To avoid sampling bias, we distributed the survey questionnaires to 50 customers in 6 different branches. Each respondent was rewarded with a voucher worth RM10 from the KTV X to increase the response rate. In the end, the final usable samples consist of 253 customers who have experienced singing karaoke in the KTV X. The real identity of the company is concealed and represented as KTV X in this paper.
All scales were adapted from validated studies and measured in a five-point scale format. Service quality was measured using three items adapted from the study by Wu et al. (2015) which included “This KTV has offered superior quality” as an example item. Corporate image was measured using five items adapted from the study by Aydin and Özer (2005). An example item includes “The KTV X is stable and firmly established.” Customer satisfaction was measured using three items adapted from Oliver’s (1980) study with “Overall, I am satisfied with my experience at the KTV X” incorporated as an example item. Revisit intention was measured using two items from the study by Lam et al. (2011). An example item includes “I will visit this KTV in the future.” Word of mouth was measured using four items adapted from the study by Line et al. (2018) and the example item was “I would say positive things about this KTV to other people.”
Results
Data analysis
Partial least squares structural equation modeling (PLS-SEM) was conducted using Smart PLS 3 software in this research (Ringle et al., 2015). Some of the strengths of PLS-SEM and the reasons for its use are: PLS-SEM is less rigid on data assumptions and more flexible with small sample size data and PLS-SEM has the ability to handle complex models (Hair et al., 2017).
The measurement model was first validated and then the structural model was estimated (Anderson and Gerbing, 1988).
Common method variance
Common method variance (CMV) in this study was assessed using the unmeasured latent marker construct approach (Liang et al., 2007). The ratio of the average substantive variance (0.895) to the average method variance (0.0028) is small at 29:1. Furthermore, Table 2 shows that each of the inter-construct correlations is less than the threshold value of 0.9 (Bagozzi et al., 1991). Hence, we can conclude that CMV is not a serious concern in the present study.
Discriminant validity
| 1 | 2 | 3 | 4 | 5 | |
|---|---|---|---|---|---|
| Fornell–Larcker criterion | |||||
| Corporate image | 0.845 | ||||
| Customer satisfaction | 0.766 | 0.920 | |||
| Word of mouth | 0.665 | 0.760 | 0.871 | ||
| Revisit intention | 0.599 | 0.749 | 0.670 | 0.970 | |
| Service quality | 0.620 | 0.647 | 0.611 | 0.563 | 0.939 |
| Values on the diagonal (italic) represent the square root of the AVE while the off-diagonals are correlations | |||||
| HTMT criterion | |||||
| Corporate image | |||||
| Customer satisfaction | 0.845 | ||||
| Word of mouth | 0.729 | 0.827 | |||
| Revisit intention | 0.650 | 0.810 | 0.714 | ||
| Service quality | 0.676 | 0.702 | 0.658 | 0.602 | |
Measurement model
This study first checked for the internal consistency of measures for each construct. As shown in Table 1, the values of Cronbach’s alpha and composite reliability for all the constructs are greater than the recommended value of 0.7, indicating that all the constructs are reliable. Next, convergent validity was examined by looking at the factor loadings and average variance extracted (AVE). Table 1 shows that the factors loadings were all higher than 0.7 and the AVE values were also higher than 0.5, as suggested by Hair et al. (2017). Thus, convergent validity was ascertained in this study. Discriminant validity was examined using the Fornell–Larcker criterion and heterotrait–monotrait (HTMT) criterion. Fornell–Larcker criterion requires the square root of the AVE for each construct to be greater than its correlations with other constructs and HTMT criterion requires the ratio to be lower than 0.9 (Fornell and Larcker, 1981; Henseler et al., 2015). As shown in Table 2, this study did not have discriminant validity issue. The model fit was assessed using the standardized root mean square residual (SRMR). The SRMR value for the research model was 0.059, indicating that the data fits the model (Henseler et al., 2016a).
Measurement model
| Constructs | Items | Mean | Loadings | Cronbach’s alpha | Composite reliability | AVE |
|---|---|---|---|---|---|---|
| Word of mouth | WOM1 | 3.917 | 0.898 | 0.895 | 0.926 | 0.758 |
| WOM2 | 3.961 | 0.887 | ||||
| WOM3 | 4.063 | 0.871 | ||||
| WOM4 | 3.688 | 0.825 | ||||
| Corporate image | IM1 | 3.775 | 0.870 | 0.900 | 0.926 | 0.715 |
| IM2 | 3.672 | 0.858 | ||||
| IM3 | 3.731 | 0.843 | ||||
| IM4 | 3.700 | 0.830 | ||||
| IM5 | 4.189 | 0.825 | ||||
| Revisit intention | RV1 | 4.083 | 0.970 | 0.938 | 0.970 | 0.942 |
| RV2 | 4.119 | 0.971 | ||||
| Service quality | SQ1 | 3.571 | 0.927 | 0.932 | 0.957 | 0.881 |
| SQ2 | 4.332 | 0.955 | ||||
| SQ3 | 4.660 | 0.933 | ||||
| Customer satisfaction | Sat1 | 4.245 | 0.902 | 0.909 | 0.943 | 0.846 |
| Sat2 | 6.443 | 0.925 | ||||
| Sat3 | 6.534 | 0.932 |
Structural model
A bootstrapping procedure of 5,000 re-samples was conducted to assess the significance of path coefficients. Table 3 shows that service quality has a significant positive influence on corporate image and customer satisfaction, supporting H1 and H2. Next, corporate image was found to have a significant positive influence on word of mouth but no significant influence on revisit intention, thus supporting H4 but not H3. In addition, customer satisfaction was found to have a significant positive influence on revisit intention and word of mouth, supporting H7 and H8. Apart from that, we also assessed the mediation effect of corporate image and customer satisfaction according to the guidelines by Nitzl et al. (2016). Table 3 shows that H5 is not supported as corporate image does not mediate the relationship between service quality and revisit intention. However, corporate image mediates the relationship between service quality and word of mouth, supporting H6. Furthermore, customer satisfaction mediates the relationship between service quality and revisit intention, and the relationship between service quality and word of mouth, thus supporting H9 and H10.
Direct and indirect effects
| Direct effect | Beta | BCCI (5–95%) | SE | t-value | p-value | Decision | |
| H1 | SQ → CI | 0.620 | [0.550, 0.683] | 0.040 | 15.495 | 0.000 | Supported |
| H2 | SQ → CS | 0.647 | [0.585, 0.701] | 0.036 | 18.097 | 0.000 | Supported |
| H3 | CI → RI | 0.061 | [−0.052, 0.170] | 0.068 | 0.896 | 0.185 | Not supported |
| H4 | CI → WOM | 0.201 | [0.087, 0.316] | 0.070 | 2.885 | 0.002 | Supported |
| H7 | CS → RI | 0.703 | [0.597, 0.805] | 0.064 | 11.056 | 0.000 | Supported |
| H8 | CS → WOM | 0.606 | [0.495, 0.717] | 0.068 | 8.972 | 0.000 | Supported |
| One-tailed test | |||||||
| Indirect effect | Beta | BCCI (2.50%– 97.5%) | SE | t- value | p-value | Decision | |
| H5 | SQ → CI → RI | 0.038 | [−0.042, 0.120] | 0.042 | 0.904 | 0.366 | Not supported |
| H6 | SQ → CI → WOM | 0.124 | [0.036, 0.212] | 0.045 | 2.783 | 0.005 | Supported |
| H9 | SQ → CS → RI | 0.455 | [0.357, 0.552] | 0.051 | 8.951 | 0.000 | Supported |
| H10 | SQ → CS → WOM | 0.392 | [0.286, 0.495] | 0.053 | 7.408 | 0.000 | Supported |
| Two-tailed test | |||||||
Note:
BCCI = Bias corrected confidence intervals
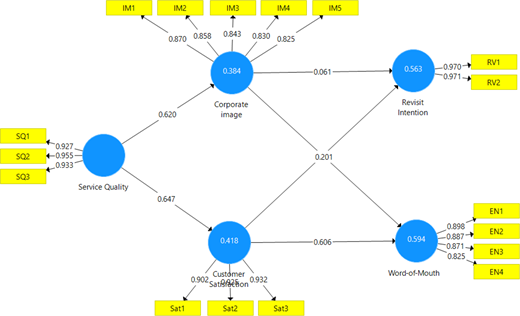
To examine the explanatory power of the research model, we also reported the R2, Q2 and Q2 predict, as shown in Figure 2. The value of Q2 was generated using a blinding folding procedure and should exceed zero indicating that the model has predictive relevance (Geisser, 1974; Stone, 1974). The value of Q2 predict greater than zero indicates that using the PLS model gives more predictive power (smaller prediction errors) than simply using the average value of all observations (Hair et al., 2019).
Using gender as a moderator, a post-hoc multi-group analysis (MGA) was conducted in this research because some studies indicated that the influence of service quality on customer satisfaction and corporate image, and the influence on loyalty might be different between males and females (Dimitriades, 2006; Karatepe, 2011). Prior to running the MGA analysis, a permutation test to establish measurement invariance was conducted (Henseler et al., 2016b). Table 4 shows the results of the permutation test. The results indicate the establishment of full measurement invariance. The full MGA results show significant differences between male and female groups in regard to the influence of service quality on customer satisfaction (Henseler’s MGA p-value = 0.025) (Table 5). The results can be useful for managerial implications.
Results of invariance measurement testing using permutation
| Configural invariance | Compositional invariance (correlation =1) | Partial measurement invariance established | Equal mean assessment | Equal variance assessment | Full measurement invariance established | ||||||
|---|---|---|---|---|---|---|---|---|---|---|---|
| C = 1 | 5.0% | Differences | Confidence interval | Equal | Differences | Confidence interval | Equal | ||||
| CI | Yes | 0.999 | 0.999 | Yes | −0.020 | [−0.261, 0.267] | Yes | −0.070 | [−0.416, 0.361] | Yes | Yes |
| CS | Yes | 1.000 | 1.000 | Yes | −0.052 | [−0.257, 0.267] | Yes | −0.158 | [−0.380, 0.347] | Yes | Yes |
| WOM | Yes | 0.999 | 0.998 | Yes | 0.007 | [−0.265, 0.262] | Yes | −0.200 | [−0.435, 0.401] | Yes | Yes |
| RI | Yes | 1.000 | 1.000 | Yes | −0.030 | [−0.257, 0.268] | Yes | −0.036 | [−0.394, 0.351] | Yes | Yes |
| SQ | Yes | 1.000 | 1.000 | Yes | 0.221 | [−0.262, 0.272] | Yes | 0.092 | [−0.453, 0.429] | Yes | Yes |
Results of moderation hypothesis testing using MGA
| Relationships | Path coefficient (male) | Path coefficient (female) | CIs (bias corrected) male | CIs (bias corrected) male | Path coefficient difference | p-value Henseler’s MGA | Supported |
|---|---|---|---|---|---|---|---|
| SQ → CI | 0.652 | 0.618 | [0.501, 0.752] | [0.533, 0.681] | 0.033 | 0.329 | No |
| SQ → CS | 0.752 | 0.610 | [0.644, 0.827] | [0.528, 0.670] | 0.143 | 0.025 | Yes |
| CI → WOM | 0.290 | 0.143 | [0.094, 0.455] | [−0.008, 0.302] | 0.147 | 0.153 | No |
| CI → RI | 0.093 | 0.039 | [−0.059, 0.248] | [−0.118, 0.196] | 0.054 | 0.349 | No |
| CS → WOM | 0.515 | 0.664 | [0.343, 0.683] | [0.505, 0.807] | 0.149 | 0.859 | No |
| CS → RI | 0.658 | 0.729 | [0.486, 0.803] | [0.571, 0.867] | 0.071 | 0.703 | No |
Discussions
Karaoke singing is a popular activity in Asia and a lucrative business especially in Malaysia. However, competition is fierce as customers are presented with many choices of KTV providers. To outperform the competitors, satisfying the needs of customers is important to attract them to revisit and spread positive words about the company to their friends. Consistent with past studies (Cheng et al., 2014; Wu et al., 2011), the findings of this study showed that service quality is an important factor that influences corporate image and customers’ satisfaction. KTV companies need to ensure that the service consumption process in their premises is enjoyable for the customers as it can influence the overall perception of service quality.
The study also showed evidence of the importance of having a positive corporate image and achieving high levels of customer satisfaction. Although corporate image was found to have no significant influence on revisit intention, it has a significant positive influence on customers’ intention to spread positive things about the KTV company. For instance, customers who perceive positively about the image of the company are more likely to say positive things, post positive things online and write a positive review online about the company. Customer satisfaction is also a strong predictor of revisit intention and word of mouth, which implies that satisfied customers are more likely to come back to the same company despite having alternative choices in the market, and to spread positive things about the KTV company. It is important to ensure customers spread positive things about the company to others because it is a form of effective marketing strategies that create awareness to the public.
However, the study showed unexpected results whereby corporate image had no significant effect on revisit intentions and did not mediate the relationship between service quality and revisit intentions. It is surmised that many KTV companies in Malaysia offer the similar service model and therefore providing superior excellent service quality becomes a necessity rather than a strategy that can elevate positive corporate image and revisit intention.
Although it has been shown that corporate image and customer satisfaction are important, their influence on revisit intention and word of mouth is less direct. Hence, KTV companies need to understand which factors influence corporate image and customer satisfaction in the first place. The finding suggested that service quality is the important element that can lead to a higher revisit intention and positive word of mouth but it is mediated by corporate image and customer satisfaction.
Managerial implications
It is important for leisure-service operators to understand what customers are looking for to develop their revisit intention and willingness to spread word of mouth. The key areas to consider when companies try to reduce unfavorable word of mouth include service quality, customer satisfaction and corporate image. According to the appraisal theory, perceived service quality leads to customers’ consumption-related emotions (Bagozzi, 1992). If a customer’s consumption experience involves emotions, the customer is more likely to share his/her feeling about the experience with others (Westbrook, 1987).
The results indicated that satisfied customers reported greater intentions to revisit and spreading word of mouth; thus, leisure-service companies should focus on providing excellent service and build good relationships with customers to encourage repeat business. As the internet has become ubiquitous in customers’ lives, digital networking platforms can be used to create positive company reputation. The company’s digital networking platforms represent the brand; therefore, it is important for the leisure-service providers to focus on sustaining the platforms by communicating and resolving customers’ complaints. In addition, good interactions with customers help to improve corporate image (Wu et al., 2015).
On the other hand, leisure-service companies should value their employees by promoting a healthy organizational culture. Satisfied employees can improve customer satisfaction via emotional contagion (Hennig-Thurau et al., 2006). Emotional contagion refers to the “tendency to automatically mimic and synchronize facial expressions, vocalizations, and movements with those of another person and, consequently, to converge emotionally” (Hatfield et al., 1994, p. 5). As highly satisfied customers are more likely to revisit, the companies should try their best to create a positive milieu and offer better service to the customers.
Conclusion, limitations and future research directions
In conclusion, to the best of the author’s knowledge, this study is the first that explored the associations between service quality, corporate image, customer satisfaction, revisit intention and word of mouth in the KTV context. Most of the hypothesized relationships are supported, indicating service quality is an important element that affects corporate image and customer satisfaction which, in turn, influences revisit intention and word of mouth. The findings of this study give suggestions to KTV companies on how to gain new customers and retain old customers, which can lead to organizational growth.
This study is not without limitations. First, cross-sectional data is inadequate in drawing causal conclusions. Future studies should use longitudinal data if possible. Second, the results might not be generalizable to other contexts. Hence, the research model should be replicated in other contexts. Third, CMV may be an issue of concern because the measured latent marker variable (MLMV) approach was not applied (Chin, 2013). Future studies should consider either collecting data from different time points or using MLMV approach to detect and control for CMV. Fourth, revisit intention and word of mouth were measured using a self-report method. It would be more interesting to track customers’ revisit frequency as a way to measure revisit intention and to assess customers’ feedback on the social media as a measurement of word of mouth.
