The purpose of this study is to establish to what extent the Statistics eTool embedded in the institutional learning management system (LMS) is being used by lecturers at the University of the Western Cape (UWC). Additionally, the study explores how the eTool is being used and whether the data collected by the eTool have directly benefited students and their academic success or not.
Primary data were collected via an online questionnaire as well as individual interviews with staff at the institution. Secondary data embedded within the LMS were used to provide additional information relevant to the study.
The Statistics eTool’s use among UWC staff can be improved through further awareness and training on its capabilities. Staff who use the eTool primarily use it for reporting purposes and not as readily for ensuring student success or the improvement of the design of their online environments.
An identified limitation is that the research was only conducted at one institution and that the sample size was small.
This study initiates research which has not been delved into previously. The utilisation of the Statistics eTool within the Sakai LMS is an area which is under-researched and which can benefit both lecturers and students. It also highlights the need for further research on the use of the Statistics eTool and its benefits to be conducted at other institutions with a larger sample.
Introduction
The University of the Western Cape (UWC) uses the Sakai platform to conduct blended and fully online learning and teaching. Institutionally, the learning management system (LMS) is branded as iKamva, which means “future” in isiXhosa. The platform offers a variety of eTools, which enhance the learning and teaching experience for students and staff; however, many valuable eTools are underused. The research study was, therefore, conceptualised to explore to what extent the Statistics eTool was being used by lecturers at UWC, as well as how it was being used. In addition, the research delved into whether the data collected via the Statistics eTool were benefiting students and their academic success or not. Researchers also hoped that through this institutional case study, it would shed light on the full capabilities and benefits of the eTool and increase adoption and use of the Statistics eTool at UWC and other institutions.
The theoretical framework of the study was derived from reviewing related literature. The research questions were as follows: How aware are staff of the various Statistics eTool capabilities? To what extent is the Statistics eTool currently benefiting lecturers and students at UWC? How are the Statistics eTool data being used by staff – monitoring, tracking, reporting, etc.? The research questions informed the development of the questions used in the online questionnaire as well as the semi-structured interviews.
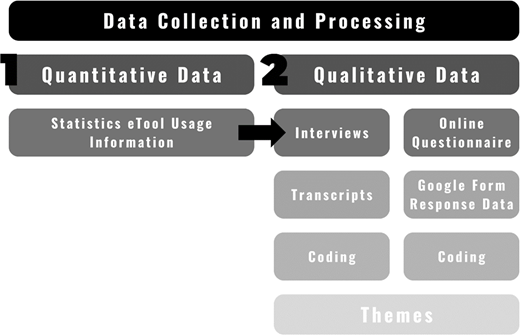
To address these questions, a mixed-method approach was used, consisting of primary, qualitative data collected via an online survey and one-on-one interviews, as well as secondary, existing data, which had been collected by the Statistics eTool on iKamva (Sakai).
The study is needed, as it highlights the many benefits of using the Statistics eTool and how it could increase student retention and success. As there is limited literature on the Statistics eTool, the researchers feel it would make a valuable contribution both institutionally and at other institutions that currently use the Sakai LMS.
Background
Researchers pursued this study as the CIECT instructional design team was interested in knowing whether lecturers at the institution were using the Statistics eTool and had an awareness of its capabilities in relation to reporting, identifying students “at risk” and course-site design. A gap in the literature was also identified in relation to the use and capabilities of the Statistics eTool within the Sakai LMS, as other papers seemed to focus on Moodle. Through this study, the researchers hope to shed light on the Statistics eTool embedded in Sakai and introduce those who are unfamiliar with the eTool to all its benefits.
In the review of the literature, researchers introduce the Sakai LMS; the monitoring and tracking of student engagement online; and the Statistics eTool.
Sakai Learning Management System
The Sakai LMS was implemented at the UWC in 2012 after migrating from the Chisimba LMS. Although the study focuses on the Statistics eTool embedded within Sakai, the authors acknowledge there are several LMS platforms available to higher education (HE) institutions, including Moodle, Open edX, Blackboard, Masteriyo LMS and many others.
The utilisation of an LMS within HE has become increasingly popular and more widely used because of the adaptability and convenience online learning provides students (Mubarak et al., 2022, p. 1414). In addition, the increased adoption of the LMS and online platform usage during the COVID-19 pandemic to ensure the continuation of the academic calendar (Lalani et al., 2021) meant that several academics and students gained exposure to the online environment and how to navigate it.
The LMS stores learning resources, allowing instructors to provide materials to students, which boosts their educational capacities (Mubarak et al., 2022, p. 1414). An LMS additionally provides staff and students access to learning materials at any time or location, “centralizing the source of learning” (Boateng, 2020, p. 54) and providing opportunities for monitoring and tracking student learning and performance. As Boateng (2020) mentions, this ensures more effective student activities, tailored to suit student needs as well as easier assignment submission and feedback and increased communication between the instructor and the student. The use of an LMS extends learning beyond the university, the lecturerand the facilitator, “serv[ing] as a conduit connecting […] academic and social engagement” (Odame and Yalley, 2023, p. 127). The LMS additionally provides a student-directed learning environment (Mubarak et al., 2022, p. 1414) where the student takes ownership of their learning and, as a result, is more engaged.
Monitoring and tracking student progress
For decades, “data analytics and learning analytics” have contributed significantly to the analysis of student activity and “understanding their behaviours [within] an online learning environment […]” to assist with decreased dropout rates (Baker et al., 2015; Marbouti et al., 2016; Lytras et al., 2017 in Mubarak et al., 2022, p. 1415). Facilitators are better able to track and monitor a student’s learning behaviour and ensure “enhance[d] instructor-student interaction” when using an online learning environment (Mubarak et al., 2022, p. 1414).
The utilisation of the Statistics eTool embedded in the Sakai LMS can assist lecturers in reflecting on students or an individual student’s engagement within the online learning environment to meet specific needs (Boateng, 2020, p. 54). By adjusting the learning materials based on the students’ needs, it may lead to improved engagement and better learning success, as “[r]esearch has shown that, student engagement is a major predictor of student success” (Boateng, 2020, p. 61). Through early detection of “students [who] are at risk of failing a course” (Maraza-Quispe et al., 2021, p. 13), tailored interventions may be implemented to improve student success rates. Therefore, by monitoring and tracking student activity within the LMS, institutions can adopt “new and innovative ways to get their students more involved, connected and engaged” (Boateng, 2020, p. 61).
Relationship between statistics eTool data measures and student achievement
Making use of data retrieved from the LMS by the Statistics eTool provide lecturers with insights into student behaviours throughout the course and whether these shift or change over a period of time. It further provides lecturers with data on student performance in tasks, quizzes and exams (Maraza-Quispe et al., 2021) and student interaction with learning resources within the learning environment (Alonso-Fernández et al., 2024), as well as how they engage with one another. Studies have shown that “participation indicators and patterns” are “strongly correlated with academic achievement” (Asarta and Schmidt, 2013; Goldstein and Katz, 2005; Michinov et al., 2011; Rafaeli and Ravid, 1997, in You, 2016). The data allow lecturers to make adjustments to their online content where necessary to better suit “students’ progress and needs” (Alonso-Fernández et al., 2024, p. 1) and identify “at risk” students who may need intervention (Mubarak et al., 2022; Alonso-Fernández et al., 2024).
Statistics eTool
According to the Sakai (2022) website, “[t]he Statistics tool allows authorized users (typically instructors or site owners) to view site usage statistics and user activity events” while also allowing for more detailed custom reports to be created.
The system can provide a summary of the activities or event logs for the entire class through the Statistics eTool. Aside from providing an overall overview of class engagement, the system can also track individual student activity during the learning and teaching process. This is particularly important to track the engagement by individual students who may be seen as “at risk” or students whom lecturers have identified as not actively engaging.
At UWC, certain lecturers use the Statistics eTool for record-keeping and reporting purposes relating to the online environment, as it provides data on student activity within a module, ensuring accurate information relating to “active” and “inactive” users (Stoltenkamp, 2020).
Additionally, “instructors, lecturers or site owners” are able to create “custom reports” with data relating to “visits”, “events” or “eTools”. Lecturers are also able to input a specific time period and limit the data to an individual user or group. Additionally, the configuration of the data can be set to a table or chart, bar or line graph, PDF or Excel, to mention a few (Stoltenkamp, 2020).
Face-to-face, hybrid or fully online
The success of the online environment and the engagement of students within the LMS are impacted by many factors, and the researchers acknowledge that when exploring the use of the Statistics eTool for monitoring and tracking student engagement, it is important to explore the external factors which may affect student participation.
Stoltenkamp and Dankers (2020) highlight the importance of equitable distribution of “digital infrastructure” (p. 255) to ensure all students are able to access the LMS. Given the South African context, the digital divide, inequalities and social barriers students face cannot be overlooked (Stoltenkamp and Dankers, 2020). The learning preferences of students, the quality of the teaching materials and learning environment as well as, the equitable distribution of digital resources must be taken into account.
Method
The case study explored the utilisation of the Statistics eTool within the context of UWC. According to Andrade and Almeida (2020), case studies allow the researcher an in-depth understanding of a phenomenon through the views of several participants while additionally revealing new data.
Data were collected among UWC lecturers who responded to the call for participation sent to them via their institutional email. By following a link in the email, lecturers were able to participate in a self-administered, online questionnaire on Google Forms, where their responses were captured and populated. Semi-structured interviews were conducted concurrently via Google Meet with those lecturers who opted in, and these were automatically transcribed. The researchers then conducted a thematic analysis to review, code and group each data set according to emerging themes. Thematic analysis entails reviewing the data to identify “common threads” that appear throughout the data (DeSantis and Noel Ugarriza, 2000, in Vaismoradi et al., 2011, p. 400).
The data were validated through the utilisation of two data sets, namely, the online questionnaire responses and the interview transcripts, and by having multiple researchers involved in the data coding and analysis process. In qualitative research, using “several complementary sources of evidence” ensures “multiple perspectives on a phenomenon” are obtained, which results in greater validity (Andrade and Almeida, 2020, p. 266).
Research questions
Through this case study, researchers undertook to answer three questions, namely:
How aware are staff of the various Statistics eTool capabilities?
To what extent is the Statistics eTool currently benefiting lecturers and students at UWC?
How are the Statistics eTool data being used by staff – monitoring, tracking, reporting, etc.?
Sample
The “call to participation” was sent to possible participants, who met the set criteria, via an institutional email explaining in detail what the study was about and what would be expected from them if they opted to participate.
Researchers used purposive sampling to target UWC lecturers who had the Statistics eTool active on their module/s in 2024. Purposive sampling, which is a non-random sampling technique, allowed researchers to deliberately select participants who met a set of criteria suited to the study without the “need [for] underlying theories or a set number of participants” (Etikan et al., 2016, p. 2).
Because the primary data used in this study are qualitative, the researchers focused on information power and not on a large sample size for validity. Information power is guided by informational redundancy, meaning that sampling can cease once no new information is being elicited (Vasileiou et al., 2018). Therefore, according to Vasileiou et al. (2018), the more information retrieved from a sample, the smaller the sample has to be. The researchers do, however, acknowledge that there is still no consensus within qualitative research on what constitutes data saturation or how this is obtained; however, according to Bekmezci and Sürücü (2025), a suitable sample is between “1 and 15 participants” (p. 298).
Data management
“Data management refers to the policies and practise by which higher education institutions effectively collect, protect, and use digital information assets to meet academic and business needs” (Yanosky, 2009, p. 12).
At the UWC, researchers are held to strict ethical processes, as HE institutions are required to uphold policies and controls, which protect individuals and the security of information (Cheung, 2014).
For the purposes of this study, researchers have adhered to the institution’s ethical processes and data management standards, obtaining ethical clearance from the Humanities and Social Science Research Committee (HS25/3/8) and the Registrar’s Office (UWCRP536943).
All data collected for the purposes of this study have been securely stored in a digital drive accessible only to the researchers involved, where it will be kept for a minimum of five years, after which it will be deleted. Hard copies are kept to a minimum and stored in a locked drawer. After five years, any hard copies will be shredded in accordance with university policy.
To protect the anonymity of participants, their names are not stored with the data and are instead hidden by a coding system.
Existing secondary data recorded on the Institutional LMS will not be destroyed, as it is owned by UWC.
The researchers take accountability for ensuring the necessary sensitivity and criticality in relation to data collection, storage and methods of distribution (Cheung, 2014).
Analysis
After several attempts by researchers to garner participation in the study, 17 participants completed the online questionnaire and three participants agreed to be interviewed. One of the participants completed both the questionnaire and the interview, resulting in a total of 19 participants.
In addition to the data collected from 19 participants, the researchers also looked at secondary data recorded within the LMS. The data revealed that 56.2% (n = 640) of 1,139 modules had the Statistics eTool active in 2024. However, the data cannot reveal whether the Statistics eTool had been actively used by the lecturers managing these modules. Researchers have additionally found that in some cases, the same lecturers managed more than one of the 640 modules. The data were used to identify possible participants and the call for participation emails were sent to those identified (see Figure 1).
The online questionnaire was conducted using Google Forms, and therefore, the responses, which required participants to select from pre-determined answers, were automatically compiled as pie charts or bar charts, which the researchers could easily interpret. These are included here. The one-on-one interviews were conducted using Google Meet and were automatically audio recorded and transcribed, except in the case of one participant who opted out of audio recording. The transcripts were then reviewed by four of the researchers, discussed, grouped and coded according to themes. These themes were then compared to the themes in the questionnaire to group all the data according to the same themes, which could be easily interpreted, compared and written up. The themes were as follows: Reporting; Validating or supporting academic claims and requests made by students; Tracking and monitoring to identify “at risk” students; and Influencing the design of the online environment.
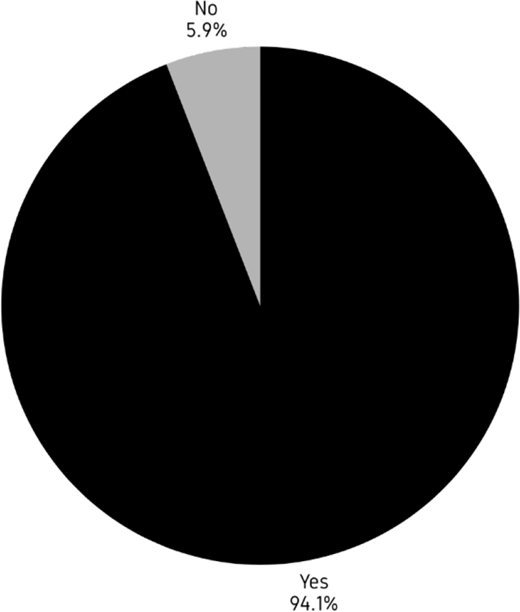
The first question in the online questionnaire asked participants, Are you aware that the Statistics eTool can be embedded in your iKamva (Sakai) module/s? (see Figure 2) to which 94.1% (n = 16) responded “Yes” and 5.9% (n = 1) responded “No”.
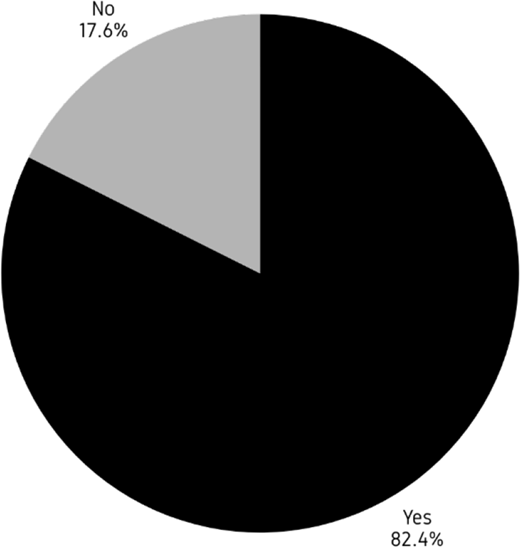
The second question asked participants, “Are you aware of the Statistics eTool’s capabilities?” (see Figure 3) to which 82.4% (n = 14) responded “Yes” and 17.6% (n = 3) responded “No”.
Researchers then asked participants to list the capabilities they were aware of, and the responses included:
Which students were using the site/who were inactive and of concern.
Which resources were being accessed/not being accessed.
Generating reports/customised reports.
Details about user activity, including date and time of access.
How much time is spent on a task.
Student performance.
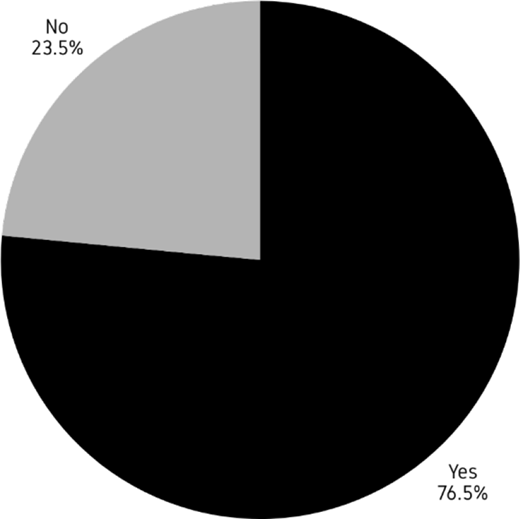
Researchers also wanted to determine whether staff were previously using the Statistics eTool (many made use of the tool during COVID) or whether they were currently making use of it. When asked, “Are you currently utilising the Statistics eTool?” (see Figure 4); 76.5% (n = 13) responded “Yes” and 23.5% (n = 4) responded “No”. In the interviews, however, all three participants indicated that they primarily used the eTool during the COVID lockdown period and were currently using it less than before.
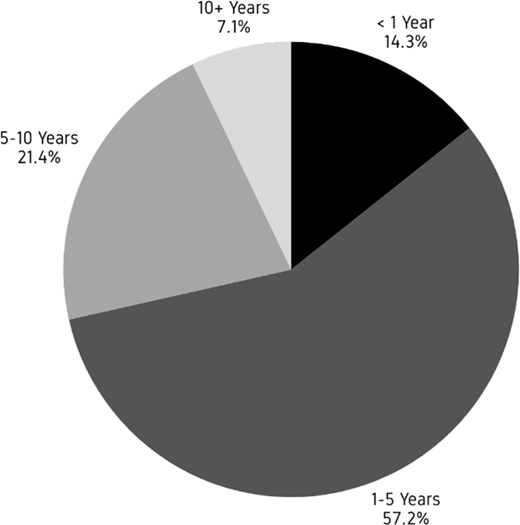
To better understand the timeframe of utilisation, the question is “If yes, how long have you been utilising the Statistics eTool?” (see Figure 5) was included. 14.3% (n = 2) indicated they had been using the eTool for less than a year. 57.1% (n = 8) indicated they had been using the tool for 1–5 years. 21.4% (n = 3) had been using the eTool for 5–10 years and 7.1% (n = 1) indicated they had used the eTool for more than 10 years.
During the interviews conducted, 100% (n = 3) of participants indicated they had started using the Statistics eTool during the national COVID lockdown in 2020, which, in 2025, would fall into the 1–5 years category. One participant explained why:
I think the first time it was during lockdown […] Because I’m here at UWC for 20 years and I think that over the years we have been using iKamva […] but I think that we weren’t so engaged as when we were in lockdown and we had to present the online classes and that was a form of checking to see if students actually were looking at the different classes and the lesson plans […].
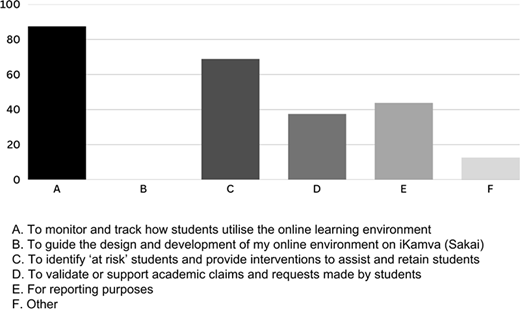
When asked, “How have you used the Statistics eTool?” (see Figure 6), participants were able to select multiple answers from a selection. 87.5% (n = 14) answered that they used the eTool “To monitor and track how students utilise the online learning environment”; 0% (n = 0) used it “To guide the design and development of my online environment on iKamva (Sakai)”; 68.8% (n = 11) answered, “To identify ‘at risk’ students and provide interventions to assist and retain students”; 37.5% (n = 6) indicated “To validate or support academic claims and requests made by students”; and 43.8% (n = 7) answered they used it “For reporting purposes”. In the “Other” category, two answers were given “To see who is making use of the resources and who is not” which researchers identified could fit the category “To monitor and track how students utilise the online learning environment”; and “To keep record of undergraduate students who need to complete a module that is entirely presented online”.
We asked interview participants to share how they use the Statistics eTool to monitor and track students’ progress, to which they responded:
Yeah, I don’t want to make it sound like tracking students to get them in trouble, but hopefully tracking students to help.
Yes, I do. […] Yeah, especially if you’ve got big classes.
In the online questionnaire, we asked participants, “In your opinion, has the Statistics eTool directly benefitted your students?” In response to this question, 47% (n = 8) responded negatively, indicating they did not feel it directly benefited their students, while 52.9% (n = 9) responded positively, explaining how they felt it benefited their students. Some of the negative responses included:
Not necessarily. The statistics tool probably benefits me more since I can validate students achievements or lack thereof by drawing a report of their access. For example, I can draw an inference from top achievers in the course and the number of times they accessed the resources/lesson pages.
Not really. I have other ways to monitor unresponsive students, such as the weekly compulsory quizzes that I set the students. I follow up with those that do not pass them.
While positive responses included:
I would say yes. Due to the fact that I can tract [1] student interaction. If there are resources they are not utilising then I am able to draw students’ attention to this.
The eTool benefits students both directly and indirectly. Directly, because the eTool identifies students that are potentially at risk. Based on the statistics, we can contact students that have not accessed the site or specific resources, and assess where we can assist them. Indirectly the students can benefit, as the eTool is also used to assess how/what content the students commonly use/access.
In the interviews, participants were asked, “How has the Statistics eTool benefitted you in your teaching and learning?” to which participants responded:
I think it does help us to know where a student is not engaging and I think that’s really useful to know so that I can address things earlier rather than later. I mean, I don’t use it every week. And I think if it was something that you were kind of using every week to track, I definitely think that would be more effective. It’s just because I see my students every week, it’s not really needed. But yeah, I do think it can be a very useful tool if you do use it well.
And another said:
Yes, I think it’s definitely benefiting. […] If students are failing, why are they failing? Are they failing because they’re not engaging with the content? Then obviously that is a clear indicator but using the statistics tool. […] So for me if students say that they didn’t have this or didn’t have that I can go and check so benefiting me as well. Yeah.
In both the online questionnaire and the interviews, participants were asked, “Has the data retrieved by the Statistics eTool influenced the design of your online module and digital content?” To which 76.5% (n = 13) of the questionnaire respondents responded with “negative” or “no responses”, indicating they were not using the Statistics eTool to influence the design of their online modules. These responses included:
Not really. My courses are mostly wholly designed and completed online before any kind of participation begins. The statistics tool is therefore used as a reflective exercise and perhaps to validate student performance.
However, for 23.5% (n = 4) of the questionnaire, participants provided “positive” or “yes” responses, such as:
It has influenced the digital content. I find that students benefit from videos, especially when it assists them in visualising the processes that we make reference to in our course content. The Statistics eTool assists by summarising relevant information.
In the interviews, 100% (n = 3) of the interviewees responded with “negative” or “no” responses, such as:
No. I won’t say I’ve done that. I think maybe that is something that I can investigate.
From the data, the researchers identified recurring themes within the participant responses. The findings are discussed according to these themes.
Findings
From the data collected, the researchers identified recurring themes within both the questionnaire responses and interview participant responses. The data are discussed according to these themes.
Reporting
In both the online questionnaire and the interviews, it became apparent that lecturers were using the Statistics eTool for reporting purposes. This was primarily to provide updates on student engagement with course material for departmental tracking, especially during the COVID period when coursework was only conducted online. It was noted above that for 43.8% (n = 7) of online questionnaire, participants indicated they used the data collected via the Statistics eTool for reporting purposes, and one of the interview participants explained, “the EMS Faculty introduced student feedback. […] [A]s lecturers we need to make comments on the students’ engagement and that is when I started using it [referring to the Statistics eTool] a bit more”. This indicates a faculty reporting requirement which is made easier through the use of the Statistics eTool, particularly when classes are large. As Osborne and Lang (2023) state, “[c]omputers provide the ability to rapidly and repeatedly execute calculations, allowing statistical analyses” which humans could not perform as quickly (p. 112).
Validating or supporting academic claims and requests made by students
Certain participants indicated that the Statistics eTool was helpful when academic claims or requests were made by students who were failing or at risk of failing. Lecturers were able to access statistics related to individual students to identify whether their academic results were directly correlated to a lack of engagement within the online environment. This is helpful in situations where students have not had intervention in time, and a record can then support claims made by the student. Ideally, students should be identified as soon as possible to “provide timely support and interventions that may help these students succeed” (Osborne and Lang, 2023, p. 109), which relates to identifying “at risk” students.
Tracking and monitoring to identify “at risk” students
Another prominent theme was tracking and monitoring for the purposes of identifying “at risk” students. As mentioned above, for 68.8% (n = 11) of questionnaire, participants were using the Statistics eTool data to identify and assist “at risk” students.
As the data are automatically generated and stored within the LMS via the Statistics eTool, it is a method of identifying “at risk” students at no additional cost to the institution (Osborne and Lang, 2023). Lecturers are, therefore, able to monitor the engagement of individual students within the online environment and reach out to those who are not accessing the course materials regularly or at all. This assists lecturers in identifying the contributing factors to the student’s lack of participation to try to rectify the situation where possible and prevent the student from failing or dropping out. This is a huge benefit not only for the student but also for the institution, as preventing drop-outs also assists in securing institutional funding through tuition fees (Ohkawauchi and Tanaka, 2024).
Influencing the design of the online environment
Through the data collection, it became apparent that lecturers were not using the Statistics eTool for the purposes of adapting or improving their online learning environments. The researchers then selected random participants and explored their course sites pre- and post-COVID to establish what, if anything, had shifted or changed. It was discovered that during COVID, with the forced, sudden move to fully online learning, lecturers used the LMS to share content and learning materials which could be accessed asynchronously, while online classes were synchronous using Zoom, Microsoft Teams or Google Meet. Post-COVID, the LMS has been used for interactive lesson design, discussions, chats, quizzes, etc., with a greater social learning component to supplement the in-person teaching and learning, resulting in a more blended approach. No generalisations can be made from this; however, it is interesting to note the different ways in which the LMS has functioned during and after COVID.
Although the Statistics eTool has the potential to give insight into the areas within the online environment that students readily engage with and highlight which resources are underused, it was not used to make any design changes or improvements to the online environments of the participants in our study. Most lecturers indicated that they set up their online environments and then kept them the same way regardless of the engagement or lack thereof. However, one interviewee was prompted to explore this going forward, stating, “I think maybe that is something that I can investigate”, which also demonstrated that perhaps it had not been considered for that use before, but through the new awareness, there was an interest in using it to improve the course site/s. It is important for lecturers to regularly consider whether their online environment is engaging students or whether it should be updated to accommodate the needs of each student cohort. As Alhazmi et al. (2021) mention, lecturers are responsible for “designing learning activities that encourage and provide peer communication and participation opportunities” while additionally ensuring “creative and relevant academic content in the LMS”, which positively impacts student learning (p. 142).
The Statistics eTool, therefore, allows lecturers to gather information regarding students’ activities and engagement within the LMS; this includes but is not limited to reporting, identifying “at risk” students, validating academic claims and influencing the improvement of content design.
In future research, the authors hope to delve into the reasons the Statistics eTool has been underused in relation to course site design at the institution.
Conclusion
Through the study, researchers identified that the Statistics eTool holds the potential to assist lecturers in the tracking and monitoring of students, specifically for identifying those who are “at risk” and preventing failure or dropouts. As the institution continues promoting a blended learning approach, it is essential that staff are continually made aware of the Statistics eTool and the varied benefits of using it. It would be beneficial for staff who are actively using the Statistics eTool within the LMS to continue doing so and to encourage other staff to use the eTool for the improvement of teaching and learning activities.
From the data, researchers deduce that at this time, several staff members at the institution are not fully aware of the capabilities and benefits of using the Statistics eTool. With the eTool only active on 56.2% of the online modules within the LMS in 2024 and no way to establish whether it was being used by all 56.2%, greater awareness among UWC staff would be beneficial. Once further awareness is created, lecturers and students will benefit through early detection and intervention with “at risk” students; easier reporting on student engagement and understanding; better online module design that caters to the needs of various students; accurate records to support and validate claims by students; and efficient tracking and monitoring of students to ensure student success.
Limitations to the study are that it was only based at one institution and that the sample group was small because of a low response to the call for participation. The researchers also acknowledge that a second limitation was that an interesting, new and unexpected finding emerged post-data collection, which could not be further pursued because of the timeframe of the study. Hence, the decision was made to explore the limited use of the Statistics eTool for course site design in future research.
Researchers believe it would be beneficial for future research to be conducted on a test group of lecturers at the institution who have undergone training on the Statistics eTool and are fully using it and then to assess how it shifts or impacts their teaching and learning practices and student success.
Furthermore, research focusing on the design and development of pedagogically sound, interactive online environments through the utilisation of Statistics eTool data would be beneficial to staff at the institution and beyond. This was an area that most staff at UWC were not using the Statistics eTool for at the time of the study, and it would support the view “that learning is a process of acquiring new knowledge, which is active and complex” (Givi Efgivia et al., 2020, p. 211). In addition, as Goldie (2016) states, learning is activated when students connect and participate within a learning community; therefore, lecturers should identify when students are not engaged and make adjustments where necessary to ensure the majority of students successfully engage in the learning process and content.
Note
The participant means “track”.