In the targeted school in the Cleveland Metropolitan School District, teachers focus on differentiating instruction with technology-based software. Differentiated instruction is the chosen teaching strategy over direct instruction because students and teachers alike prefer to work in cooperative groups while using technology in the classroom. Compass Learning is an Internet-based software program that differentiates instruction, prescribes learning paths, allows students to work cooperatively, and increases overall student achievement in reading skills for the targeted students. As a whole, teachers' surveys suggested that teachers' knowledge of overall technology-based instruction increased because of using the Internet-based software package.
Introduction
Should educators differentiate instruction, or should they use direct instruction when using Internet-based software in the K-12 classroom? This article is based on a comparison of differentiated instruction and direct instruction in the field of educational technology. This line of research is for teachers, students, educational policymakers, curriculum alignment specialists, and professional development facilitators who are concerned with how to provide students with technology-based instruction effectively. Abundant research indicates that direct instruction is the preferred style of teaching in urban schools. However, in the Cleveland Metropolitan School District (CMSD), the largest urban school district in Ohio, the learning program of choice is Compass Learning. Compass Learning is software that has substantial outcomes in increasing the reading achievement of minority students who live in poverty. In addition, Compass Learning Internet-based software, which differentiates instruction with computer-assisted instruction (CAI) and cooperative learning, is used to change daily teaching practices.
Comparing Direct Instruction with Differentiated Instruction
Schug, Tarver, and Western (2001) described direct instruction as being skills-oriented and emphasizing the use of small group, face-to-face instruction by teachers and aides, using carefully articulated lessons in which cognitive skills are broken down into small units. By contrast, differentiated instruction is a teaching philosophy based on the premise that teachers should adapt instruction to student differences. In urban schools, students of varying abilities and cultural backgrounds have a variety of learning styles. No single style is the correct approach to teaching for all students. However, in the comparison of both models, the author suggests that differentiated instruction with Internet-based software is the best method of teaching urban school students.
Based on Engleman's theory of instruction, there are six identifying steps the in Direct Instruction Library worksheet: introduction, development, guided practice, closure, independent practice, and evaluation. Each step in the process is linked to the others. First, the introduction stage is where the teacher gains the attention of the learners. Next, in the development stage, the teacher explains the required task by modeling for the learners. The students are able to work on the task with guided practice. The teacher assists the students in meeting the targeted outcomes. Next, an exemplary teacher concludes each lesson by reflecting on key points of the lesson. Then, at this point in the lesson, each student is able to work independently on the required task. Finally, the teacher assesses the students' work and their progress on the specified task.
Direct instruction and differentiated instruction are two different teaching strategies. In direct instruction students work in whole group. The teacher explains the task to the students based on targeted learning outcomes. Students work in a large group on the required task in a timely manner. On the other hand, students who work in a flexible and/or cooperative group are guided with the strategy of differentiated instruction. The students in the group work together to master a set of skills depicted and explained in detail by the teacher. The teacher provides instruction based on the uniqueness of each student and his or her specific learning style. In differentiated instruction, students and teachers collaborate with one another to meet the targeted goals (Tomlinson, 2001).
Differentiated Instruction Improves Urban Student's Achievement in Reading
The No Child Left Behind Act of 2001 sets the standards for all students regarding their right to a quality education regardless of gender, ethnic background, and socioeconomic status. The performance standards describe what students should know and be able to do on the Ohio Achievement Tests at three achievement levels: basic, the level at which students score 243 points, showing partial mastery of skills; proficient, at which students score 281 points, indicating competent knowledge of the subject matter; and advanced, at which students score 323 points, indicating superior achievement.
The Alliance for Excellent Education (2002, 2003) found that about 6 million middle school students read below grade level in the United States. On the 2005 National Assessment of Educational Progress (NAEP, 2005), 43% of eighth graders who qualified for free lunch scored below the basic level, compared to only 19% of eighth graders who did not qualify for free lunch. Among African American eighth graders, 48% scored below the basic level, and among Hispanic students, 44% scored below basic. Only 18% of White students scored below basic in reading. In an urban school setting, differentiated instruction has proven to be effective in increasing student achievement in reading.
Compass Learning: Differentiated Instruction Software
Compass Learning Odyssey Reading is an educational software program that incorporates differentiated instruction in writing and listening activities. The supplementary computer-based reading program is a tool used by educators at Nathan Hale School in Cleveland, Ohio, to increase reading achievement and skills through thematic units. A teacher guide to differentiated instruction for all learners accompanies the reading and English language arts thematic unit.
Students advance through the software consecutively by following the prescribed path of instruction based on results of the assessment test. The recommended schedule is for each student to spend three 40-minute sessions each week working through the software program cooperatively in groups of two to five. According to Compass Learning (2000), the lessons are thematic and follow the same pattern:
A prereading activity introducing new academic ideas;
A digital presentation of the story; and
Comprehension exercises that focus on sequencing, main ideas, and predicting.
Reading Program
The reading program is used for skill development or as an intervention plan. Students working together in cooperative groups guide the learner's interactions with the media. Students discuss responses and collaborate to find meaningful answers to comprehension questions. The teacher may prescribe two different assessment tools: an individual lesson diagnostic, which assess the students' mastery of instructional objectives; or a criterion-referenced test on the computer that assesses key skills targeted by tests such as the Ohio Achievement Tests (Compass Learning, 2000). The lessons automatically repeat the lesson objectives through additional instructional activities until mastery is met. Mastery is considered achieved at 70% (Compass Learning, 2000). However, the teacher may change the mastery level to match the ability level of each student or group.
Effects of Compass Learning on Student Achievement
According to Slavin, Cheung, Groff, and Lake (2008), research reports have shown measurable effects when students used Compass Learning Odyssey Reading software; the median effect sizes were +0.19 for elementary students and +0.16 for middle school and high school students. Working with CAI, cooperative learning, and disadvantaged students, teachers had to be well informed and know what technology-supported cooperative-learning tools were available for them at little or no cost. Unlike teachers serving middle-class and financially well-off student populations, a very real concern for those serving disadvantaged students was access. Access to working technological tools, high-speed Internet, and multiple computers might be limited in both schools and homes. When they were planning cooperative projects and assigning homework for teams, teachers had to consider whether they and their students had access to computers.
Assisting Teachers in Using the Potential Benefits of Compass Learning: Differentiated Instruction With Internet-Based Technology
The personnel in the technology integration office of the school district selected Compass Learning Odyssey as the vendor for all kindergarten through eighth-grade reading classes. In a 2006-2007 report on selected schools that used Compass Learning in the district (CMSD Office of Research and Assessment, 2007), both students and teachers showed “statistically significant gains in technological skills that are complemented by integration of technology into practice” (Cobb, 2009, p. 1). The Internet-based software is a set of programs that were designed to improve the achievement of students in reading and the teaching practices of the instructor.
The teachers used differentiated instruction in the classroom by prescribing technology-supported cooperation, which enhanced student achievement. Most important, significant increases occurred in student achievement for students in the treatment group who used Internet-based software that differentiated instruction based on student needs and targeted learning outcomes. In the same way, teachers who were trained to use CAI and cooperative learning in quality professional development programs notably and effectively changed their teaching practices.
Students at the target school used Compass Learning Odyssey Reading, the CAI and cooperative-learning software program. Students in the treatment group engaged cooperatively in using CAI in an instructional sequence. Primarily, the instructional strategy of CAI and cooperative learning built upon student learning and mastery of skills. Clark (2001) indicated that instructional methods might equal learning outcomes, but with very different costs and access outcomes. Kalyuga and Sweller (2005a, 2005b) suggested that rapid assessments of a learner's degree of knowledge might shape the course of computer-based instruction to improve overall achievement.
Traynor (2003) found that using CAI improved instruction to a greater degree than using only traditional methods. This author found a causal relationship between the use of CAI and cooperative learning and student achievement of disadvantaged African American students. The results of the causal-comparative data analysis indicated that the use of CAI and cooperative learning were more effective than traditional teaching methods alone, confirming the findings of Clark (2001) and Slavin et al. (2008). Compass Learning is exemplary Internet-based software, according to Cheung and Slavin (2005), because effective CAI and cooperative learning programs are those that coincide with professional development and result in changed classroom practices, such as cooperative learning and comprehensive school reform.
Professional Development Training
Technology-based instruction in the classroom requires training. High-quality professional development is ongoing staff development at the school site for administrators, teachers, and other instructional staff to understand student needs and improve results (National Staff Development Council, 2004). Teachers at the targeted school come to the table with varying levels of ability, technology skills, and knowledge of computers. Professional development is a key factor in providing teachers with the mechanics that assist in understanding and applying the technology in differentiated instruction. The staff at the targeted school receive monthly technology-based professional development. The goals of the professional development sessions are well defined.
For the key liaison who provides urban teachers with the knowledge to differentiate instruction with technology, the first and major task is to define the goals of high-quality professional development (Fogarty & Pete, 2007). The professional development goals for the targeted school are based on the mission and vision outlined by the school district. Teachers are required to pursue professional development programs in technology-supported cooperation to assist teachers with integrating technology into their classrooms and to increase student achievement in reading.
Professional Development Activities: Technology and Classroom Management
The courses cover the integration of technology in the areas of getting started with technology, classroom management, enhancing the teaching process, the use of technology tools to share, and outreach training for the parents and the community members. Additional course offerings are made available to staff members from the WVIZ/PBS educational course schedules as well as professional development options offered by the district. WVIZ/PBS is a television station in the Greater Cleveland area that provides teachers with resources, which include professional development on how to use effectively technology the classroom. Therefore, teachers at the entry level, midlevel, and veteran level are able to choose professional development opportunities that are based on the teaching staff's varying levels of technological literacy.
Activities include development of lesson plans and projects in specific content areas to assist teachers in technology integration. Experienced professional development trainers from Compass Learning develop a customized implementation and staff development plan for the school staff. Teachers learn how to use technology solutions as part of the research-based instructional program in the school, how to assign integrated lessons based on student data analysis and relevance to instructional objectives and student's learning styles and instructional levels, how to integrate what students do on the computer with their learning experiences in the classroom, and how to generate and interpret reports.
Evaluation of Teacher Technology Use
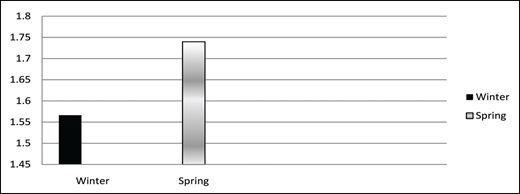
The evaluation data on teacher technology use was drawn from teacher surveys. The survey contained 15 questions that measured the teachers' use of technology-based and Internet-based software. The teachers who participated in the professional development were asked to rate their overall comfort level with the Internet-based software. CMSD Office of Research and Assessment (2007) reported that the teachers rated their degree of technological use of each of the software tools on a 5-point scale ranging from 1 (very low) to 5 (very high). Cronbach's alpha is an index of reliability associated with the variation accounted for by the true score of the “underlying construct.” Construct is the hypothetical variable that is being measured (Hatcher, 1994). An exploratory factor analysis was done with SPSS 12.01 software to reveal whether one or more constructs underlie individual scores on a set of measures or on a set of items (Gall, Gall, & Borg, 2007). Tested items performed well as a scale with adequate reliability (α = .946) for analyses. The average total scale in the winter was 23.58. Scores improved in the spring to 26.18. The analysis of the data shows a substantial change in the performance on individual items, the change was slightly less than what would be needed to achieve statistical significance (p = .070).
An exploratory factor analysis was performed with SPSS 12.01 software to reveal whether one or more constructs underlay individual scores on a set of measures or on a set of items (Gall et al., 2007). The tested items performed well as a scale with adequate reliability (α = .909) for analyses. The average total scale in the winter was 23.58. Scores improved in the spring to 26.18. The analysis of the data showed a substantial change in the performance on individual items, although the change was slightly less than what would be needed to achieve statistical significance (p = .070).
Although the results of the changes in the total score were not statistically significant, it should be noted that teachers reported increased use of technology from winter to spring. On average, teachers reported a 2.6 % increase in the use of technology-based software in the classroom.
The table is a summary of teacher responses on the technology usage survey. Several factors exist in dealing with educational technology software that might help or hinder the use of Internet-based technology from the beginning to the end of the school year. The analysis of the teachers' responses grouped seven component factors that were used to examine the use of learning technology; in other words, if a teacher answered one item in a certain way, he or she was likely to respond similarly to other identified items. The teachers at the targeted school reported an increase in their use of technology-based and Internet-based software and an increase in their comfort levels in using educational technology in the classroom.
The teachers' survey responses were detailed and decoded in the analysis process (see Appendix). The results showed that they preferred Internet-based software in 7 of 11 areas assessed by this scale. Careful analysis of the survey results shows that there were noticeable gains in the use of CAI to develop instructional content and lesson plans. The use of Web-authoring software to create ePortfolios also increased. In addition, teachers assisted students in creating digital video reflections about their overall achievement and technology use. Teachers who formerly expressed discomfort with using Internet-based software and ePortfolio development now have much greater comfort with using the software because of collaboration with other teachers, professional development activities, and adequate time to use the technology tools effectively.
The survey results showed that the teachers' overall technology use was comparatively stable from the fall to the spring. Overall, teachers reported moderate to high comfort with Compass Learning. Greatest comfort levels were expressed for the use of word processing tools, drill-and-practice computer resources, and the Internet-based software for research and reference (CMSD Office of Research and Assessment, 2008).
Conclusion
The teachers in the targeted school in the CMSD are dedicated to increasing student achievement, implementing standards-based instruction, using data-driven decision making, providing high-quality professional development, and using Internet-based software to enhance learning and teaching. Differentiated instruction has proven to be a valuable teaching model for teachers at urban schools. In the CMSD, teachers are able to use technology to differentiate instruction in reading. Compass Learning is a software tool that has been used to increase student achievement in reading. Differentiated instruction with technology is an effective tool for urban school students because the Compass Learning software has key assessments that are based on the ability of the students. Teachers are able to modify student progress and students are able to work together to achieve goals. eTech Ohio (2008) recommended combining differentiated instruction and Compass Learning, and resources with curriculum development and high-quality professional development, to establish research-based instructional methods.