


The current phase of the survey study is intended to investigate college students’ perception of instructor integrated use of mobile technology and its relationship with students’ affinity for technology and class modes, using 2 years’ data (2013 and 2015). Preliminary results suggest college students’ technology affinity, class modality, and year seem useful in predicting their perception of instructor-integrated use of mobile technology in the classroom. Of all, the more affinity for technology, the higher demand for the instructional use of mobile technology. Recommendations for researchers and practitioners are provided.
Introduction
In terms of strategy and execution, organizations are now moving away from production orientation to market orientation to better accommodate customer needs and expectations. Similarly, connecting information technology services to end users’ needs is one common business strategy. Higher education is no exception. More and more institutions of higher educations in the United States have adopted the mindset and invested in time and resources to make the connection (e.g., McKenzie, 2018; Raths, 2018). To offer better services in campus technology, universities conduct needs assessment through which they plan their desired performance and assess the actual performance in that regard.
The current phase of this survey study is intended to investigate college students’ perception of instructor-integrated use of mobile technology (IIT), its relationship with students’ affinity for technology (AFF) and class modes, using 2 years’ dataset (2013 and 2015). This goal is then translated into the following three research questions.
Is there any scientifically significant difference in IIT and AFF between 2013 and 2015?
To what degree do college students’ AFF and year predict their expected IIT in the classroom?
To what degree does preferred class mode predict college students’ expected IIT in the classroom when controlling for their AFF and year?
Review of Literature
Mobile devices show promise in teaching and learning. They have been found effective in supporting students’ active learning of information creation and evaluation and lend themselves to a decentralized, communal learning environment (Woxland, Cochran, Davis, & Lundstrom, 2017). One major method of mobile device use relevant to this study is the IIT. This is where instructors utilize mobile technology (e.g., laptops, tablets, and mobile phones) for the purpose of promoting better learning outcomes through the integration of such technologies into the classroom experience. Mobile devices have been shown to promote learning when used in an appropriate context with quality instruction from the educator (Yang & Che, 2015). Thus, it is worth understanding how the use of mobile devices without the proper structure or instructor support may not be enough in some cases and both factors should be considered in the utilization of mobile device-assisted teaching and learning. Among the benefits of mobile device usage includes active learning of which has been promoted with students’ learning becoming more personalized and contextual with the use of mobile learning in the classroom by promoting language communication rather than discrete learning (Tuttle, 2013). Such implementation of mobile technology can be done in either of two course modes of instruction, including face-to-face courses and online courses.
The technologies also present opportunities of promoting listening comprehension in the context of second language acquisition that upholds learner autonomy (De la Fuente, 2014). This is supported by a study on Taiwanese students learning English as a second language where participants self-reported having enhanced learning and improved motivation when using mobile learning devices and felt positive attitudes toward mobile learning in general (Yang, 2012). In a Delphi study by Aharony and Bronstein (2014), a panel of 35 learning experts claimed that mobile devices can assist in sharing and communicating information and also improve the interaction between the instructor and the students in a broader e-learning setting. Despite all that, Biddix, Chung, and Park (2016) noticed certain cultural differences remain salient in their investigation of U.S. and Korean faculty use of mobile technologies.
Meanwhile, as mobile devices (e.g., tablets) ownership continues to grow in college student body, their general usage has gone up and also received much attention in higher education (Pearson, 2015), across various disciplines (e.g., Buzzelli, Holdan, Rota, & McCarthy, 2016; Irby & Strong, 2015; Shadiev, Hwang, & Huang, 2017; Woxland et al., 2017), and outside the United States as well (e.g., Aharony & Bronstein, 2014; Kafyulilo, 2014; Santos, Bocheco, & Habak, 2017). In a 2017 study, 94%of student participants (n = 71) owned or had access to mobile devices, with 76% owning 1 to 2 devices and 20% owning 3 to 5 devices, and 91%of all students having brought their mobile device(s) to campus daily (Drew & Forbes, 2017). This is in line with a study from 2012 where it was shown that 98%of all college students who own at least one mobile device use it for educational purposes, with most students using three devices on a daily basis (Violino, 2012). This phenomenon seemed to have brought opportunities and challenges to administrators, staff, faculty, and students in higher education. In surveying 100 United Kingdom undergraduate students, Derounian (2017) found the top three strengths associated with the use of mobile devices are: making open-access materials handy, extending learning out of the conventional classroom, and taking advantage of mobile devices that are already popular with students. The top three reported weaknesses associated with mobile device usage are: being bored in class, student distraction, and addiction to mobile devices. Derounian continued and stated that the top three opportunities these college students perceived in the context of mobile learning are cosharing learning space and time between instructors and students, effortless transfer from personal use of already familiar social media to school use of similar applications, and cultivating digital literacy, which in turn leads to success in school and life in general. These perceived opportunities highlight students’ AFF, or the increased interest/liking of technology, as students appear to gravitate toward the use of such technologies for the educational purposes (Violino, 2012). Last, the top three threats perceived are used devices not serving learning purposes, disagreement between the instructor and students in device use for learning, and vulnerability of mobile devices to cheating (Derounian, 2017). Part of the reason for the increasing popularity of mobile devices appeared to be their capability of constructing authentic learning environments that transcend time and space for learning (Shadiev et al., 2017).
With mobile devices as tools, methods that incorporate the tools in the curriculum appears critical. In a Delphi study, composed of three rounds of observations through a 30-member agricultural education faculty panel, Irby and Strong (2015) discovered 48 competences required of professors to develop teaching and learning strategies for mobile learning. The top three competences these panel experts agreed upon are related to (a) learning facilitation, (b) ability of course management, and (c) clarity in communications. These competences, arguably, apply to faculty teaching without mobile technologies as well. The three are similar to competencies Moskal, Dziuban, and Hartman (2013) earlier uncovered as a result of a longitudinal review of nearly one million student end-of-class evaluations: “facilitation of learning,”“communications of ideas,” and “respect and concern for students” (p. 19).
As previously mentioned, mobile devices are found vulnerable to potential learning distraction (Derounian, 2017). In a randomized controlled trial, Carter, Greenberg, and Walker (2016) studied this alleged attention problem and found that students in a classroom where laptops and tablets are strictly prohibited significantly outperform their counterparts (who use laptops and or tablets to a varying degree in class). Nevertheless, their study was not intended to connect the dots between mobile device use and decreased achievement. Similar findings are also cited by Santos et al. (2018). The results of their survey study disclosed that students continue to use mobile devices for noncourse related activities in class in spite of likely disruption or distraction and instructorimposed restrictions on device use. Knowing that a total ban on use of mobile devices in the classroom may be overcompensating, the three researchers recommended a dialogue between the instructor and students and among students themselves to address the acceptable use and mitigate possible pitfalls. Likewise, in response to college students’ cyberslacking, Flanigan and Kiewra (2017) proposed that the instructors consider the following recommendations:
reject the digital native myth;
improve student awareness of cyberslacking;
adopt, rationalize, and enforce technology policies;
incentivize students to voluntarily relinquish mobile phones during class;
incorporate active learning experiences;
use mobile technology as a teaching tool;
teach students self-regulation strategies; and
motivate students to delay gratification (p. 589).
Above all, this survey study seems timely and able to contribute to the literature. The primary purpose of this quantitative inquiry is twofold. First, it is anticipated to build upon a previous study (see Pan, Sivo, & Goldsmith, 2016). Second, it is intended to explore how college students’ perception of IIT and their AFF are effected by year and preferred class mode.
Method
To further understand college students’ perception of instructor-integrated use of mobile technology, its relationship with students’ AFF and class modes, the three authors examined secondary data collected in collaboration with EDUCAUSE Center for Analysis and Research or ECAR in 2013 and 2015. Pertinent variables from ECAR, such as AFF, class mode, and year, among others, were collected as independent variables, and IIT as the dependent variable. Data were analyzed using SPSS 21. t test for independent samples and multiple regression analyses were performed. The 2 years’ data contained more than 2,700 responses of undergraduate students at a state university in South Texas. Specifically, in year 2013, n = 1903 valid responses of undergraduate students were collected, and in year 2015, n = 820.
Results
Data analysis results are presented to answer Research Questions 1, 2, and 3, respectively. In answering the first question, t tests for independent samples were performed to determine whether there is a significant difference in mean scores of IIT and AFF between year of 2013 and year of 2015. See Table 1 for the results.
| 2013 | 2015 | ||||
|---|---|---|---|---|---|
| M | SD | M | SD | t | |
| IIT | 2.82 | 1.69 | 3.25 | 1.42 | –6.73** |
| AFF | 3.76 | .978 | 3.67 | .95 | 2.30* |
Note: *p < .05; ** p < .01.
The results above indicated that there was a significant mean difference in IIT between year of 2013 (M = 2.824, SD = 1.688) and year of 2015 (M = 3.251, SD = 1.422); t(1,776.992) = –6.728, p < .001. This suggests that students in 2015, compared with those in 2013, expected more of their instructor’s incorporated use of mobile devices in the curriculum. A statistically significant mean difference in AFF between year of 2013 (M = 3.761, SD = .978) and year of 2015 (M = 3.667, SD = .95) was also found, t(2677) = 2.297, p = .022. It means that surveyed students in 2013 reported a higher degree of attraction for technology in general than those student participants in 2015.
To further examine the subsets of IIT and AFF, mean comparison analyses were conducted. IIT was broken into three variables: perceived integrated use of tablet in class, perceived integrated use of smartphone in class, and perceived integrated use of laptop in class. Results showed that (a) there was a significant mean difference in perceived integrated use of tablet in class between year of 2013 (M = 2.63, SD = 1.994) and year of 2015 (M = 3.14, SD = 1.732); t(1715.158) = –6.675, p < .001; there was a significant mean difference in perceived integrated use of smartphone in class between year of 2013 (M = 2.56, SD = 1.967) and year of 2015 (M = 3.10, SD = 1.7); t(1717.21) = –7.064, p < .001; there was a significant mean difference in perceived integrated use of laptop in class between year of 2013 (M = 3.28, SD = 1.845) and year of 2015 (M = 3.54, SD = 1.595); t(1719.357) = –3.732, p < .001. These results echo the finding about overall expected instructor use of mobile technology in the classroom. A similar analysis treatment was given to AFF.
AFF consisted of three manifest variables: AFF_Involved, AFF_Edu_Pln, and AFF_Conn_Univ. A t test for independent samples indicated (a) there was not a significant mean difference in AFF_Involved between year of 2013 (M = 3.5, SD = 1.205) and year of 2015 (M = 3.56, SD = 1.141); t(2,667) = –1.195, p = .232; (b) there was a significant mean difference in AFF_Edu_Pln between year of 2013 (M = 3.97, SD = 1.064) and year of 2015 (M = 3.57, SD = 1.194); t(1,354.329) = 7.975, p < .001; there was not a significant mean difference in AFF_Conn_Univ between year of 2013 (M = 3.82, SD = 1.124) and year of 2015 (M = 3.87, SD = 1.073); t(2662) = –1.022, p = .307. See Table 2 for the statistics aforementioned.
| 2013 | 2015 | ||||
|---|---|---|---|---|---|
| M | SD | M | SD | t | |
| IIT_Tablet | 2.63 | 2.00 | 3.14 | 1.73 | –6.68** |
| IIT_Smartphone | 2.56 | 1.97 | 3.10 | 1.70 | –7.06** |
| IIT_Laptop | 3.28 | 1.85 | 3.54 | 1.60 | –3.73** |
| AFF_Involved | 3.50 | 1.21 | 3.56 | 1.14 | –1.20 |
| AFF_Edu_Pln | 3.97 | 1.06 | 3.57 | 1.19 | 7.975** |
| AFF_Conn_Univ | 3.82 | 1.12 | 3.87 | 1.07 | –1.02 |
Note: **p < .01.
Results above suggest that even though students in 2015 (a) seemed more inclined to actively get involved in courses that use technology and (b) felt more connected to what is happening on campus than those in 2013, the difference was not significant enough. It is worth noting that students in 2015 reported a lower degree of technology usefulness in their future educational plan (e.g., degree transfer and getting into graduate school).
Research Question 2 asks, to what degree do college students’ AFF and year predict their expected IIT in the classroom, and Research Question 3 asks, to what degree does preferred class mode predict college students’ expected IIT in the classroom when controlling for their AFF and year. To answer the second and third questions, the authors performed a multiple regression analysis with two ordered sets of predictors. Set 1 predictors included AFF and year; Set 2 only contained preferred class mode. Expected IIT was the dependent variable. The design was intended to learn how AFF and year predict IIT and also how preferred class mode predicts IIT above AFF and year.
The results of the analysis using Set 1 as predictors suggested that student technology affinity and year account for a significant amount of their expected (instructor) use of mobile devices in the classroom, R2 = .11, F(2, 2,325) = 136.77, p < .01. This means that students in 2015 who have a higher liking for general use of technology tended to have higher expectation for faculty to use mobile technology in the classroom. The analysis using Set 2 as the predictor was conducted to evaluate whether preferred class mode predicts expected IIT more than AFF and year. The single predictor accounted for a significant, albeit small, increase in IIT, R2 change = .01, F(1, 2,324) = 19.163, p < .01. All these results indicated that students in the same year at the similar level of AFF are more likely to have higher expectation for mobile technology integrated into the curriculum if their preferred class mode is nonweb, instead of web.
For the sake of augment, another multiple regression analysis was conducted to predict IIT from AFF, class mode (nonweb vs. web), and year (2013 vs. 2015). These variables statistically significantly predicted IIT, F(3, 2,324) = 98.28, p < .001, R2 = .11, suggesting the regression model is a good fit to the data. All three variables added statistically significantly to the prediction, p < .01. The multiple regression model is represented as follows:
IIT = .54*AFF – .45*Mode +.50*Year – .86
The regression model indicates that (a) per unit increase in AFF, a .54 unit increase in IIT, on average, is predicted, holding all others constant, (b) given that class mode was coded 0/1 (nonweb = 0; web = 1), the predicted IIT score would be .45 point lower for students who perceived web courses as the learning environment they learn most than those who perceived nonweb courses as the learning environment they learn most, (c) year was also coded as a dichotomous variable (2013 = 0; 2015 = 1). For students of 2015, the predicted IIT score would be .50 point higher than students of 2013.
In short, college students’ technology affinity, class modality, and year seemed useful (as the regression model was found significant) in predicting their perception of IIT during class. AFF alone accounted for 9% (= .2932) of the variance of IIT, whereas class mode and year, combined, explained 2% (= 11% – 9%) of the variance of the dependent variable. Table 3 shows the bivariate and partial correlations of the predictors with IIT.
Discussion
Overall, the more AFF, the higher demand for the instructional use of mobile technology. When compared with those who prefer nonweb courses, undergraduate students in favor of fully web-based courses appeared less keen about instructor use of mobile devices in the virtual classroom. This could have been that students who take nonweb courses prefer electronic devices that are deemed more versatile and more portable as well as more fit for (physical) classroom use. A nonmobile device, such as a desktop computer, may be out of the question in this regard. It could be also that students who perceive that fully web-based classes allow them to learn the most tend to have a different mindset when it comes to the use of mobile devices. In their mind, the mobile devices may be better suited for teaching and learning activities in hybrid and/or face-to-face classes. It is also possible this may be due to the effect web-based learning has on the education experience, since research has shown students report poorer experience in distance learning than students receiving face-to-face tutoring (Price, Richardson, & Jelfs, 2007). The use of mobile technology in such a setting may only exacerbate the distance learning experience due to overreliance on technology.
In comparison with those in 2013, college students in 2015 also reported a higher demand for instructors’ integrated use of mobile devices in class. Yet, these students expressed a lower liking for technology overall than students in 2013. The surveyed students in 2015 perceived technology helps them plan future education to a noticeable degree, but just not as much as those students in 2013 did. Although their level of attraction for technology to prepare for future educational plans appeared lower than their counterparts, students in 2015 remained highly attracted to technology use in regard to (a) actively participating in classes with technology integrated and (b) staying on top of school news.
As more and more college students own mobile devices (see Figure 1), would or should this increased ownership affect the way the instructors design their course activities? Or, are the two matters even irrelevant?
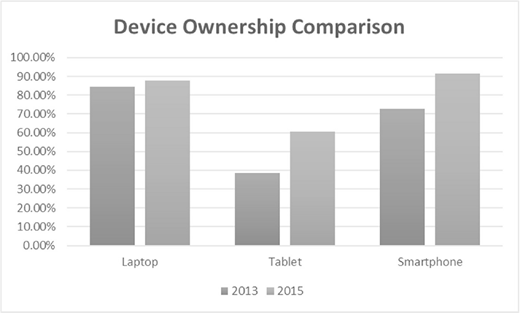
In this preliminary study, the authors seemed to have found the two were relevant to a degree. Future research along these lines may help shed some light on this possible nexus. Besides, web group was not as enthusiastic about instructors’ use of mobile devices nor planning much use of mobile devices in the class as nonweb group. Still, this is only the enthusiasm and perception of the use of mobile technology in either mode of instruction rather than outcome of use, as nontraditional students score significantly higher in outbound assessments when enrolled in online courses (Slover & Mandernach, 2018).
One key recommendation for interested decision- and policymakers at the institutions of higher education is to capitalize on the undergraduate students’ attraction to technology by (a) offering courses that incorporate technology in the classroom with proper instructor training (Yang & Che, 2015) to get improved active participation and learning using technology (Tuttle, 2013), (b) connecting students for campus events in real time via technology, and (c) allowing students to apply for graduate programs and transfer to another program using efficient technology. In the meantime, given the fact that students who view fully web-based courses as the optimal learning environment prefer a less degree of mobile technology integrated in the curriculum, the instructors who teach online courses may consider simplifying the use of mobile devices and getting more focus on how to achieve course-level objectives as stated in course syllabi.

