


Little research compares hybrid to online and face-to-face (F2F) teaching. Nearly all this research assumes no difference in the students’ demographics entering F2F, hybrid, or online sections of a course. This study used all the data from 5 years of undergraduate courses at Kennesaw State University. The data set, which includes individual student section outcomes, included entire student demographics. Students in hybrid sections earned higher final course grades than those in online or F2F sections for all demographics. Differences in demographics affected how advantageous the hybrid method is over the online and F2F methods.
Introduction
Researchers (e.g., Amparo et al., 2018; Stern, 2004) have studied the outcomes of pure online teaching compared to all-in-person (face-to-face, F2F) teaching, often called face to face in research. The literature review for this study yielded few research studies that compared hybrid teaching to online and F2F teaching (e.g., Lovern, 2010; Reasons et al., 2005). The term hybrid in this article refers to the traditional hybrid or flipped class where some of the class is in person and the rest online asynchronously. For example, a three- credit course meets for 11/2 hour a week for discussions and covers everything else online, including lectures and assignments. One can view hybrid education as a compromise between F2F and online teaching or alternately as taking the best parts of both. Another problem is that much previous research, such as McFarlin (2008), has considered only a single course or instructor. Some research, such as Blau and Drennan (2017), has considered student satisfaction with different methods and academic outcomes.
A possible gap in the research is that nearly all this research assumes that there is no difference in the characteristics or demographics of the students entering F2F, hybrid, or online sections of a course. The research gap identified is that there may be a difference in demographics between students who opt for one method over the others and that certain student demographic groups may do better proportionally in specific teaching formats. This research uses the entering characteristics of students, a large sample of many instructors, and the final mean course grade achieved to see if the benefits (including negative benefits) of hybrid and online over F2F methods depend on the characteristics of the entering student. Xu and Jaggers (2014) and Cavenaugh and Jacuemin (2013) hinted that student demographics could be different for the different methods.
This study used data across a whole university to investigate the demographic effect on student outcomes. No data after 2019 were used to avoid tainting because of COVID. This study is not an analysis of an experiment but an analysis of an existing data set, which existed before the study began. This study builds on a previous study that only used data from business school courses (Moodie, 2021).
Research Questions
The research questions examined were:
Are there any differences (both with demographics and previous academic achievement) in the students using the different teaching methods across a university?
Do students from different demographics and in different parts of the university have different student final grade outcomes in different methods?
LITERATURE REVIEW
Little previous research examined the differences in the type of students taking different methods, and the research assumed that students taking different were the same on average. We first report the conclusions of the larger research output that does not include hybrid courses. The minor research includes hybrid courses, such as Rivera (2016), who pointed out that the hybrid allows the hands-on lab experience that online cannot give for science courses.
Online to F2F Comparisons
Many studies, with sample sizes ranging from very small to very large, have compared the outcomes of online versus F2F courses. The following is a selection of some of the latest studies.
No Examination of Student Demographics
Stern (2004) examined online and F2F instruction for one course and concluded that the online method works as well as F2F if online instructors have enough time to do a thorough job. Sapp and Simon (2005) compared grades for online and F2F writing courses. They showed that more students thrived (A or A-) in F2F courses than in online courses (32% to 52%). Summers et al. (2005) examined grades for online versus F2F for a statistics course. They found no significant difference between methods of teaching. Kelly (2009) reported that she could find no significant difference between student grades for online and F2F methods. She did not control for entering grade point average (GPA). Dell et al. (2010) found no differences between online and F2F sections of a graduate human development and an undergraduate psychology course. Ni (2013) found no significant differences in outcomes between online and F2F classes. Amparo et al. (2018) used a large sample (96,000 students) across two institutions to compare online and F2F results. They found that F2F students outperformed online students in course final GPA. Blau and Drennan (2017) used students' perceptions to compare different teaching formats and suggested that universities find ways to increase the perceived favorability of online and hybrid courses for those that prefer F2F.
None of these studies examined whether the previously more successful students preferred a particular teaching method. In conclusion, most previous research, which compared online and F2F sections of courses, did not examine differences in precourse GPAs or any demographics of students. They found no significant difference in final course grades between methods or that online courses achieved worse final course grades than F2F ones.
Examination Included
Student Demographics
Cavanaugh and Jacuemin (2013) used a large sample size (5,000 courses) in one institution. They found no significant differences overall between online and F2F classes. They did find that students with good precourse GPA did better than those who did not have a good GPA. Online courses increased the effect of a higher precourse GPA. They also found that better students tended to do online courses, as the mean precourse GPA was 3.41 for online students, while only 3.02 for F2F students.
Xu and Jaggers (2014) researched an extensive data set of online and F2F courses (500,000 student-course sets). They did allow for differences in precourse GPAs. They found that males, younger students, Black students, and those with lower precourse GPAs did worse in online courses, while females and Asians had no significant differences. Older students did better in online courses. They also looked at the subject matter and reported that computer science, communication, and health had no significant differences. All others had F2F giving better results than online courses. The social sciences, business, law, and nursing showed the most significant differences. The teaching method affected starting students more adversely than continuing students.
Nguyen (2015) summarized research comparing F2F and online teaching methods. He found that, generally, the research considers online learning as better, but there were problems with much of this research due to selection bias and a lack of rigorous methodology. Amro et al. (2015) showed that F2F students got higher grades than students studying online for their algebra courses. Although they looked at age and gender factors, they did not look at precourse GPAs to see if the students were similar in academic ability.
Biel and Brams (2016) compared student performance in online and F2F courses. They encountered mixed results; some studies showed that the F2F course was better than some online courses. Sun and Chen (2016) reviewed 47 papers comparing online and F2F teaching methods. They concluded that online teaching works as well as or better than F2F if done correctly. An effective course has well- designed content, motivating interaction, and well-prepared and supported instructors.
Most studies did not look at the effect of demographic factors. However, Cavanaugh and Jacuemin (2013) found that students, who had been more successful previously, tended to choose online courses. Xu and Jaggers (2014) reported that the outcome differences between online and F2F depend on race, gender, previous GPA, and age. They showed that older students did slightly better in online courses. These two studies hinted that demographics and precourse GPA might affect course outcomes. Blau et al. (2019) used the students’ intent to transfer as an output measure.
Hybrid Comparisons
Studies That Did Not
Examine Student Demographics
Several studies compared hybrid to either or both F2F and online methods. Reasons et al. (2005) examined the three teaching formats and concluded that online was better in achieving a higher mean final course grade than hybrid or F2F. McFarlin (2008) examined grade results for hybrid and online sections. He found that student learning, as represented by grades, increased in hybrid and online sections compared to F2F sections. Lovern (2010) found no significant difference in outcomes between online, hybrid, and F2F sections of the same course. They did not examine precourse GPA self-selection. Son et al. (2016) looked at a lab class they offered in the three formats. They concluded that grades were highest in a hybrid method and lowest in a purely online format.
Studies That Looked
at Student Experience
Mansour and Mupinda (2007) looked at students’ experiences rather than outcomes in online and hybrid classes. They found that students preferred hybrid classes, but some preferred online courses. The difference may be reflected in the students’ learning styles. Senn (2008) reported on student perceptions in the three methods for one course, and he concluded that students felt that hybrid sections were more difficult for his technology-heavy course.
Larson and Sung (2009) looked at hybrid sections and online and F2F. Unfortunately, they used student perceptions of learning effectiveness, not actual learning achieved, as a variable. They did not look at whether students self-select types of courses by their precourse GPA. They showed that students preferred hybrid over online and online over F2F.
Yuen (2011) concluded that teachers and students liked blending learning in terms of easier communication between parties and constant availability of resources and technology-assisted self-learning time, namely when students could not contact a teacher.
Kemp and Grieve (2014) looked at student preferences and outcomes between F2F and online activities. They found no difference in learning outcomes but found students preferred online for written assignments and F2F for discussions. Goerke (2018) examined the three methods of training for one Air Force course, and she found no difference in customer satisfaction between the three methods. Cathorall et al. (2018) assessed student performance in hybrid and online classes, and they found no difference in student grades but higher student evaluations in online courses.
Studies That Examined
Student Demographics
Brau et al. (2010) reported completion and success results in a course transitioning from F2F to hybrid and online methods. They found that completion rates increased significantly, as did success rates. They did not think this was due to better students entering online and hybrid sections, and hybrid sections had higher completion rates than online sections.
Price et al. (2016) looked at different factors on student performance and satisfaction across methods. They looked at age, sex, interaction, clarity, control, and motivation. They found little correlation between age or sex and student outcomes. They found that course design (participant interaction, learner control, and course clarity) affected student outcomes, and the method had no significant effect. Kim and Keuegar (2017) compared hybrid and F2F courses. They concluded that using two formats, F2F and online, in the same course can be challenging for instructors. Baum and McPherson (2019) examined learning in online and hybrid sections, taking into account the academic weakness of entering students. They suggested that students with weak academic backgrounds and other risk factors, including socioeconomic status, struggle in online classes, and hybrid classes, do not exhibit these problems.
The research that includes student differences showed it sometimes affected student outcomes. In addition, they found that hybrid sections often achieved better outcomes than either online or F2F sections.
ANALYSIS
The Data Set
Kennesaw State University (KSU) provided every student-course record in KSU's Banner system from 2015 to 2019 for all KSU undergraduate courses. The study did not use later data available because of the effects of COVID-19. KSU has offered COVID synchronous online, plus rotating hybrids, standard hybrid, full F2F, and asynchronous online sections. KSU has also told faculty to give students the benefit of the doubt when grading, and many pure F2F faculty had to teach online for the first time with little or no training. Thus, the study considers any data after 2019 as tainted.
The researcher removed from the data set all student-record data that had no grade awarded or had a grade of I (incomplete), S (satisfactory), or U (unsatisfactory), as these grades did not give a full indication of student learning.
Each student-course record set originally consisted of the following:
An arbitrary random number instead of student name. The researcher deleted this column from the working database as not useful.
Final course grade in letters. Letter grades were converted to numbers: A = 4, B = 3, C = 2, D = 1, F = 0.
The previous overall university GPA of the student at the start of the course was missing for some students who were just entering KSU. Previous GPA varied from zero to four. Starting transfer and first- year students would have no previous GPA. The analysis only deleted the students with no previous GPA when examining the effect of previous GPA analysis only.
Age varied from 14 to 75. The study removed all those under 18, a small number, for institutional review board reasons.
The analysis converted teaching method [online (OL), hybrid (Hy), or all-in-person (F2F)] to zero-one variables. That is online is [1, 0, 0], hybrid is [0, 1, 0], and F2F is [0, 0, 1] for columns online, hybrid, and F2F.
Term-Fall, Spring, or Summer. Some analyses used one for summer and zero for fall or spring because the summer term is a different length (2, 4, 6, or 8 weeks, rather than 15 weeks).
Calendar year.
Course name, consisting of discipline and number.
College.
Academic department home of the course. I deleted extraneous courses offered through non-KSU-only entities.
Course number. The first digit of course number gave the course level (1 = freshman, 2 = sophomore, 3 = junior, or 4 = senior)
Sex of student. This researcher converted this to male = 1, and female = 0.
Reported ethnicity converted an ethnicity of Alien, Asian, Black, Hispanic, Multiethnic, and White to zero or one variable. For example, Alien was [1, 0, 0, 0, 0, 0] for columns Alien, Asian, Black, Hispanic, Multiethnic, and White. Other ethnicities, such as American Indian, Hawaiian, and Pacific Islander, were grouped under the term Pacific and would be [0, 0, 0, 0, 0] for Alien, Asian, Black, Hispanic, Multiethnic, and White columns.
The analysis did not use Instructor ID, which was an assigned random number.
Previous number of F2F courses taken.
Previous number of hybrid courses taken.
Previous number of online courses taken.
These categories provided 939,917 student-course data records for the analysis. However, there were missing data under some demographics or circumstances, such as the first course the student took at KSU. As a result, the number of records was smaller for some analyses.
Basic Characteristics of the Dataset
Table 1 shows the basic properties of each variable in the data set. Note that hybrid student-section records are a minor (5.29%) part of the overall data set. In addition, ethnicities do not add up to 1, as some students did not choose an ethnicity (1.96%).
Properties of All Variables With Mean, Standard Deviation, or Percentage of Total Dataset (N = 939,917).
| Variable Name | Mean or % | SD |
|---|---|---|
| Course grade | 2.980 | 1.174 |
| Previous GPA | 3.113 | 0.600 |
| Age | 22.1 | 5.432 |
| Course level | 2.11 | 1.08 |
| Previous # F2F courses | 17.26 | 13.02 |
| Previous # online courses | 2.09 | 3.23 |
| Previous # hybrid courses | 0.925 | 1.36 |
| All in person method | 76.67% | — |
| Hybrid method | 5.29% | — |
| Online method | 15.86% | — |
| Summer term | 9.74% | — |
| Sex – % Male | 52.4% | — |
| Alien ethnicity | 1.99% | — |
| Asian ethnicity | 5.26% | — |
| Black ethnicity | 20.54% | — |
| Hispanic ethnicity | 9.9% | — |
| Multiethnic ethnicity | 4.52% | — |
| White ethnicity | 55.83% | — |
| Other ethnicities (incl. Pacific) | 0.11% | — |
Statistical Analysis
The statistical analysis used the final grade awarded for the course as the predicted variable and all the other variables as predictor variables. The research reports the most significant results from the many correlations in Table 2 and the most interesting results from many regression analyses of the primary data set in Tables 3 and 4.
Partial Correlation Results of All Variables With Course Final Grade
| Variable | Course Grade | Sex: Male | Summer Term | Age | Prev. # F2F | Prev. # Online | Prev. # Hybrid |
|---|---|---|---|---|---|---|---|
| F2F | –0.025 | — | — | — | — | — | — |
| Hybrid | 0.038 | — | — | — | — | — | — |
| Online | 0.004 | — | — | — | — | — | — |
| Sex: Male | –0.078 | — | — | — | — | — | — |
| White | 0.096 | 0.035 | — | — | — | — | — |
| Black | –0.119 | -0.056 | — | — | — | — | — |
| Hispanic | 0.016 | 0.028 | — | — | — | — | — |
| Asian | –0.017 | 0.000 | — | — | — | — | — |
| Multiethnic | 0.024 | 0.011 | — | — | — | — | — |
| Alien | –0.013 | –0.013 | — | — | — | — | — |
| Summer Term | 0.037 | -0.006 | — | — | — | — | — |
| Age | 0.003 | 0.041 | 0.105 | — | — | — | — |
| Previous GPA | 0.436 | –0.117 | –0.002 | –0.043 | — | — | — |
| Previous # F2F | 0.033 | 0.063 | 0.063 | 0.137 | — | — | — |
| Previous # Online | 0.012 | 0.096 | 0.081 | 0.270 | 0.104 | — | — |
| Previous # Hybrid | 0.021 | -0.088 | 0.046 | 0.032 | 0.208 | 0.161 | — |
| Level | 0.117 | 0.002 | 0.075 | 0.269 | 0.428 | 0.278 | 0.215 |
| Year # | 0.021 | 0.005 | 0.017 | –0.037 | –0.010 | 0.137 | 0.106 |
Note: Bold numbers are the correlations above 0.1. Columns with no correlations above 0.1 were excluded.
Regression on Course Grade Using All Predictors Without Previous GPA
| Statistic | Value |
|---|---|
| Multiple R | 0.933 |
| Adjusted R² | 0.871 |
| Standard Error | 1.149 |
| Observations | 939911 |
| ANOVA | df | SS | MS | F |
|---|---|---|---|---|
| Regression | 16 | 8370061 | 523128 | 396008 |
| Residual | 939895 | 1241605 | 1.3210 | — |
| Total | 939911 | 9611666 | — | — |
| Variable | Coefficient | Standard Error | t Stat | P Value |
|---|---|---|---|---|
| F2F method | 2.902 | 0.010 | 295.59 | 0 |
| Hybrid method | 3.066 | 0.011 | 276.62 | 0 |
| Online method | 2.918 | 0.010 | 280.02 | 0 |
| Sex: Male | –0.199 | 0.002 | –82.62 | 0 |
| White | 0.032 | 0.008 | 3.92 | 8.69E-05 |
| Black | –0.345 | 0.009 | –40.59 | 0 |
| Hispanic | 0.015 | 0.010 | 1.51 | 0.129811 |
| Asian | –0.122 | 0.009 | –13.57 | 6.4E-42 |
| Multiethnic | 0.113 | 0.012 | 9.55 | 1.29E-21 |
| Alien | –0.135 | 0.010 | –13.70 | 9.63E-43 |
| Summer term | 0.133 | 0.004 | 32.56 | 1.8E-232 |
| Age | –0.002 | 0.000 | –8.02 | 1.1E-15 |
| Previous # F2F | –0.002 | 0.000 | –21.26 | 3E-100 |
| Previous # online | –0.012 | 0.000 | –29.00 | 6.9E-185 |
| Previous # hybrid | –0.008 | 0.001 | –8.51 | 1.73E-17 |
| Level | 0.154 | 0.001 | 115.84 | 0 |
Note: Bold figures are regression coefficients above 0.1.
Results of Regression of Course Grade With Only Previous GPA Including Zero Previous GPA
| Statistic | Value |
|---|---|
| Multiple R | 0.944 |
| Adjusted R² | 0.892 |
| Standard Error | 1.053 |
| Observations | 798860 |
| ANOVA | df | SS | MS | F |
|---|---|---|---|---|
| Regression | 1 | 7308591 | 7308591 | 6596406 |
| Residual | 798859 | 885108.3 | 1.108 | — |
| Total | 798860 | 8193699 | — | — |
| Variable | Coefficient | Standard Error | t Stat | P Value |
|---|---|---|---|---|
| Previous GPA | 0.9548 | 0.00037 | 2568.3 | 0 |
Note: Bold figure indicates regression coefficient above 0.1.
As expected, the highest correlation is between the course grade awarded to the student in the course and the student’s previous GPA. One would expect a student with a high previous university GPA to get a high grade on a course. There is a correlation between course level and age, and there is a low correlation between course level and final grade. There is also a negative correlation between course grades with Black ethnicity. Next, the study reports some regression analyses.
This regression backed up the correlation analysis. Male is a negative predictor, and Black ethnicity is the highest negative predictor, followed by Alien and Asian ethnicities. Course level was also a positive predictor.
The most significant correlation with course grade was previous university GPA; the analysis ran a regression with only previous GPA with the results reported in Table 4. The results included those records with zero previous GPA, which were for those student courses where the students had failed all courses taken before. The exercise was without the records with blank previous GPAs, which were for those students that had not taken any previous courses at KSU.
Analysis of Method Effect
The initial analysis suggested that the teaching method relates to the final course grade, so the study analyzed more, giving the results in Table 5.
Mean Data for All Students by Instructional Method
| Variable | F2F | Hybrid | Online | All |
|---|---|---|---|---|
| Course grade | 2.959 | 3.163 | 2.988 | 2.975 |
| % | 78.86% | 5.29% | 15.85% | — |
| N | 741246 | 49709 | 148962 | 939917 |
| Sex: Male | 54.56% | 44.43% | 45.55% | 52.60% |
| White | 55.67% | 54.22% | 57.14% | 55.83% |
| Black | 20.54% | 23.24% | 22.08% | 20.93% |
| Asian | 5.26% | 4.60% | 4.06% | 5.03% |
| Hispanic | 9.90% | 9.23% | 8.18% | 9.59% |
| Alien | 1.99% | 1.74% | 1.39% | 1.88% |
| Multiethnic | 4.52% | 4.93% | 4.83% | 4.59% |
| Summer | 7.15% | 9.57% | 22.67% | 9.74% |
| Age | 21.78 | 22.11 | 24.34 | 22.20 |
| Previous # F2F | 14.79 | 14.67 | 14.56 | 14.74 |
| Previous # Online | 1.27 | 1.75 | 4.42 | 1.79 |
| Previous # Hybrid | 0.70 | 1.43 | 1.01 | 0.79 |
| Level | 2.073 | 2.325 | 2.229 | 2.111 |
| Previous GPA | 3.123 | 3.088 | 3.061 | 3.111 |
T Test for All Students by Method Comparisons
| Statistic | F2F–Hybrid | F2F–Online | Online–Hybrid |
|---|---|---|---|
| Mean Difference | –0.044 | –0.029 | –0.015 |
| Variance | 0.100 | –0.137 | 0.237 |
| Observations | 699536 | 592283 | 107253 |
| Degrees of Freedom | 46919 | 206958 | 71836 |
| t Stat | –7.680 | –8.341 | –2.321 |
| P(T ≤ t) one-tail | 8.1E-15 | 3.69E-17 | 0.0102 |
| P(T ≤ t) two-tail | 1.62E-14 | 7.39E-17 | 0.0203 |
| Method | Mean | Variance | Observations |
|---|---|---|---|
| F2F | 2.959 | 1.363 | 741245 |
| Hybrid | 3.003 | 1.263 | 41709 |
| Online | 2.988 | 1.500 | 148962 |
Separating results by teaching method shows that the hybrid method leads to higher course grades over the online method (5.85%) and online over F2F (0.98%). Note that the previous GPA for a hybrid is lower than online(0.88%), which is lower than that for F2F (2.02%), but the hybrid method leads to higher course grades for a lower previous GPA. However, these results are for all students. Online students had done the most online courses previously, while hybrid students had previously done the most hybrid courses.
The t-test results shown above show that all the differences in method course grade mean, although small, is significant. The t test between F2F and hybrid was 7.68, between
F2F and online was 8.34, and between hybrid and online was 2.32. Therefore, the differences in final grades between F2F and the other methods were highly significant, while that between online and hybrid was significant.
Analysis Using Previous GPA
Previous university GPA before the start of the course is a strong indicator of academic ability. Hence, one would expect students with high previous university GPAs to get better final course grades. The analysis split previous GPA into eight bands, where the number is lowest GPA of band and band includes up to the next GPA listed above. Note that the previous GPA “0" row is for those students who had only filed for a course before at KSU. Figures 1 and 2 show the effect of the previous GPA.
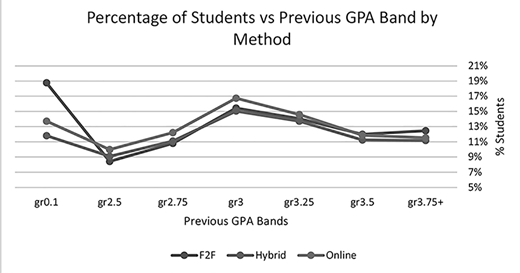
Percentage of Students by Previous GPA Band and Method
Percentage of Students by Previous GPA Band and Method
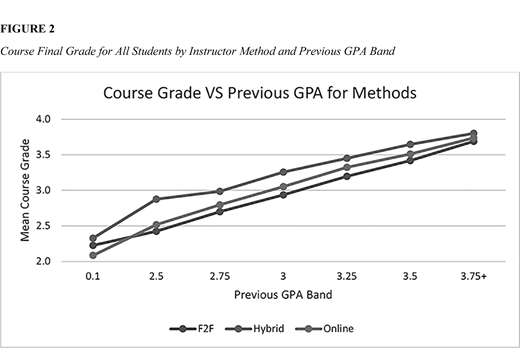
Course Final Grade for All Students by Instructor Method and Previous GPA Band
Course Final Grade for All Students by Instructor Method and Previous GPA Band
Note that the previous GPA band distribution was nearly the same for all methods except that F2F had far more than the previous GPA band of below 2.5. F2F has marginally more from higher previous GPA bands and online more from middle previous GPA bands.
This shows that whatever the previous GPA band, the mean final grade is better for hybrid, which is better than online (except for the lowest two bands), which is better than F2F. Again, for all methods, the average grade for students who had not done courses at KSU before is slightly less than that for all students.
Analysis Using Previous GPA and Sex
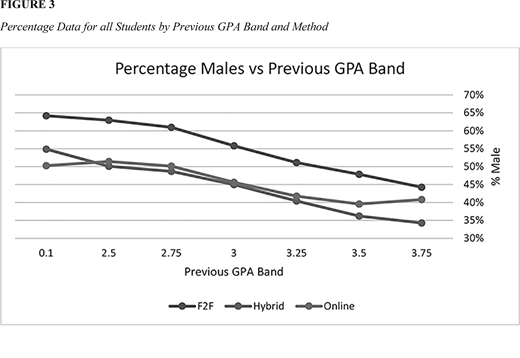
Percentage Data for all Students by Previous GPA Band and Method
Percentage Data for all Students by Previous GPA Band and Method
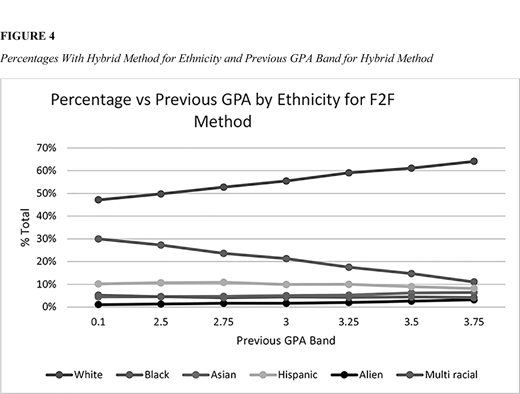
Percentages With Hybrid Method for Ethnicity and Previous GPA Band for Hybrid Method
Percentages With Hybrid Method for Ethnicity and Previous GPA Band for Hybrid Method
Note that the percentage of males increases with a lower previous GPA for all methods. The percentage of males is about the same for those doing first courses at KSU as the percentage for all.
Analysis Using Previous GPA and Ethnicity
Figures 4,,5, and 6 show the effect of the previous GPA when split by ethnicity by method.
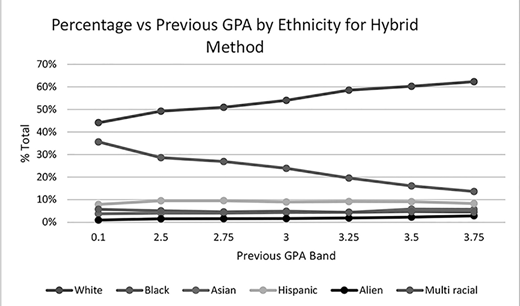
Percentages With Hybrid Method for Ethnicity and Previous GPA Band for Hybrid Method
Percentages With Hybrid Method for Ethnicity and Previous GPA Band for Hybrid Method
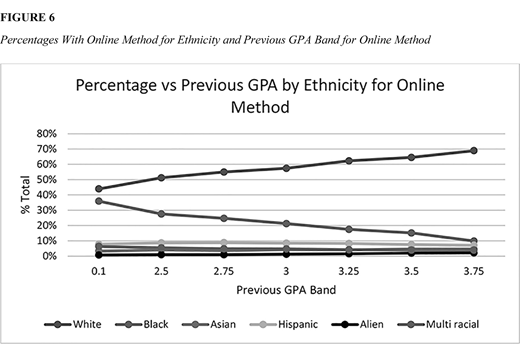
Percentages With Online Method for Ethnicity and Previous GPA Band for Online Method
Percentages With Online Method for Ethnicity and Previous GPA Band for Online Method
The percentage of the Black ethnicity increases with lower previous GPA for all methods. Note that the figures for students in the first courses at KSU are very similar to those for all.
Analysis for Sex
The analysis examined the results by vari ous student characteristics against the sex of the student and the method. Figures 7 and 8 summarize percentages and mean course grades by method.
Figure 7 shows that the overall sex balance is 52.6% male to 47.4% female. Despite this, females do more online and hybrid courses proportionally than male students. 18.2% of female student courses are online versus 13.7% for males. Proportionally, more female students (6.2%) do hybrid than male (4.5%) students.
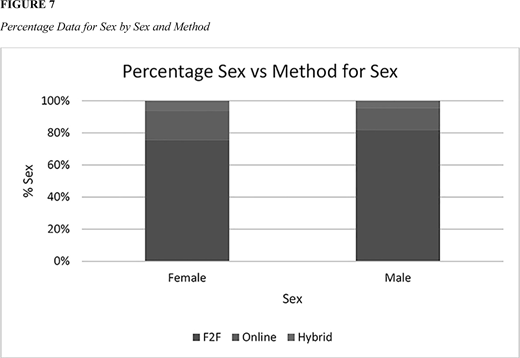
Percentage Data for Sex by Sex and Method
Percentage Data for Sex by Sex and Method
Figure 8 shows that hybrid is best for the final course grade for both sexes, but for females, F2F is better than online, while it is the opposite for males. Females get appreciably higher grades than males in all the methods, with the most significant differential in hybrid.
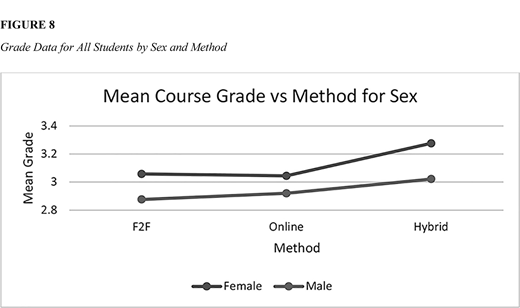
Grade Data for All Students by Sex and Method
Grade Data for All Students by Sex and Method
Analysis by Ethnicity
The study considered whether different ethnicities were better at doing specific methods for their courses. Some students reported N/A or unknown for ethnicity, and thus, this analysis did not use those. Note that the Pacific ethnicity is a combination of Hawaiian, Pacific Islander, and Indigenous American ethnicities, a tiny proportion of the whole student body. Figures 9, 10, and 11 summarize the data.
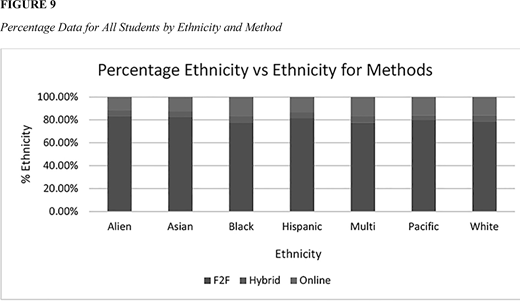
Percentage Data for All Students by Ethnicity and Method
Percentage Data for All Students by Ethnicity and Method
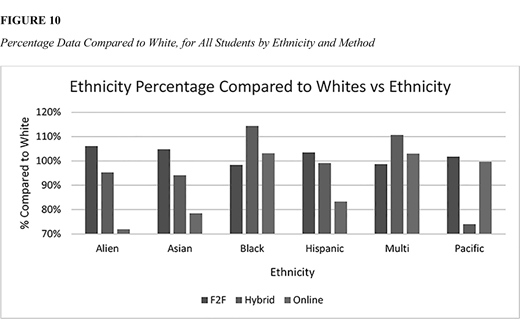
Percentage Data Compared to White, for All Students by Ethnicity and Method
Percentage Data Compared to White, for All Students by Ethnicity and Method
Notice that the Black ethnicity predominantly attends the most hybrid sections and the Pacific ethnicity the least. The Black ethnicity attends the most online and the alien ethnicity the least. ICE regulations limit alien students in the proportion of courses they can take online.
Here, the Alien, Asian, Hispanic, and Pacific ethnicities do more F2F sections proportionally. In contrast, the Black and multiethnic ethnicities proportionally do more hybrid and online sections. The Alien, Asian, and Hispanic ethnicities do far fewer online sections, and the Pacific ethnicity does fewer hybrid sections proportionally.
Note that for all ethnicities in Figure 11, the hybrid method produces the highest grade, and for all except the Hispanic ethnicity, online is better than F2F. The study now uses the White ethnicity mean as the base case in Figure 12, the largest ethnicity. So, the analysis compared the other ethnicities with the White ethnicity for the mean course grade.
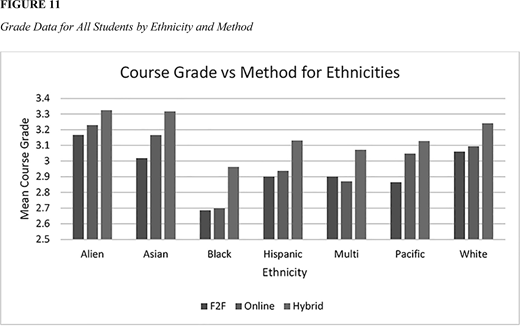
Grade Data for All Students by Ethnicity and Method
Grade Data for All Students by Ethnicity and Method
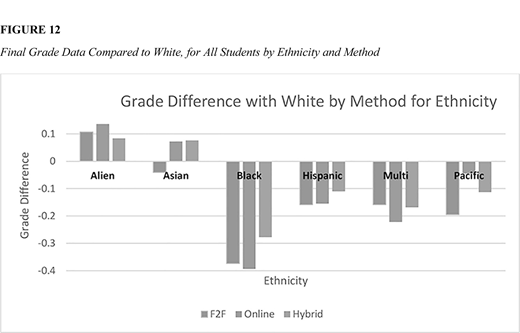
Final Grade Data Compared to White, for All Students by Ethnicity and Method
Final Grade Data Compared to White, for All Students by Ethnicity and Method
Note that the alien ethnicity does better than the White ethnicity in all methods. The Asian ethnicity has better grades than the White ethnicity in hybrid and online sections. However,the Black ethnicity reduces their deficit to the White ethnicity in hybrid sections, compared to F2F and online sections.
Analysis by Ethnicity and Sex
The analysis then separated ethnicities by sex in Figures 13 and 14.
The analysis then looked at the combination of ethnicity, sex, and method for course grade in Figure 15. Note that the Black and multiethnic ethnicities are the only ethnicities where there are more females than males.
Note that females have higher mean grades than males for all ethnicities and all methods, except the Pacific ethnicity, in online sections. The online proportion of the Pacific ethnicity is only 0.01% of the total student courses. The hybrid sections give the highest mean grade for all sex and ethnicity combinations.
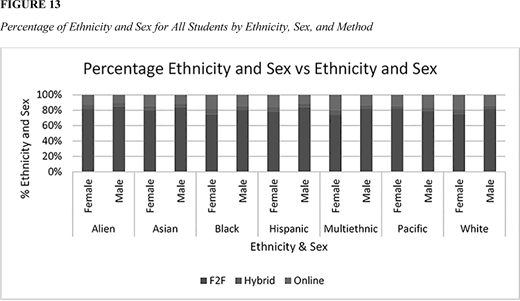
Percentage of Ethnicity and Sex for All Students by Ethnicity, Sex, and Method
Percentage of Ethnicity and Sex for All Students by Ethnicity, Sex, and Method
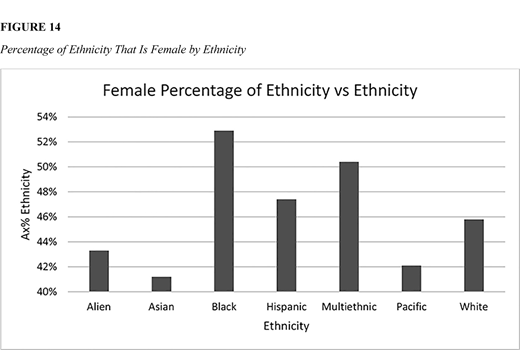
Percentage of Ethnicity That Is Female by Ethnicity
Percentage of Ethnicity That Is Female by Ethnicity
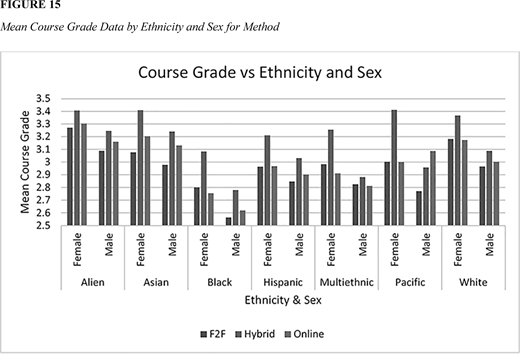
Mean Course Grade Data by Ethnicity and Sex for Method
Mean Course Grade Data by Ethnicity and Sex for Method
Analysis by Course Level
The study then investigated if the results varied by course level. Figure 16 shows some of the results.
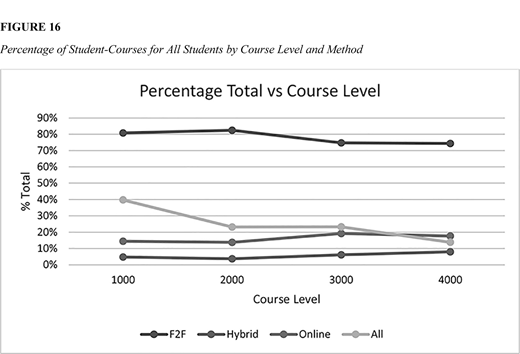
Percentage of Student-Courses for All Students by Course Level and Method
Percentage of Student-Courses for All Students by Course Level and Method
Note that overall, there is a drop in total student courses from the first-year students to sophomore years and from the junior to senior years. The percentage of hybrid and online student courses increased in the upper division. Interestingly, the overall mean final grade for all student courses is almost a B (3.975).
A hybrid has higher final grades than online and F2F at all levels. Online is almost the same as in all levels as F2F (marginally higher in sophomore and junior levels, and lower in freshmen level). Grades go slightly up with level for all methods. The mean F2F section grades at the senior level are higher than in online sections.
Analysis for Academic Term
The analysis looks at whether courses in summer have different student demographics and outcomes from the rest of the year. The summer term courses are 2, 4, or 8 weeks long, instead of 15 weeks for the other terms. KSU also emphasizes online teaching for the summer term. Figures 18 and 19 summarize the data for percentage and grade.
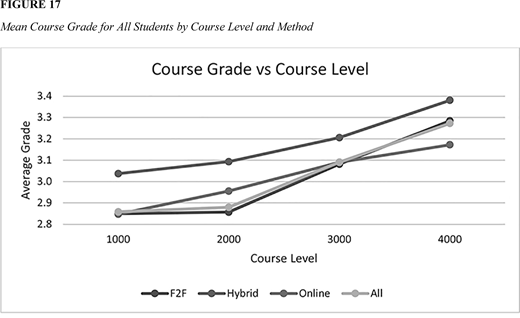
Mean Course Grade for All Students by Course Level and Method
Mean Course Grade for All Students by Course Level and Method
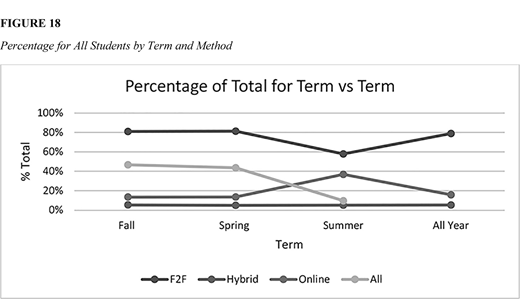
Percentage for All Students by Term and Method
Percentage for All Students by Term and Method
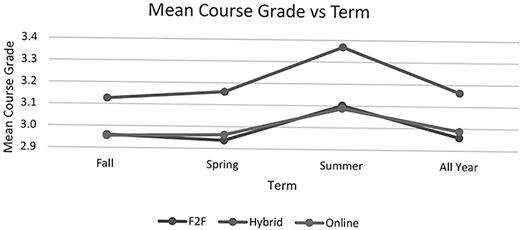
Mean Course Grade for all Students by Term for Method
Mean Course Grade for all Students by Term for Method
These data show that fall and spring are similar in method distribution, but summer has a far higher percentage of online sections. The hybrid percentage does not vary much with the term.
There is not much difference in F2F and online method course final grades for all terms. However, the summer term has higher mean grades for all methods, and hybrid is the best for all terms. There is little difference between fall and spring in mean grades.
Analysis by Year
The analysis next looked at whether these percentage results had varied with the calendar year and reported some results in Figures 20 and 21.
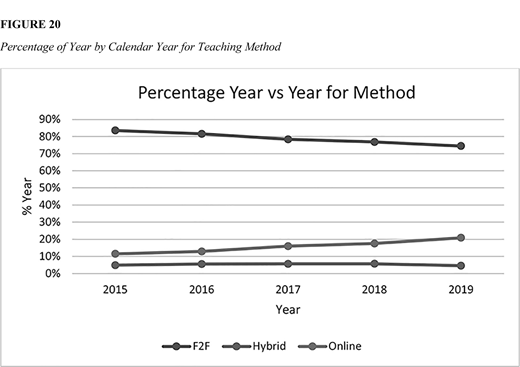
Percentage of Year by Calendar Year for Teaching Method
Percentage of Year by Calendar Year for Teaching Method
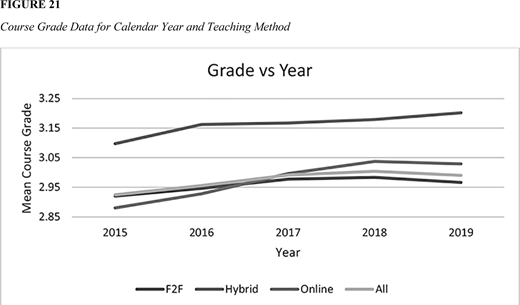
Course Grade Data for Calendar Year and Teaching Method
Course Grade Data for Calendar Year and Teaching Method
The percentage of online sections has been rising steadily while that of F2F decreased, and the hybrid percentage remained flat. The analysis next looked in Figure 21 at whether the course grade results had varied with the calendar year. Figure 21 shows that the hybrid method has produced superior grades for 5 years. Online, which was below F2F, is now just above F2F. There has been a general increase in all average grades year to year.
Analysis by Age
The analysis by student age, using 16 age bands, shows the percentage results in Figure 22. Each number for a band shows the lowest age in the band, with the band covering up to just below the next age band below.
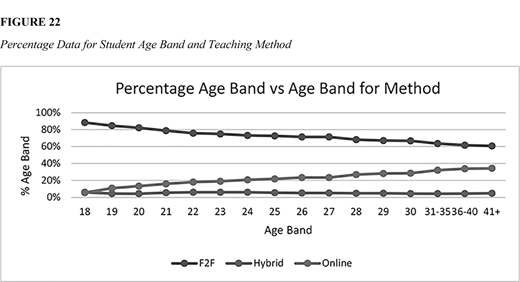
Percentage Data for Student Age Band and Teaching Method IAP PR
Percentage Data for Student Age Band and Teaching Method IAP PR
There is a decline in F2F and hybrid methods with the student age band. The analysis by student age shows the mean course grades in Figure 23. The data show that hybrid is best for all ages of students. Interestingly, the mid-20s course dips for all methods, and the best average grades occur in the over 40s.
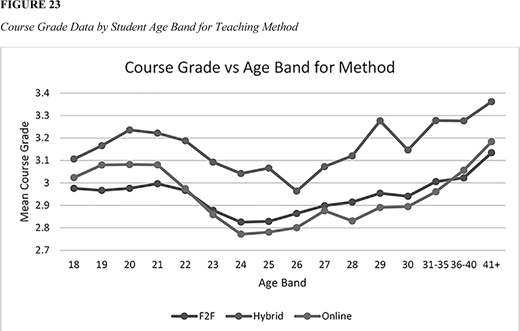
Course Grade Data by Student Age Band for Teaching Method
Course Grade Data by Student Age Band for Teaching Method
Analysis by College
The study reports in Figure 24 the relative size of the college and Figure 25 whether the college that offers a course affected the percentage of student demand with different methods.
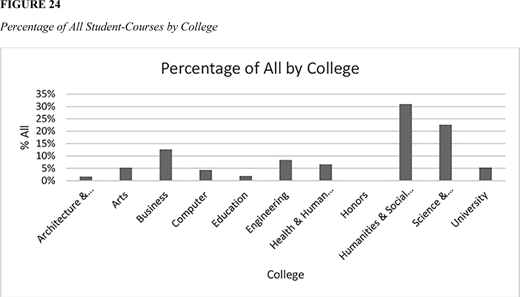
Percentage of All Student-Courses by College
Percentage of All Student-Courses by College
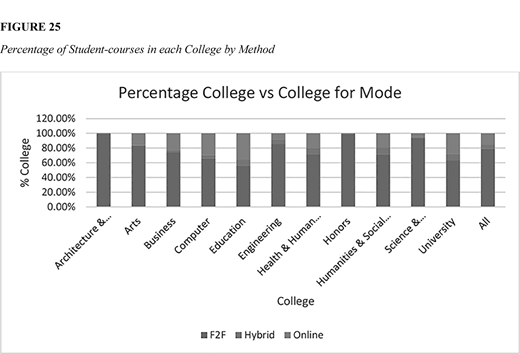
Percentage of Student-courses in each College by Method
Percentage of Student-courses in each College by Method
Note that all colleges, except Honors, offer both online and hybrid sections. Otherwise, the percentages vary a lot. Hybrid varies from 9.4% to 0.7%; online from 36% to zero. The study investigated whether the college that offers a course affected the average course grade with different methods and reported results in Figure 26.
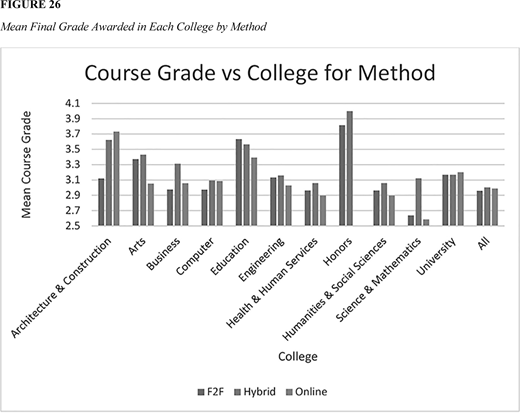
Mean Final Grade Awarded in Each College by Method
Mean Final Grade Awarded in Each College by Method
Note that hybrid sections have the highest mean grade in all colleges except three (in bold italics). University, and Architecture and Construction, which are tiny colleges, have their online section with the highest grades, while education, a large college, had F2F as the best.
Analysis by Department
The investigation then reported the percentage method data for each department in Table 7.
Departments had large variations in how they used teaching methods. Online use varied from 100% (Cybersecurity) to 0% (IT). Hybrid use varied from 34.3% (Industrial and systems engineering) to 0% (10 departments). The investigation then looked at each department's mean course grade data in Tables 8 and 9.
Distribution of Instructional Methods by Department
| Department | F2F % Dept. | Hybrid % Dept. | Online % Dept. | Dept. % All |
|---|---|---|---|---|
| Accountancy | 91.34% | 0.19% | 8.47% | 2.676% |
| Architecture | 100.00% | 0.00% | 0.00% | 0.801% |
| Art and design | 84.17% | 2.78% | 13.05% | 1.836% |
| Biology | 91.51% | 0.18% | 8.31% | 6.638% |
| Business college courses | 91.16% | 0.27% | 8.57% | 0.059% |
| Chemistry | 94.76% | 5.20% | 0.04% | 4.704% |
| Civil and environmental engineering | 91.27% | 3.52% | 5.21% | 2.424% |
| Communication and media | 67.67% | 15.85% | 16.47% | 3.643% |
| Computer engineering | 99.97% | 0.02% | 0.00% | 0.517% |
| Computer science | 85.18% | 4.73% | 10.09% | 1.599% |
| Construction management | 98.40% | 1.29% | 0.32% | 0.876% |
| Culinary and hospitality | 88.48% | 1.46% | 10.06% | 0.986% |
| Cybersecurity | 0.00% | 0.00% | 100.00% | 0.079% |
| Dance | 87.25% | 0.00% | 12.75% | 0.473% |
| Early childhood education | 88.03% | 5.31% | 6.66% | 1.134% |
| Economics, finance, Q&A | 88.18% | 2.91% | 8.91% | 4.647% |
| Electrical and computer engineering | 96.59% | 0.00% | 3.41% | 1.449% |
| Engineering technology | 81.85% | 8.15% | 10.00% | 0.980% |
| English | 69.61% | 13.91% | 16.48% | 6.791% |
| Exercise science and sport | 82.87% | 6.42% | 10.71% | 1.670% |
| First year, trans studies | 86.54% | 8.00% | 5.45% | 1.336% |
| Foreign languages | 80.91% | 4.07% | 15.02% | 1.788% |
| Geography and anthropology | 54.55% | 6.41% | 39.04% | 3.135% |
| Georgia Film Academy, USG | 100.00% | 0.00% | 0.00% | 0.024% |
| Government and international | 73.83% | 2.64% | 23.52% | 3.234% |
| Health and physical education | 65.68% | 8.23% | 26.09% | 3.307% |
| History/philosophy | 86.19% | 0.16% | 13.65% | 5.158% |
| Honor’s department | 98.98% | 1.02% | 0.00% | 0.073% |
| Inclusive education | 50.52% | 6.10% | 43.38% | 0.421% |
| Industrial and system engineering | 33.02% | 34.32% | 32.66% | 1.016% |
| Information systems | 47.18% | 1.51% | 51.32% | 1.433% |
| Information technology | 26.08% | 10.42% | 63.50% | 1.015% |
| Instructional technology | 100.00% | 0.00% | 0.00% | 0.128% |
| Interdisciplinary studies | 38.02% | 13.78% | 48.20% | 2.629% |
| Management, entrepreneurial, and hospitality | 59.48% | 5.08% | 35.44% | 2.631% |
| Marketing and sales | 55.88% | 0.52% | 43.60% | 1.520% |
| Mathematics | 94.45% | 0.28% | 5.27% | 7.915% |
| Mechanical engineering | 97.56% | 1.56% | 0.88% | 1.778% |
| Music | 83.29% | 0.22% | 16.49% | 2.083% |
| Nursing | 84.83% | 11.48% | 3.68% | 0.948% |
| Physics | 98.16% | 0.00% | 1.84% | 2.636% |
| Psychology | 60.86% | 24.53% | 14.61% | 3.497% |
| Robotics and mechatronics engineering | 99.98% | 0.01% | 0.01% | 0.251% |
| Secondary and middle grades | 71.16% | 20.80% | 8.04% | 0.296% |
| Social work and health sciences | 75.99% | 11.97% | 12.04% | 0.818% |
| Sociology and criminal justice | 68.15% | 0.41% | 31.43% | 3.275% |
| Software and game | 71.70% | 1.40% | 26.90% | 1.904% |
| Statistics and analytical science | 87.76% | 1.59% | 10.65% | 1.055% |
| Tech communication and interior design | 56.95% | 18.95% | 24.10% | 0.725% |
| Theater and political science | 76.65% | 0.98% | 22.37% | 0.960% |
| All | 78.85% | 5.29% | 15.86% | — |
| Mean | 77.3% | 5.4% | 17.4% | 2.0% |
Grade Data for All Students by Department and Method
| Department | All | F2F | Hybrid | Online | Best Method | Hybrid–F2F | Hybrid–Online | Online–F2F |
|---|---|---|---|---|---|---|---|---|
| Accountancy | 2.881 | 2.873 | 3.435 | 2.955 | Hybrid | 0.562 | 0.479 | 0.083 |
| Architecture | 2.878 | 2.878 | — | — | — | — | — | — |
| Art and design | 3.200 | 3.185 | 3.547 | 3.228 | Hybrid | 0.362 | 0.319 | 0.043 |
| Biology | 2.761 | 2.756 | 2.723 | 2.807 | F2F | –0.033 | –0.083 | 0.050 |
| Business college | 3.057 | 3.844 | — | — | F2F | — | — | — |
| Chemistry | 2.594 | 2.559 | 3.240 | 2.368 | Hybrid | 0.681 | 0.872 | –0.191 |
| Civil and environmental engineering | 3.046 | 3.064 | 2.975 | 2.777 | F2F | –0.089 | 0.198 | –0.287 |
| Communications and media | 3.022 | 3.016 | 3.137 | 2.956 | Hybrid | 0.122 | 0.181 | –0.060 |
| Computer engineering | 3.029 | 3.029 | — | — | F2F | — | — | — |
| Computer science | 2.899 | 2.929 | 2.438 | 2.859 | F2F | –0.491 | –0.421 | –0.070 |
| Construction manager | 3.353 | 3.348 | 3.623 | 3.731 | Online | 0.275 | –0.108 | 0.383 |
| Culinary and hospitality | 2.985 | 2.988 | 3.376 | 2.897 | Hybrid | 0.388 | 0.479 | –0.091 |
| Cybersecurity | 3.028 | — | 3.028 | — | Hybrid | — | — | — |
| Dance | 3.559 | 3.609 | 3.216 | — | F2F | –0.394 | — | — |
| Early childhood education | 3.581 | 3.605 | 3.537 | 3.299 | Online | –0.068 | 0.238 | –0.306 |
| Economics, finance, Q&A | 2.882 | 2.844 | 3.481 | 3.161 | Hybrid | 0.638 | 0.321 | 0.317 |
| Electrical and computer engineering | 3.074 | 3.076 | 3.030 | — | F2F | –0.045 | — | — |
| Engineering technology | 2.902 | 2.917 | 2.920 | 2.762 | Hybrid | 0.003 | 0.158 | –0.155 |
| English | 3.071 | 3.108 | 3.011 | 2.965 | F2F | –0.097 | 0.046 | –0.143 |
| Exercise science and sport | 2.969 | 3.258 | 3.630 | 3.473 | Hybrid | 0.373 | 0.157 | 0.215 |
| First year, transfer students | 3.220 | 3.304 | 2.759 | 2.554 | F2F | –0.546 | 0.205 | –0.750 |
| Foreign languages | 3.053 | 3.119 | 3.401 | 2.603 | Hybrid | 0.282 | 0.798 | –0.516 |
| Geography and anthropology | 2.996 | 2.944 | 2.876 | 3.046 | Online | –0.067 | –0.170 | 0.103 |
| Georgia Film, USG | 3.367 | 3.367 | — | — | F2F | — | — | — |
| Government and international affairs | 2.850 | 2.800 | 2.923 | 2.998 | Online | 0.123 | –0.075 | 0.198 |
| Health and physical education | 3.213 | 3.264 | 3.305 | 3.055 | Hybrid | 0.041 | 0.250 | –0.209 |
| History/philosophy | 2.746 | 2.770 | 3.104 | 2.589 | Hybrid | 0.334 | 0.515 | –0.180 |
| Honor’s department | 3.811 | 3.809 | 2.953 | — | F2F | –0.856 | — | — |
| Inclusive education | 3.480 | 3.529 | 3.461 | 3.424 | F2F | –0.069 | 0.036 | –0.105 |
| Industrial and system engineering | 3.269 | 3.363 | 3.265 | 3.180 | Hybrid | –0.098 | 0.084 | –0.183 |
Table 9 lists the number of departments for which each method was the best. These data show considerable variation in the best method for a department.
CONCLUSIONS
The base data set has only 5.29% of all student-course records in hybrid sections, which may mean that the results are heavily biased toward online and F2F methods. However, due to a large number of student-course records, this analysis probably gives out helpful information. The analysis also showed little difference in the type of student who did each method, except older students tended to do more online courses. The most important predictor of a student’s grade was their previous GPA, followed by ethnicity and sex. This research replicates most previous studies with larger student populations but more information on how student types affect the results.
Detailed Results for Course Final Grade
Method
Overall, average hybrid grades were higher than online and F2F grades, and there was a significant difference between the methods for the average course grade.
Previous GPA
The most significant predictor of a student’s final grade in a course was their previous university GPA at the start of the course. The breakdown of previous GPA bands was very similar across the methods, except the F2F method had a far higher proportion of previous GPAs below 2.5. F2F had marginally more in higher previous GPA bands, and online had marginally more in middle previous GPA bands. F2F also had a constant proportion of more males for all previous GPA bands.
Hybrid had higher grades for all previous GPA bands than online, which had higher than F2F. Grades for those who had not done KSU courses before were like the average of all bands.
While the percentages of students were nearly the same for all previous GPA bands, this was not true for the Black ethnicity. The Black ethnicity proportion increased for all methods with lower previous GPA.
Sex
Female students tend to get higher final grades than male students in all methods. However, hybrid is the best for both sexes, and Online is second best for females, while F2F is second best for males.
Ethnicity
Proportionally, the Black ethnicity has the highest percentages for hybrid and online methods, and Aliens have the highest percentage for F2F method. This difference is probably because ICE regulations limit Aliens’ use of online sections.
Aliens tend to get the highest final course grades, and Black students get the lowest grades. Hybrid gives the highest final course grades for all ethnicities. However, the hybrid advantage is most significant for the Black ethnicity and least for the Hispanic one.
Ethnicity and Sex
Proportionally, the Black people and multiethnic ethnicities have a higher proportion of females than males, and the other ethnicities have more males. For hybrid, the largest group proportionally are female Blacks, and for online, the largest group proportionally is multiethnic females.
For all ethnicities for all methods, except the Pacific online combination, females achieve higher grades than males of the same ethnicity. Hybrid methods give the highest mean grade for all combinations of sex and ethnicity.
Course Level
The percentage of students using the online and hybrid methods is higher for upper-division courses than lower division ones. However, the proportion of the total student courses for all methods drops with higher level. Approximately 40% of all student courses are for freshman classes. The course grade increase for all methods with course level. However, for all course levels, hybrid gives higher grades.
Course Term
There were proportionally far more online courses in summer terms. However, the hybrid proportion remained constant over the three terms. For all methods, summer courses had higher grades than other terms. For all terms, hybrid had the highest mean grades.
Year
While the proportion of online sections increased over the years, the proportion of hybrid student courses remained much the same. Grading within each method did not vary much with year, and hybrid had the highest mean course grades for all the years. However, the mean course grade did increase slightly with each year.
Age
While the proportion of online students increased with age, rising to above 34% for the over 40s, that for hybrid was constant. Course grade dipped in the mid-20s, then rose to be the highest for the over 40s. The hybrid method was the best for all ages.
College . While all except the honors college offered online and hybrid sections, the proportions varied widely. Hybrid varied from 9.4% to 0 and online from 36% to 0. The hybrid method was the best in all colleges except for three, Online was the best in two, and F2F was the best in one education.
Department
Online offerings varied from 100% to zero and hybrid from 34.3% to zero. Ten departments did not offer hybrid sections. In 20 colleges, hybrid was best; in 14, F2F was best; and online was the best in six.
LIMITATIONS OF THE STUDY
The use of a previous GPA to represent the academic ability of an incoming student is a convenient assumption. However, that is how most students rate their learning.
The use of course final grade to represent learning from a course is a common approximation of learning.
This analysis did not consider other factors like how many online or hybrid courses the student had done before the course, how many online or hybrid courses the student took simultaneously, whether the student was only taking online courses, or mixing F2F with online and hybrid courses.
In the main study, hybrid sections were only a small proportion of the total data.
The study did not examine differences between instructors. However, many instructors grade harder than others do for the same course, and hybrid teaching instructors may grade higher than those only teaching other methods.
The data for this case study comes from one university, and other universities and colleges may show completely different patterns.
DISCUSSION
This analysis supported previous research such as Means et al. (2010). They considered that students in online conditions performed
method mostly better, on average than those learning the same material through traditional all-in-person instruction. Instruction combining online and all-in-person elements had a larger advantage relative to purely all-in-person instruction than did purely online instruction.
Answers to Research Questions
Are there differences (both with demographics and previous academic achievement) in the students using the different teaching methods?
There are variations between the demographics of students doing the different methods. For example, more females and Black people tend to do hybrids. However, the differences are not significant.
Do students from different demographics and in different parts of the university have different student final grade outcomes in different methods?
There are apparent differences between outcomes for different teaching methods, and different demographics affect these outcomes. For example, Black people benefit the most from taking hybrid courses. There are apparent differences in how different departments use different teaching formats.
Further Points
Bernard (2014) conducted a meta-analysis and found that technology has an overall positive effect on learning but focuses on blended learning and interaction with technology in higher education. They concluded that blended learning and technological interaction enhance student achievement, and this analysis supports their findings.
Currie (2016) claimed five reasons hybrid achieved better results.
Students manage their time better to meet the course deadlines.
Students get professor and classmate face time.
Everyone is equal in online discussions.
The learning does not stop when students leave the classroom.
It can provide deeper and more effective learning.
This study supports his assertion that hybrids get better results. Moreover, it would be interesting to test his five reasons with further research.
An additional question arises from these results. Why, if the hybrid method generally results in higher course grades, do instructors teach such a small proportion this way? Financially, hybrid courses save capital and operating costs. If all F2F courses became hybrid, one would need half the number of classrooms for the same number of student sections.
However, one possibility is the increased workload for instructors. To teach a hybrid section, instructors will have to spend as much time setting up the online portion before class and administering the course as in online sections, and then they must spend the time to turn up on campus and teach in person in a classroom. So effectively, hybrid instructors are teaching the equivalent of half a F2F section plus a completely online section.
IMPLICATIONS
Based on these data, one may consider counseling Black ethnicity students to do hybrid sections of a course. Simpson (2006) considered the ethical implications of telling students their likelihood of success based on the teaching method. Other implications are that the administration may want to consider offering more hybrid sections in courses and less F2F. Alternatively, it may be that the type of instructor who wants to teach in a hybrid method gives higher mean course grades. This study would not apply if instructors who prefer F2F teaching started to teach hybrids (as has happened during COVID).
Another implication is that if junior and senior students do better in online and hybrid sections, a university need not build new classrooms to manage an increased student load. Alternately, if student numbers are falling or the same, administrators should consider reducing the number of classrooms by selling off or repurposing their surplus real estate. Although KSU is a high admittance rate institution, it is not an open institution. However, the implications of the advantages of hybrid teaching should work for open institutions, too, possibly through synchronous online classes.
FUTURE WORK
One should repeat the same analysis using only data from those instructors who teach hybrid as one of their methods and ignore all data from instructors that do not teach in the hybrid method. As many courses are now, due to the COVID pandemic, being taught using the rotating hybrid (such as Hyflex, where one teaches in-person and online at the same time) and synchronous online (which is F2F but not in person) methods, then there should be research to examine how these new methods affect results.
While this study showed hybrid method teaching had better results than F2F, it did not show why. One line of interesting research would be to find out why hybrid does better. One theory could be that hybrid only does the interesting interactive stuff in person, while the less interesting basic learning is done online. Another theory might be that knowledge acquisition is best made using students’ preferred learning times and speed. In contrast, more advanced learning is best done in an interactive in-person manner. There is also the possibility that the instructors who give higher grades tend to be those who teach hybrid courses.
One other line of study would be to look at the rest by type of subject. That is, science, social studies, and art find if the lessons apply across all sorts of subject matter or only to certain types of subject matter.
It would be interesting to do similar studies with other universities and colleges to see if KSU's patterns are similar or different. If done with several other teaching institutions and one found similar results, then one could make generalized conclusions on the effect of the teaching method on course grades.

