


Technology and the Internet pervade higher education, forcing universities to change how they deal with the growing technical needs of these organizations. This is particularly evident now, as students entering college may be better equipped technologically than are their faculty. Sixty-six professors were surveyed to determine their preparedness for the integration of technology into their curriculum. The findings suggested that faculty did not have the technical skills necessary to conduct distance education.
Background
Implementing the use of Web-based technologies in teaching and learning requires fundamental changes in many areas of an institution. This study was conducted to evaluate and assess the level of technical expertise or competency of the full time faculty in a private, nonprofit Puerto Rican university. The research site was established in 1949 as a two-year technical college. In 1991, it became a four-year college. In 2001, graduate programs began to be offered. Its academic programs lead to baccalaureate and associate degrees in liberal arts, education, business administration, office systems, science, and tourism. It also has programs on a transfer basis to continue toward bachelor's degree, professional degrees, and certificates. This university also offers master's degrees in human resources, administration and supervision in education, marketing, criminal justice, and management. The main campus has six university centers, spread out in different towns.
Population Characteristics
The student body is composed of young adults who mainly reside locally and also come from adjacent towns. The majority of students are from families with low incomes and limited education. The student body is also composed of youths and adults that have recently graduated from high school, as well as adults who have entered the job market and need to improve technical skills or desire an opportunity for self-improvement. Table 1 shows the amount of students per year in the program. On the main campus, a 33% reduction of students can be seen between first and second year students. Attrition continues throughout the academic years at both the main campus and the university centers. This high level of attrition should be the subject of further research.
Student Profile:
| First Year | Second Year | Third Year | Fourth Year | Total | |
|---|---|---|---|---|---|
| Main campus | 2186 | 717 | 430 | 315 | 3648 |
| Universi ty Centers | 1487 | 409 | 255 | 147 | 2298 |
| Totals | 3673 | 1126 | 685 | 462 | 5946 |
Faculty Profile
| Full-Time on Campus | Part-Time on Campus | University Centers Part-Time Only |
|---|---|---|
| 72 | 143 | 193 |
As this institution recently went through licensing renewing procedures, results of the evaluation suggested that it distinguishes itself from other local universities in the area in three main areas:
There is a complete support system for change. Beginning with the Chancellor, most of the professors who experiment with new ways of doing something, always find support.
Professors are always looking for new ways of teaching or reaching the student. As the administration supports change, the field is open to new methodologies and techniques.
An unusually wide variety of student services are available: Freshmen Year Services Program, Professional Guidance and Counseling Programs, Advising Program, Mentoring Program, Assessment Program, Tutorial Services, Complementary Educational Services Program, Health Services, Social and Cultural Activities, Sports and Recreational Activities, Books and Supplies, Veterans Services, Student Activities, Student Organizations, Student Council, Academic Dean's List, Tutoring, Work Study Program, Institutional Scholarship Programs, After School Program for students' children and, opening in January, 2002, a new Pre-School Center.
Review of the Literature
Needham (1986) noted that “Communications technologies have the potential to transform the educational process. [In many contexts], these technologies have the power to change the roles of faculty.” Technology and the Internet pervade the educational system at all levels. Institutions frequently develop new programs or adopt new paradigms in response to perceived changes in the exigency of society as a whole, or specific student patrons in particular.
On July 13–14, 2000, a group of 16 higher education leaders gathered in Lake George, New York, to participate in a symposium. The topic was “Preserving Quality in Distributed Learning Environments.” This was the third of the Pew Symposia in Learning and Technology. The purpose of these symposia was to conduct an ongoing national conversation about issues related to the intersection of learning and technology. During the presentations, data were presented that mentioned, according to Carole Cotton of CCA Consulting, a market research firm, that 94 percent of all colleges and universities are either currently (63%) or planning to be (31%) engaged in distance and distributed learning. Some believe that this extraordinary growth is surpassing the existing quality assurance capacities of accrediting agencies. Others counter that distance learning is a long-established form of higher education and that quality assurance practices for distance education are essentially the same as those used for traditional, on-campus education. Regardless, the arrival of distance and distributed learning has raised numerous questions about quality assurance. How do established distance learning institutions ensure quality? What more needs to be done? How do quality assurance agencies view the distinction between on- and off-campus teaching and learning (Twigg, 2000)?
Dissatisfaction with the educational status quo, both from inside and outside the university, has increased the pressure on higher education to reevaluate its traditional educational practices. Higher education is facing the challenges of the rapid development of information technology, increased accountability for quality education, competition from online institutions, rising costs, and changing student population (Ehrmann, 1995; Guskin, 1994; Handy, 1998; Owston, 1997).
Consequently, some universities and colleges are considering several restructuring solutions. Some of these solutions target educational practices: modifications in mission statements urging better preparation of students for work and life skills (Handy, 1998); curricula re-design with emphasis on measurable learning outcomes (Diamond, 1997); a redefinition of pedagogical goals toward a more learner-centered pedagogy (Collis, 1998); and heavy investment in technological innovations, such as the Internet (Owston, 1997). Of theses solutions, the latter has received much attention in higher education literature. At the research site, as in many other universities, administrators have high expectations that the potential of the Internet can be realized to better serve higher education clientele (Duchastel, 1997) and, thereby, address some of its restructuring concerns (Ehrmann, 1997a; Guskin, 1994; Owston, 1997).
Reasons for such expectations arise from several factors. First, the Internet's communication capabilities and its ability to transmit and store vast amounts of information hold great promise for the restructuring of teaching and learning practices. Already, two of its most popular services, electronic mail (e-mail) and the World Wide Web (Web) are changing teaching and learning practices, as “teacher and text” are no longer perceived as the only resources available to learner. Today, e-mail allows for access to global peers, colleagues, experts, and researchers. Similarly, the Web brings a variety of multi-media resources to the fingertips of students at a speed and quality of transmission never experienced before though networked computer technology.
The 1999 Campus Computing Project's annual national survey of information technology in higher education reported that many higher education institutions were providing more services through the Web. For example, more than half (69.5%) of the institutions responding provided online undergraduate applications on their Web sites. More than three-fourths (77.3%) made the course catalog available online. A quarter (25%) of the institutions made library-based course reserve readings available online, and almost half (46.5%) offered one or more full college courses online via the Internet and the Web (Campus Computing Project, 1999).
Second, the Internet allows for greater adaptability of instructional methods to different learning environments, making it ideal for distributed learning systems capable of accommodating the academic needs of a diverse adult student population. Third, traditional classrooms in higher education have been criticized for inadequate training of students for the workplace. The boredom, seeming lack of personal attention, outdated class material, and inadequate sensitivity to a diverse population are among the issues that have been questioned (Gardiner, 1997; Handy, 1998).
To further complicate matters, it has been argued that many students graduate without mastering core skills (Diamond, 1997). Meanwhile, state-of-the-art technologies are being adopted by corporations that are spending billions of dollars annually on formal training to make curricula and teaching methods more relevant, interesting, and modern (Mauch, 1998). Such possibilities are forcing the traditional establishment and administration of higher education to jump onto the technological bandwagon (Sherrit & Basom, 1997). Similarly, Rossner and Stockley (1997) summed up the situation as one of:
… increasing public access to information technology, government funding priorities for initiatives that support the development of distributed learning networks, increasing competition for students who no longer need to be present on a university campus, and the need to provide cost-effective, high quality education to greater numbers of students. (p. 333)
At the research site, an intellectual debate has been brewing. Administrators have to contend with the pressure to integrate technology as a means of attracting student applications and faculty either rejecting its imposition onto their teaching practices or seeking support for technology integration rewards, and recognition for the time and effort that goes into such efforts. Green (1999) reported that the 1999 survey of college faculty from UCLA's Higher Education Research Institute (HERI), which provides the first large-scale data on some aspects of the way college faculty use—and do not use—information technology resources documented that “keeping up with information technology” is a major source of stress for fully two-thirds of the professorate (p. 3).
Background and Problem
Though greeted with enthusiasm by the university community at large, technology integration remains controversial. Opponents caution against hasty and ad hoc technology integration into daily practices of teaching and learning, specifically without taking into consideration faculty and student willingness and cooperation in the integration efforts (Noble, 1998; Schrage, 1998; Turoff, 1997; Young, 1998).
The Internet is heralded as a versatile medium to support learner-centered educational practices. It is being promoted as a technological innovation that can reduce mundane time-consuming tasks of faculty workload. However, there is evidence for discontentment and controversial opinions regarding the above from both faculty and student bodies that only time and empirical research could dispel.
Many universities are making substantial investments in new technologies for teaching purposes. However, although there has been widespread adoption of new technologies for teaching in the last few years, they have not brought about major changes in the organization and delivery of teaching (Bates, 1997).
Why use technology? Politicians, university presidents, conference keynote speakers from industry, education, and government—and teachers themselves—offer a number of reasons to justify the use of technology. Bates (1997) mentioned four reasons: to improve access to education and training, to improve the quality of learning, to reduce the costs of education, and to improve the cost-effectiveness of education.
Some of these reasons seem conflicting. More students might be served by the institution through using technology: more means worse quality and more work for faculty. The initial set-up cost anticipates delving deep into the university's pocket. For the same dollar amount, learning effectiveness can be increased or more students can be taught to the same standard for the same level of investment. This seems a great goal for which to strive. As Twigg (2000), stated, “making use of new technologies to reduce the cost of instruction requires a fundamental shift in thinking.” It requires challenging the assumption of the current instructional model: face-to-face, synchronous learning. Colleges and universities must focus on producing effective use of resources—faculty, time and technology, to increase student learning. In order to reduce costs without hurting the quality of instruction, the university must move away from traditional management of resources, contact hours, and time. (Twigg, 2000; Bates, 1997).
Twigg (2000) stated that “A substantial amount of an institution's faculty members must have an understanding of and some experience with integrating elements of a computer-based instruction into existing courses.” This is paramount. When the organization purchases technology, it is imperative to involve professors, administrators, support personnel, and students. Some faculty members may have great enthusiasm for redesigning their courses, but have little experience in this area. Twigg (2000) mentioned that experts have stated that 13 to 15 percent of the faculty should constitute critical mass. More specifically, 13 to 15 percent of faculty is needed to begin smaller instructional technology units and thus satisfy integration needs in order to create a change reaction moving towards large-scale redesign efforts. It is clear, then, that universities must begin by engaging faculty, training them, and providing the professional development needed. Again, the need to acquaint faculty to the organization's technical efforts is crucial. “One of the main challenges of making technology-based teaching a core function is to extend its implementation from a relatively small number of enthusiasts and early adopters to the main body of the teaching force” (Bates, 1997). Teaching with technology is not an inferred process; appropriate training must be emphasized. Faculty must go through a four-step sequence to develop skills in using technology in teaching. First, they must understand the importance of using technology for teaching. They need some basic understanding of teaching and learning processes and different approaches. Third, they must comprehend the roles that technology can play in teaching and how this changes the organization of content. Fourth, they should know how to use a particular piece of technology (Bates, 1997).
Methodology/Results
The primary goal of this research study was to quantify the level of technical expertise or competence of the full-time faculty through self-report. It was determined that the full-time professors would provide more generalizable data because they are involved in the university's growth. A technical skills survey was given to all full-time faculty (n=72). The response rate was excellent (92%), as 66 replied. Data were collected during a yearly faculty meeting at the beginning of the 2001 academic year. Variables that were assessed included: department, years of experience, and technical skill level. The technical skills reported by faculty were: word processing, presentations, using laptop with projector, email, databases, WWW, discussion board, spreadsheets, distance education, statistics, chats, HTML, mailing lists, and graphic design. Information was also collected regarding prior experience with distance education and the level of experience with distance education based on the following three categories: some resources on the Web, Web-enhanced (additional resources), and completely on-line.
The results are divided into three sections. The opening section involves the primary analysis of the data (descriptive statistics for the overall sample, departmental affiliation, and years of experience). The next section involves the secondary analysis of the data, specifically, differences by departmental affiliation and also years of experience and its relationship to technical skill level. Finally, previous experience with distance education will be highlighted.
Descriptive Statistics
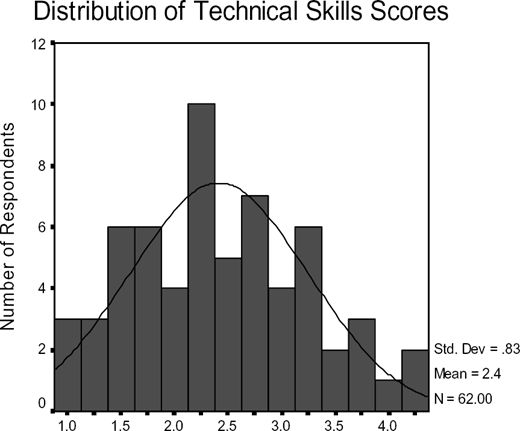
The overall sample distribution of mean technical skills are listed below in Figure 1. This figure represents the entire sample's responses to the technical skills portion of the survey. This evenly distributed bell-shaped curve was indicative of typical performance.
Distribution of Technical Skills Scores
Distribution of Technical Skills Scores
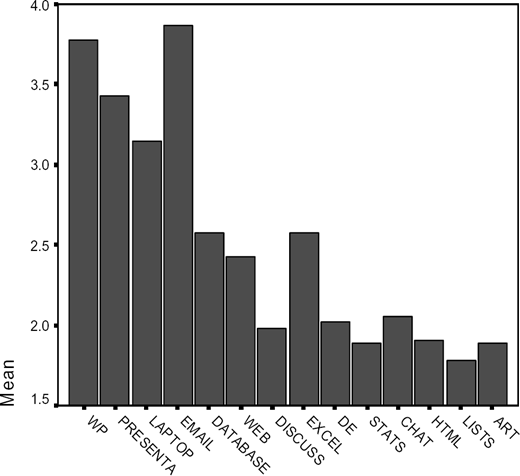
In Figure 2, bars represent each technical skill and the corresponding average for the entire sample. E-mail (3.89) and word processing (3.82) were self-reported as being the highest level of competency. Graphic design (1.84) and mailing list (1.82) were ranked at the bottom in terms of technical skill level.
Technical Skills and Corresponding Averages
Technical Skills and Corresponding Averages
Technical Skills, Means and Standard Deviations
| Skills | N | M | SD |
|---|---|---|---|
| 66 | 3.89 | 1.27 | |
| WP | 64 | 3.82 | 1.26 |
| PRESENTA | 65 | 3.46 | 1.42 |
| LAPTOP | 64 | 3.20 | 1.62 |
| EXCEL | 63 | 2.63 | 1.54 |
| DATABASE | 64 | 2.60 | 1.34 |
| WEB | 63 | 2.36 | 1.40 |
| CHAT | 62 | 2.04 | 1.48 |
| STATS | 63 | 2.00 | 1.29 |
| DE | 61 | 1.96 | 1.25 |
| DISCUSS | 63 | 1.92 | 1.33 |
| HTML | 63 | 1.84 | 1.25 |
| GRAPHICS | 63 | 1.84 | 1.23 |
| LISTS | 62 | 1.82 | 1.20 |
Table 3 includes the results of the 14 technical skills for the entire sample (n = 66). These descriptive statistics include means and standard deviations. As displayed by the lowest standard deviations, the sample shared the greatest similarity regarding mailing lists (also referred to as list-servs).
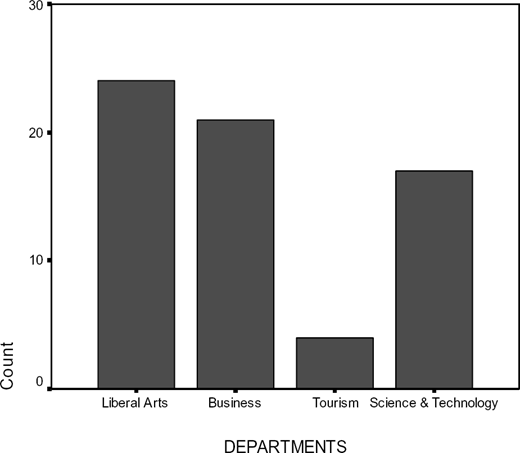
As seen in Figure 1, the overall sample generated a highly consistent and typical bell-shaped curve. However, when the departments were analyzed separately, significant differences were exposed. The following graph (Figure 3) represents the sample breakdown by department. Departments were somewhat evenly distributed which was hoped to produce stable inferences. However, due to the relatively small number of faculty in Tourism, faculty in this department were not included in the statistical analyses.
Highest and Lowest Technical Skills by Department
| Department | Highest | Lowest |
|---|---|---|
| Liberal Arts | e-mail (3.12) | Mailing lists (1.27) |
| Business | e-mail (4.38) | Art/Drawing/Graphic Design (1.94) |
| Science & Technology | WP (4.50) | HTML (1.70) |
Results of the highest and lowest self-rated technical skills by department are listed below in Table 4. Liberal Arts and Business both stated email as the highest technical level. As seen in the overall sample, the departmental affiliation demonstrated consistent findings.
Averages were computed for all technical skills by each department and statistically significant differences were found. These departments and their corresponding averages are listed. Liberal Arts and Languages: (1.80) Science & Technology: (2.58), Business Administration: (2.97). Cohen's d effect sizes statistics (1988) were computed to compare overall differences among departments. This statistic quantifies the difference between means, and does so in standard deviation units. For example, a Cohen's d of .5 is interpreted as two groups being half a standard deviation apart. Cohen (1988) stated that anything above .20 is small, .50 is medium, and .80 is large. Differences regarded as “large” were found when conducting this comparative statistic.
This apparent variation in the overall scores of departments was further uncovered through an analysis of each technical skill. Based upon departmental scores of the 14 categories of technical skills, 7 were found significant at the .01 level and 4 were significant at the .05 level. Those significant at the .01 level were: Word processing, presentations, laptop, e-mail, database, Excel, and chat. At the .05 level were: WWW, stats, html, and mailing lists. Differences among the departments were so great in technical skills that only three skills did not produce statistically significant results. These were discussion boards, distance education, and graphic design. There were great disparities in skill levels based on department affiliation. This is obviously a concern to the university and, therefore, any faculty development initiatives should involve a further investigation of this apparent variation of technical skills among departments.
The breakdown by years of experience (Table 5) did not produce statistically significant differences. In essence, the groups shared similar characteristics regarding technical skills levels. Again, these groupings shared responses that were similar to the overall sample.
Correlations between Years of Experience and Technical Skill Level
While groups based on years of experience alone did not differ significantly, significant differences, correlations (Spearman's rho) analyzing years of experience and technical skill levels did produce statistically significant results. Chat and HTML offered negative correlations at the p < .01 level. Therefore, faculty with fewer years of experience had higher ratings in these areas. Conversely, faculty with more years of experience had lower ratings in these areas. These findings were very consistent with the literature and the researchers' expectations. It appears that younger faculty have more familiarity with these higher-order technical skills than do older faculty. Such findings point to the need to include all members of the faculty in terms of professional development.
Distance Education Experience
Information was collected to meet Twigg's theory of critical mass. On the following survey question dealing with “Experience with Distance Education,” 13 responded “yes,” and 51 responded “no.” Also, of those who stated having previous experience with distance education (n = 13), based on the three categories, the responses are shown in Table 6.
This finding can be interpreted as 20% of faculty surveyed had previous experience with Distance Education. This meets (and exceeds) Twigg's recommendation necessary for critical mass. While this finding is interesting, it only hints that a move to distance education would be successful. This university is beginning to involve itself more in this genre. However, based on the low technical levels of the faculty, this finding is still left to conjecture.
Conclusions
The findings of this research convey an apparent disproportion of technical skills among faculty. Departmental affiliation provided the greatest variation in technical skills. This points to the need for greater technical skills among faculty at this institution. In a perfect world, all faculty in an academic institution would share common technical skills. Yet, as reflected in society, commonalities regarding technical competency is atypical. The “digital divide” apparent in society is also reflected in academia.
Based on the findings of this study, the critical mass required to effectively integrate technology was evident. Yet, the variations in skills level provided a great disparity among faculty. Faculty appear interested, albeit at different levels. However, this is not acceptable in higher education, where standards are typically required to ensure equal outputs in terms of students' objectives, etc. Thus, to level the playing field, faculty development should look to raise the technical levels of those determined to be “weak.”
While this institution is interested in conducting distance education in the near future, the preponderance of lower level skills among faculty is a concern. As expected, the Science/Technology and Business departments scored higher than Liberal Arts. However, the technical skills ranked highly were typically “lower-level” skills (e-mail, word processing). While the entire sample shared similar low levels of technical skill competencies (e-mail, word processing), there was an overall lack of the higher order skills typically used in distance education (html, mailing lists).
Further Research
The conclusion of this study also gives direction to further research. These findings demonstrated weak levels of technical competencies, which point to the need for better preparation regarding the technical skills and the integration of these skills into instruction. As noted by Bates (1997), faculty must go through a four-step sequence to develop skills in using technology in teaching: they must understand the importance of using technology for teaching; they need some basic understanding of teaching and learning processes and different approaches; they must comprehend the roles that technology can play in teaching and how this changes the organization of content; and they should know how to use a particular piece of technology. A further investigation determining the level of understanding regarding these principles should be completed so as to better understand the process of integrating technology into teaching. The inclusion of these approaches in professional development would be an effective start to ameliorate such deficiencies among faculty.

