

This study measured the importance of training for higher education faculty and administrators in adapting to and implementing distance education courses in an interactive television (ITV) environment. The quasi-experimental study utilized a pretest-posttest control group design with Analysis of Covariance (ANCOVA) used to analyze the data. The Stages of Concern Questionnaire (SoCQ) from the Concerns-Based Adoption Model (CBAM) (Hall, George, & Rutherford, 1986) provided the framework for the quantitative component of this study. Significant differences occurred in four of the seven stages of concern between the classroom and laboratory group and the control group, signifying the importance of training.
Introduction
Providing learning experiences through distance education has become increasingly popular in higher education institutions. With the support of major telecommunication funding opportunities at the federal and state levels, the number of distance education systems increase steadily through the 1990s.
In 2000-2001, 89% of the public 4-year higher education institutions in the United States offered courses via ITV. At that time, 23% of the respondents to a survey on distance education courses in higher education indicated that distance education delivery would be offered by their institution within the next 3 years (National Center for Education Statistics, NCES, 2003); however, ITV training for faculty was not addressed in the report.
A review of the distance education related literature reveals that only about a quarter of higher education institutions offering distance education courses required faculty to have training in distance education technologies (NCES, 1999). “The development of a quality distance learning program is predicated upon a quality faculty, not unlike that in any other instructional setting” (Savage, 1999, p. 209). The need for faculty training has been well documented in the literature. Perreault, Waldman and Zhao (2002), Savage (1999), Cyrs (1997), Moore (1997), and Beaudoin (1990) all pointed out the need for faculty training in the ITV environment; however, the literature is lacking in actual studies of the direct impact of training on the faculty who will be ultimately responsible for the success of the distance education program. The implementation of two-way interactive video classes can be an expensive venture for an institution, yet the research indicates that training does not seem to factor into the process. Distance education offers many benefits to higher education institutions. Hanson et al. (1997) stated, “a wellrun distance education enterprise is the product of people, planning, and technology” (p. 34). However, the implementation of effective programs is often hampered by a variety of factors. Some professors and administrators may have negative attitudes toward distance education. They have concerns about the quality of the education that is possible in an ITV format. Many times this is due to the lack of understanding of the technology itself or due to lack of training of faculty, staff, and administration (Savage, 1999). Some instructors are afraid of having to change instructional methods or of losing autonomy. If instructors do not receive support for planning or course design, negative attitudes may develop; however, a formal and thorough orientation to distance teaching and distance education can change educators’ perceptions (Dillon & Walsh, 1992).
A review of the research related to implementing an innovation, such as ITV, into an organization or institution revealed the Concerns Based Assessment Model (CBAM) developed by Hord, Rutherford, Huling-Austin, and Hall (1998) who wrote, “the single most important factor in any change process is the people who will be most affected by the change” (p. 29). Even though the technology and the institution are important to the successful implementation of a distance education program, the faculty, staff, and administrators utilizing the system are the most important factors in successful implementation (Hord et al., 1998). Moore and Kearsley (1996) suggested that the success of a distance education program in an institution is dependent on the internal commitment by the teachers and others within the organization. If the innovation is to be successful, the concerns of faculty and administrators utilizing the systems must be addressed (Hall & Hord, 2001). It is important to note that the success of any new program in higher education is dependent upon the innovation being supported and implemented by the faculty of the institution (Hall, & Hord, 2001).
Frances Fuller, University of Texas psychologist, in 1969 originated the idea of addressing the concerns of individuals faced with implementing a new innovation. Through Fuller's work and that of Ven den Berg and Bandenberghe (1981), Persichitte and Bauer (1996), Shieh (1996), and Hall and Hord, (1986), it was found that when people are exposed to change, they experience the same concerns (Hall & Hord, 2001). An administrator or director of a new ITV system would want to identify and address the concerns of faculty who would be using the new system for teaching purposes.
Hall and Hord (2001) identified and confirmed seven specific categories of concerns that are detailed in the Stages of Concern Questionnaire (SoCQ) and tested in the Stages of Concern Questionnaire. “The most rigorous technique for measuring concerns is the Stages of Concern Questionnaire, which is a 35-item questionnaire that has strong reliability estimates (test/retest reliabilities range from .65 to .86) and internal consistency (alpha-coefficients range from .64 to .83)” (Hall & Hord, 2001, p. 68).
Problem Statement
The use of distance education technologies to deliver instruction to geographically-bound or time-restrained students has become commonplace among higher education institutions; however, training for personnel delivering the instruction is not always offered. This study was undertaken to determine if formal distance education classroom training or classroom training combined with laboratory experiences would affect the concerns of college faculty and administrators about the implementation of distance education through ITV in their institution.
Research Question
Do the stages of concern, as measured by the SoCQ, differ among groups of college faculty and administrators who are expected to begin delivering instruction via distance education and who receive (a) classroom training on distance education, (b) classroom training and laboratory experiences on distance education, or (c) no distance education training?
Research Methodology
This research was conducted at Texas State Technical College-Marshall (TSTC-M), which is located in Marshall, a rural East Texas town of approximately 25,000 people. The college is part of the TSTC system, the only state-supported technical college system in Texas.
The population for this study was comprised of full-time faculty and administrators of the college. A total of 27 faculty and administrators participated in this study. The population was divided into three groups for the purpose of this study. Each group included nine faculty and administrators. The first group, the classroom group, consisted of personnel who participated in only the classroom portion of the distance education training activities. The second group, the classroom and laboratory group, participated in the classroom training and completed an additional 18 hours of hands-on training in the distance-learning classroom. The third group, comprised of the personnel who did not participate in distance education training activities, served as the control group. A quasi-experimental design was used for the research because the individuals were not randomly assigned to treatment conditions.
The SoCQ was administered as a pretest to all three groups before formal distance education training was conducted. The validity of this instrument was established by Hall, George, and Rutherford (1986) over 2.5 years of research with “intercorrelation matrices, judgments of concerns based on interview data, and confirmation of expected group differences and changes over time” (p. 12). The seven stages of concern, awareness, informational, personal, management, consequence, collaboration, and refocusing assessed in the SoCQ represent a developmental sequence that an individual progresses through when confronted with change or innovation (Toms, 1997).
Each participant in all three groups of the study received the questionnaire on the first day of the scheduled classroom training. The control group attended the first 15 minutes of the first scheduled classroom training to complete the survey. Once their survey questionnaire was returned, the control group members were dismissed from the classroom training session. Respondents indicated on a Likert scale the degree to which each concern was true and circled a number from 0 to 7 on the printed scale. Respondents were given as much time as necessary to complete the survey before actual classroom training began. Each series of the questionnaire consisted of items that are important at a certain stage of concern, according to the Hall, George, and Rutherford (1986) concerns theory. Each of the seven stages of concern was represented by five questions on the survey. A scale score was obtained for the peak score and for each of the stages of concern on the questionnaire. This information provided the baseline data for the research. After the SoCQ was completed, the researcher presented 9 hours of classroom instruction in distance education teaching strategies to the 18 participants in groups two and three.
Personnel choosing to participate in the study were placed into two groups. Each group met 1 day every second week for 3 hours of instruction. Classroom training consisted of three 3-hour sessions over 6 weeks of instruction. Participants took part in discussion and hands-on activities that familiarized them with the technology and the necessary skills for teaching at a distance. At the conclusion of the last classroom session, the participants who elected to end their training with the classroom portion were administered the SoCQ as a posttest.
The classroom and laboratory group was comprised of the faculty and administrators who wished to receive college credit for their participation in the classroom sessions. In order to receive college credit, this group participated in 18 hours of individual, hands-on practice in the distance-learning classroom in addition to the required classroom instruction. The laboratory time included guided practice in how to use the equipment effectively and feedback on instructional delivery utilizing the equipment. Participants presented a 10-minute lesson in their subject area in the ITV classroom to a remote site as part of their course requirements for credit. Upon completion of the presentations, the SoCQ was administered to the classroom and laboratory group and to the control group. The respondents completed the SoCQ following the same procedures as in the two previous test administrations. A scale score was determined for the peak score and for each of the seven stages of concern.
Analysis of the Data
Data obtained from the SoCQ were handscored using the Quick Scoring Device included in the Hall, George, and Rutherford (1986) manual about measuring the stages of concern of an innovation. Data were transferred by hand to scoring sheets. Raw scores, the sum of the responses to the five questions matching each stage of concern, were entered into the SAS statistical program that was used to analyze the data. The analysis of covariance (ANCOVA) was conducted on the data to determine if differences occurred among the three groups.
To determine if a covariate was needed in the analysis of the data, analysis of variance (ANOVA) was run on the pretest (covariate) for each of the seven stages of concern. A significant F ratio was found at the p < .01 level of confidence in five of the seven stages of concern, and at the p < .05 level of one additional stage of concern, indicating the appropriateness of the covariate analysis. The ANOVA results among the three groups on the pretest are reported in Table 1.
A linearity analysis between the pretest and posttest was performed to meet the assumption of using a covariate. This analysis demonstrated a strong correlation at the p < .01 level between the pretest and posttest in all seven stages. These results supported the need for analysis of covariance. Correlations between pretest and posttest for each of the seven stages of concern are presented in Table 2.
Once the need for the covariate was determined, the data were analyzed by using ANCOVA. Peak score analysis, summed raw scores converted to a percentile score for each stage, was presented as additional analysis of the data.
Analysis of the Seven Stages of Concern
Hall, George, and Rutherford (1986) recommended two methods of dealing with group data. The first method tallies the number of individuals that score high on each stage to obtain the range of peak stage scores within a group. Peak scores are related to the stage definitions in the questionnaire. The authors noted that “the higher the score, the more intense the concerns at that stage. The lower the score, the less intense the concerns at that stage” (p. 31). The second method, and the method utilized in this study, is to “aggregate individual data by developing a profile that presents the mean scores for each stage of the individuals in the group” (p. 32). The aggregate score was derived from the sum of the responses given to the five questions addressing each stage of concern. The total stage raw scores for each of the participants in each group were used in the ANCOVA test to determine differences among the groups.
Analysis of Variance on the Seven Stages of Concern in the Stages of Concern Questionnaire
| Stage of Concern | Group | Mean (SD) | F | Probability |
|---|---|---|---|---|
| Awareness | 1.92 | ns | ||
| Classroom | 11.67 (3.12) | |||
| Classroom and Laboratory | 11.33 (4.80) | |||
| Control | 15.11 (5.37) | |||
| Informational | 16.46 | p < .01 | ||
| Classroom | 25.00 (4.58)+ | |||
| Classroom and Laboratory | 22.78 (6.34)* | |||
| Control | 11.56 (4.90)*+ | |||
| Personal | 8.71 | p < .01 | ||
| Classroom | 24.78 (6.04)* | |||
| Classroom and Laboratory | 17.22 (8.69) | |||
| Control | 8.78 (9.31)* | |||
| Management | 4.86 | p < .05 | ||
| Classroom | 16.67 (7.48)* | |||
| Classroom and Laboratory | 12.00 (5.24) | |||
| Control | 7.33 (6.12)* | |||
| Consequence | 8.54 | p < .01 | ||
| Classroom | 21.89 (7.13)* | |||
| Classroom and Laboratory | 16.22 (9.51)+ | |||
| Control | 6.33 (7.40)*+ | |||
| Collaboration | 17.61 | p < .01 | ||
| Classroom | 22.67 (6.06)* | |||
| Classroom and Laboratory | 21.00 (8.70)+ | |||
| Control | 4.78 (6.10)*+ | |||
| Refocusing | 20.69 | p < .01 | ||
| Classroom | 15.44 (5.15)*# | |||
| Classroom and Laboratory | 9.22 (5.17)+# | |||
| Control | 2.11 (2.20)*+ |
indicates significant difference between means designated *
indicates significant difference between means designated +
indicates significant difference between means designated #
Correlations between Pretest and Posttest on the Seven Stages of Concern in the Stages of Concern Questionnaire
| Stage/Dimension | Coefficient | Probability |
|---|---|---|
| Awareness | .57 | p < .01 |
| Informational | .73 | p < .01 |
| Personal | .60 | p < .01 |
| Management | .52 | p < .01 |
| Consequence | .75 | p < .01 |
| Collaboration | .92 | p < .01 |
| Refocusing | .70 | p < .01 |
| Self | .70 | p < .01 |
| Task | .52 | p < .01 |
| Impact | .85 | p < .01 |
The initial pretest score on the Stages of Concern Questionnaire was used as the covariate in this study. Analysis of covariance was used to adjust for initial differences between groups before a comparison of the within- and between-groups was made. Gall, Borg, and Gall (1996) suggested “the preferred statistical method is analysis of covariance in which the posttest mean of the experimental group is compared with the posttest mean of the control group with the pretest scores used as a covariate” (p. 496). Independent t tests of least squares means, Tukey, were conducted on the comparison results of the groups to determine which differences between and among groups were significant. For clarity, results of the analysis of the data are presented in separate table form by stage.
Stage 0—Awareness
The analysis indicates little difference in the awareness stage of concern about involvement with distance learning. After the posttest scores for the three groups were adjusted by ANCOVA, the obtained F value of 1.03 failed to reach the .05 level of probability. This analysis of adjusted mean scores among the groups is reported in Table 3.
Stage 1—Informational
In stage 1, informational, a general awareness of distance learning is indicated. After the posttest mean scores for the three groups were adjusted by using the ANCOVA analysis, the obtained F value of .79 did not exceed the critical value at the .05 level. There was no significant difference among the adjusted mean scores of the groups, as reported in Table 4.
Stage 2—Personal
The analysis of stage 2, personal, indicates little difference in the involvement with distance learning. After the posttest scores for the three groups were adjusted, the obtained F value of 2.32 failed to reach the .05 level of probability. The results of the analysis are reported in Table 5.
Stage 3 – Management
Responses to stage 3, management, indicated concerns with logistics, time and management concerned with distance learning. Adjusted posttest scores resulted in an obtained F value of 7.04, indicating a significant difference at the .01 level of probability. The results of the Tukey post hoc analysis indicated that significant differences occurred between the classroom and laboratory group (17.11) and the control group (11.51). This analysis is reported in Table 6.
Analysis of Covariance Results of Stage 0—Awareness
| Stage of Concern | Adjusted mean (se) | F-value | Probability |
|---|---|---|---|
| Awareness | 1.03 | ns | |
| Classroom | 10.07 (1.63) | ||
| Classroom and Laboratory | 8.39 (1.64) | ||
| Control | 11.87 (1.70) |
Analysis of Covariance Results of Stage 1—Informational
| Stage of Concern | Adjusted mean (se) | F-value | Probability |
|---|---|---|---|
| Informational | 79 | ns | |
| Classroom | 14.76 (1.85) | ||
| Classroom and Laboratory | 17.47 (1.68) | ||
| Control | 15.43 (2.18) |
Analysis of Covariance Results of Stage 2—Personal
| Stage of Concern | Adjusted mean (se) | F-value | Probability |
|---|---|---|---|
| Personal | 2.32 | ns | |
| Classroom | 13.97 (2.79) | ||
| Classroom and Laboratory | 18.97 (2.40) | ||
| Control | 11.62 (2.82) |
Analysis of Covariance Results of Stage 4—Consequence
| Stage of Concern | Adjusted mean (se) | F-value | Probability |
|---|---|---|---|
| Consequence | 7.70 | p < .01 | |
| Classroom | 14.61 (2.12)* | ||
| Classroom and Laboratory | 21.99 (1.88)*+ | ||
| Control | 11.51 (2.22)+ |
indicates significant difference between means designated *
indicates significant difference between means designated +
Stage 4—Consequence
Consequence, stage 4, indicates the degree of concern about the consequence of the distance learning innovation upon students. The F value of 7.70 for treatment effects among the three groups was significant at the .01 level. The results of the Tukey post hoc analysis indicated that the adjusted mean of the classroom and laboratory group (21.99) and the adjusted mean of the classroom group (14.61) differed significantly. The post hoc analysis also indicated that the adjusted mean of the classroom and laboratory group (21.99) and the adjusted mean of the control group (11.51) differed significantly. Results of the analyses are reported in Table 7.
Stage 5—Collaboration
Stage 5, collaboration, indicates the degree of concern about working with others in distance learning. The F value, 7.14, was significant at the .01 level of probability. Results of the Tukey post hoc analysis indicated that the adjusted mean of the classroom and laboratory group (21.53) differed significantly from the adjusted mean of the classroom group (17.00). The post hoc analysis also indicated that the adjusted mean of the classroom and laboratory group (21.53) differed significantly from the adjusted mean of the control group (14.14). Results of the analyses are reported in Table 8.
Stage 6—Refocusing
The analysis of stage 6, refocusing, indicates the degree of concern about wanting to learn more about distance learning. The F value of 6.52 exceeded the critical value at the .01 level of probability. Results of the Tukey post hoc analysis indicated that the adjusted mean of the classroom and laboratory group (16.51) differed significantly from the adjusted mean of the control group (6.55). Results are reported in Table 9.
Analysis of Covariance Results of Stage 5—Collaboration
| Stage of Concern | Adjusted mean (se) | F-value | Probability |
|---|---|---|---|
| Collaboration | 7.14 | p < .01 | |
| Classroom | 17.00 (1.31)* | ||
| Classroom and Laboratory | 21.53 (1.24)*+ | ||
| Control | 14.14 (1.61)+ |
indicates significant difference between means designated *
indicates significant difference between means designated +
Analysis of Peak Scores on the Stages of Concern Questionnaire
Hall, George, and Rutherford (1986) suggested that “the simplest form of interpretation is to identify the highest stage score” (p. 29). To determine the highest stage score in grouped data, the simplest approach is to tally the number of participants who are high on each stage. This gives a clear picture of the high scores within a group (Hall, George, & Rutherford, 1986).
Another way to identify the peak stage for a group is to aggregate individual data in a profile that presents mean scores for each stage. Hall, George, and Rutherford (1986) suggested that “normally, the group averages will reflect the dominant high and low Stages of Concern of the composite group” (p. 32). When analyzing these data, the raw scores are computed by summing the scores on each of the five questions in each stage. When interpreting the peak score, the raw score is converted to a percentile score. The group data for peak scores on the Stages of Concern are presented in Figure 1. The line graph is a pictorial representation of the peak scores on each stage of the SoCQ among the three groups. The adjusted means of the summed raw scores were converted to percentile scores using the procedures recommended by Hall, George, and Rutherford. (1986).
Discussion of Findings
Results of the data analysis for the experimental populations in this study indicated that significant differences favoring the experimental strategy for the classroom combined with laboratory experiences group occurred in four of the seven stages of concern at the p < .01 level of confidence.
Concerns research shows that concerns change over time in a developmental manner. Because this is true, professional development for faculty and administrators should address the stages of concern in a progressive manner if the innovation is to be effective. This means that a person's concerns should be addressed at the point where he or she scores on the SoCQ and then activities should be presented to help him or her move to the next concern. For example, if a person is at the informational stage when the new innovation is introduced, then there is no reason to take the person back to the first stage of awareness. The professional development should address the individual's concern at the time and help him or her move to the next stage of personal and so on until the individual reaches the refocusing stage where the concern that the individual has is for the institution and the students receiving the instruction through the ITV classroom. The sum of the responses to the five questions addressing the seven stages of concern should show the progressive development of an individual or group moving from a high awareness or self concern to the refocusing concern that indicates acceptance and willingness to implement an innovation (Hall & Hord, 1987).
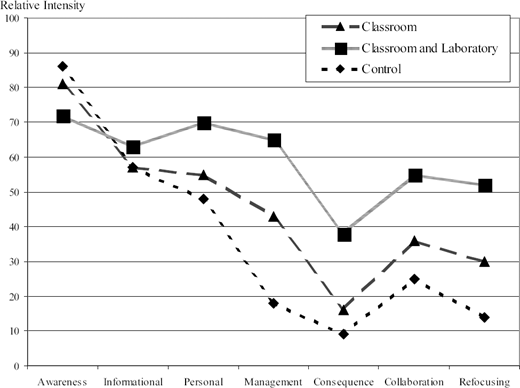
Line graph representation of the peak scores for the classroom group, classroom and laboratory group, and the control group on each of the seven Stages of Concern
Line graph representation of the peak scores for the classroom group, classroom and laboratory group, and the control group on each of the seven Stages of Concern
When evaluating the classroom and laboratory group in this study, the analysis of the data indicated that this group had shifted its focus away from concerns primarily about self and had begun to evaluate the management, consequence, collaboration, and refocusing stages that are essential for the new innovation, distance education, to be successful at TSTC-M.
High concerns in stage 3 for the classroom and laboratory group indicated that this group was concerned about logistics, time, and management concerns. The highest adjusted mean score for the classroom and laboratory group occurred in stage 4. This indicated that the group had concerns about the effects of distance learning on students. Their next highest adjusted mean score was in the adjacent stage 5, collaboration. This indicated that the group had concerns about the collaborative efforts of distance learning. The high score on the refocusing stage, with a low score in the awareness stage, indicated that the individuals who had participated in classroom and laboratory experiences were concerned about its effects on students. They were also concerned with collaboration efforts to make distance education more effective for students involved in the process.
The analysis of the data of the classroom group in this study showed a significant difference at the p < .01 level of confidence in two stages of concern. The highest adjusted mean score for the classroom group was in stage 5, collaboration. A significant difference between the classroom and the classroom and laboratory groups appeared at this stage. A significant difference between these two groups also occurred in the consequence stage. These differences indicated that classroom training was beneficial to both groups, but the actual laboratory experiences helped the faculty and administrators feel more comfortable about distance education. The classroom group also showed a significant difference from the classroom and laboratory group in the impact dimension. This shows that the classroom training made the group more aware of distance education, but faculty and administrators need the additional laboratory experiences before beginning instruction in the distance learning classroom.
The control group profiles in this study align with that of the nonuser in the stages of concern. The concerns of nonusers are typically the highest on stages 0, 1, and 2, and typically lowest on stages 4, 5, and 6. The highest adjusted mean score for the control group occurred in stage 1. This indicates that the group is more concerned with personal position and well-being in relation to the change. With the second highest adjusted mean score falling in stage 5, the results of the ANCOVA suggested that the control group is also highly concerned with working with others. The “tailing-off” stage 6 indicates that the group does not have ideas that compete with the distance education innovation. The responses for the control group followed the typical pattern of a nonuser of distance education. This group appeared to have little interest in distance education.
When comparing the peak score analysis with adjusted mean scores converted to percentile scores, the chart presented in Figure 1 graphically illustrates the development, or lack of development, of each group through the Stages of Concern. The peak scores reinforce the adjusted mean scores found in the ANCOVA results. The classroom and laboratory group progressed steadily through the Stages of Concern with the aid of training and laboratory experiences. The classroom group made some developmental moves, but adjusted means were not significant. The graphic view of the control group results resembled the profile of the typical nonuser described by Hall, George, and Rutherford (1986).
Limitations of the Study
The results of this study should not be generalized to extend to other institutional groups without comparative data. The findings must also be viewed with limitations specified by the experimental design, the participating faculty and administrators, the researcher, the questionnaire, and the statistical analysis.
Conclusions
Based on the findings of this study and recognizing the limitations stated in the previous section, it was determined that classroom training combined with laboratory experiences was more effective for addressing concerns of college faculty and administrators about the innovation of interactive television classes. This type of treatment seemed to be more effective in preparing these personnel to teach in an ITV setting and helping them move from the early stages of concern concentrating primarily on how the innovation affects them to the task and impact stages of concern where a person can be more concerned about how the innovation affects the student. Another conclusion that could be supported by the data is that training in the new teaching methodologies required in this environment can help increase the institutionalization of the innovation and should be viewed as a critical component when beginning interactive television classroom instruction.
Determining if classroom training and classroom experiences aid in the smooth acquisition of the innovation of ITV programming provides pertinent and useful data on how higher education administrators and faculty embrace and adapt to change as measured by the SoCQ. This study was conducted under the assumption that personnel implementing distance education programs desire a smooth and successful acquisition of the innovation.
Implications for Training
The implications of this study are important to address the quality of educational programs being offered through ITV classes. Because of the expense involved for any institution installing an ITV classroom, it is important to ensure that the equipment is being used and that faculty and administrators do not have negative feelings about teaching in the new environment. “For faculty members to succeed in distance education, they need to be supported with accurate and complete information and training in order to develop their skills and understanding” (Cavanaugh, 2002, p. 176). With faculty focusing on the needs of their students and not their personal concerns about teaching in the new environment, they can focus more on the quality of the curriculum and in attracting and retaining students in the ITV program. Cavanaugh (2002) also pointed out that all distance education faculty members need training and this training should be followed up with ongoing assistance and peer mentoring.
By using the SoCQ, the concerns of faculty and administrators can be assessed throughout the process of implementing ITV classes as well as assessing concerns years into the process. This can help determine if the faculty and administrators using the classrooms are effective in their instruction. The literature supports that teaching in an ITV environment is different than teaching in a traditional face-to-face classroom (Palloff & Pratt; 1999, 2001; Willis, 1994). Oblinger and Maruyama (1996) reported that, in higher education, lecture is still the traditional mode of delivery of course content. Because of this, it is important to provide training combined with laboratory experiences to faculty new to the environment so that their concerns can be addressed and effective instruction, resulting in quality programs, will be the product of the new innovation.
