This paper aims to make microfinance transparent, effective and secure with the help of the decentralized nature of blockchain technology. In doing so, it guarantees that microfinance enhances greater financial inclusion along with the economic empowerment of women. The research conducted a pilot implementation of a blockchain-based microfinance platform with respect to some metrics: access to financial resources, average income per month, repayment of the loan, fraud incidents and financial literacy scores. The pilot results, primarily, are likely to suggest that improvement is statistically significantly different for all these metrics.
The research conducted a pilot implementation of a blockchain-based microfinance platform with respect to some metrics: access to financial resources, average income per month, repayment of the loan, fraud incidents and financial literacy scores. The pilot results, primarily, are likely to suggest that improvement is statistically significantly different for all these metrics. The percentage of SHG members that had access to financial resources doubled, with similar dynamics (increase of 197%) in the average monthly incomes of the actors being witnessed.
Blockchain’s transparent and immutable ledger system has addressed one of the key challenges in traditional microfinance – lack of trust. By ensuring that all transactions are securely recorded and easily verifiable, blockchain technology has built confidence among SHG members. This increased trust has encouraged greater participation in microfinance programmes, thereby expanding financial inclusion. The operational efficiency of the blockchain-based platform has significantly reduced the time required for transaction processing and loan disbursement. Traditional microfinance systems often involve lengthy processes with multiple intermediaries, leading to delays and higher operational costs. In contrast, the blockchain platform has streamlined these processes through automation and smart contracts, enabling real-time verification and execution of transactions. This efficiency not only improves the user experience but also reduces costs for microfinance institutions, making financial services more accessible and affordable. Moreover, the integration of AI-driven tools with the blockchain platform has enhanced financial literacy and inclusion. Personalized financial advice and educational resources provided by AI have empowered SHG members to better understand and manage their finances.
The pilot project in Rayagada has revealed the transformative potential of blockchain technology in the microfinance sector. By integrating the blockchain, the project has successfully enhanced transparency, operational efficiency and financial literacy among self-help group (SHG) members. These improvements have fostered a more inclusive and trustworthy financial environment, which is critical for the empowerment of marginalized communities.
1. Introduction
Bitcoin, a decentralized digital currency formalised by the pseudonymous Satoshi Nakamoto, operationalises a distributed ledger in the form of a blockchain that archives a permanent, cryptographically secure transaction history. These core attributes of decentralisation, immutability and traceability position the protocol as a possible inflection point across multiple industries. When considered within the microfinance domain, historically a principal vehicular mechanism for enduring uplift in chronically underserved markets, the synthesis of blockchain technology may ameliorate chronically intractable encumbrances. Dominant among these are excessive unit transaction costs, persistent opacity of record histories and endemic fraudulent misrepresentation. These frictions have enervated traditional microfinance tiered models, as a consequence restraining the ambition of systematically widening marginalised rural financial inclusion by Chen et al. (2018). The consolidation of blockchain protocols within extended microfinance architectures permits stakeholders to instantiate programmatic, cryptographically enforced trust, to reform value chains by consolidating process stages and to concurrently contract transaction costs whilst expanding the spatial frontiers of eligible beneficiary populations.
This contribution examines the application of distributed ledger technology within the microfinance framework of Rayagada District, where self-help groups (SHGs) serve as loci of persistent socioeconomic mobilisation. Quantitative and qualitative datasets reveal pathways by which a permissioned blockchain infrastructure may amplify transactional traceability, curtail fraud incidence, lower transaction costs and enable low-latency, encrypted payment settlements (Biswas et al., 2019). Complementing the technical appraisal, a multi-theoretical lens is operative: Kabeer’s empowerment theory is marshalled to interrogate women’s agency; elements of social capital theory elucidate mechanisms of communal trust and the expanded technology acceptance model (TAM) together with the unified theory of acceptance and use of technology (UTAUT) deepen understanding of user inclination towards the innovation. Such triangulation embeds the technological intervention within extant discourses on gender empowerment, social embeddedness and trust-mediation.
Subsequently, the research pursues a convergent framework that synergises blockchain with advanced analytical capabilities and artificial intelligence. Guided by AI-enhanced forecasting, notably supervised learning, the case studies demonstrate refined credit scoring, anticipatory fraud mitigation and bespoke financial counselling. The multidisciplinary axis aspires towards improved operational throughput, elevated financial literacy and pervasive microfinance inclusion, with the ultimate performance metric being sustained financial agency of SHG constituents as a trajectory embedded within the socioeconomic development agenda.
This article advances the discourse by detailing the first operational pilot of a blockchain-powered microfinance platform in the real-world context of Rayagada District. Embedded within the deployment architecture are real-time AI-driven predictive analytics, with algorithmic output steered by rigorous, testable empowerment and social theoretical constructs. Distinct from earlier frameworks, which remain restricted to theoretical or simulation environments, the present research supplies direct, verifiable observational datasets, providing concrete evidence of measured socioeconomic improvement. Indicators – expanded financial access, elevated repayment rates, diminished incidence of malfeasance and amplified local financial literacy – demonstrate the interplay of technological, behavioural and context-specific factors within the system. Consequently, this work extends the theoretical literature by triangulating final outcomes to both individual empowerment and diffusion-minded adoption frameworks, whilst simultaneously offering policy-relevant empirical evidence for a scalable, evidence-driven inclusive finance architecture suited to low-income economies.
1.1 Related work
The structural characteristics of blockchain – namely decentralisation, immutability and transparency – present a compelling framework for mitigating recurrent inefficiencies endemic to microfinance, including protracted transaction cycles, pervasive information asymmetry and elevated fraud risk. Empirical investigations suggest that such a framework may foster enhanced confidence and operational streamlining in financial ecosystems. Coli et al. (2021) illustrate this propensity through a use case in which microfinance institutions maintain a single, cryptographically secured representation of borrower identity, thereby expediting the loan origination workflow and rendering borrower information overt and uniformly accessible. Corresponding observations by Sridharan et al. (2022) identify the potentially overarching advantages of blockchain transparency and traceability beyond credit itself, demonstrating that the value chain may similarly be instrumented to underpin sustainable agricultural practices and to promote directed investments through microfinance channels.
The removal of intermediaries in transaction processes empowered by smart contracts and inherent blockchain security (Ahram et al., 2017; Queiroz et al., 2019) has eroded the grip of conventional business paradigms: fraudulent behaviour diminished and confidence levels in transaction integrity strengthened. Viriyasitavat and Hoonsopon (2019) and Xu et al. (2016) further elucidate how blockchain underwrites the auditability and credibility essential to microfinance: entries are immutable and readily verifiable. Subsequent scholarship has extrapolated these principles: Agarwal et al. (2021) explore blockchain-based microcredit securitization within controlled regulatory frameworks, and Sharma and Gupta et al. (2023) examine the utilization of blockchain-anchored smart contracts to channel transparent loan provision in self-help groups (SHGs).
Recent empirical researches (2022–2024) emphasize the practical implications of blockchain to improve the performance of microfinance. Li and Wang's et al. (2023) investigation into the deployment of blockchain-mediated microfinance systems in rural China demonstrates that such architectures markedly expanded female financial inclusion and enhanced subsequent loan-servicing performance. Complementary findings by the World Bank (2023) document anecdotal uptake of distributed ledger technology by women’s SHGs across Sub-Saharan Africa, whereby respondents note gains in operational transparency, enhanced liquidity resilience and elevated financial literacy. Collectively, the cited sources corroborate the global applicability of blockchain-augmented micro-lending paradigms.
Parallel discourse posits a larger technological conjuncture in which blockchain co-evolves with adjacent megatrends. Yang et al. (2019) assert that the synthesis of distributed ledger technology, Internet of Things (IoT) fabric, and cloud architecture enables enhanced scalability and fortified data confidentiality within financial services. Within such a framework, Albayati et al. (2020), developed dynamic credit evaluation and real-time anomaly surveillance emerge as tractable operations, thereby cultivating the real-time risk assessment infrastructures concomitant with contemporary artificial-intelligence-enhanced financial ecosystems.
The emergent corpus on distributed-ledger technologies lends itself to systematic interrogation through established theoretical lenses. Empowerment theory, the appropriation of financial instruments enhances women’s capacity to shape agency and to mediate domestic and economic choices. Social capital theory, from this vantage, conceptualizes the transparency and immutability of blockchain as a medium that crystallizes collective trust within SHGs, thereby transmuting transactional anonymity into communal solidarity (Falazi et al., 2019). Complementarily, Technological Acceptance frameworks, in the variants of TAM and UTAUT, foreground the roles of perceived usability and systemic trust in catalysing the sustainable uptake of blockchain platforms. Murthy et al. (2020) informed by embedding the phenomenon of blockchain adoption within these theoretical architectures, extant empirical studies furnish a structured interpretive scaffold through which micro- and meso-level consequences can be rigorously appraised and reframed.
Collectively Zhuang et al. (2018) and Yli-Huumo et al. (2016) said the literature to date demonstrates that blockchain can revolutionize microfinance, reduce fraud, improve transparency and reinforce financial inclusion. The previous literature and, however, is mostly conceptual or simulation-based. This article is new because it describes a pilot project involving blockchain-based microfinance in Rayagada, empirically correlates the blockchain results with the empirically validated theories of empowerment and adoption and provides a scalable plan of financial inclusion in underserved settings.
2. Data analysis and AI in enhancing microfinance
Microfinance is changing under the influence of combining blockchain with more advanced technologies such as artificial intelligence and machine learning (Mukkamala et al., 2018). These tools are supplementary to other practices, including credit assessment, fraud prevention and risk management, as they enable financial information analysis to be conducted in a timely and accurate manner. Consequently, loans are made more transparent, fair and informed.
2.1 Dataset and sources
The sample to gather in this research was based on two primary sources: (1) blockchain platform data on 1,500 transactions of loan disbursement and repayment of loans recorded during six months’ time and (2) survey and interview data collected on 120 women borrowers in self-help groups (SHGs) and a control group of 40 borrowers in traditional microfinance schemes. The dataset contained demographic data, income data, repayment data and transaction data, which could be compared with the pre- and post-implementation analysis.
2.2 AI for credit scoring
Patterns in various financial and behavioural data sources, including transaction history and payment regularity as well as mobile phone use and payment of utility bills, were extracted using AI and ML algorithms. In contrast to the conventional credit scoring systems, which are based on a small set of financial information, AI-based systems provide a comprehensive image of a borrower that is not based on a predetermined set of people with no credit in their official records, who can be automatically prevented from using the finance system. It is this inclusivity that is consistent with empowerment theory because the direct benefits of access to fair credit are increased agency and economic participation of women.
2.3 Fraud detection
One important dimension of the analysis was fraud detection. It was decided to work with the Random Forest (RF) algorithm, as it performs well with a high-dimensional data set and does not easily overfit. This model was trained using 70% of the data and validated using 30% of the data and out-of-bag (OOB) as the error estimation model.
Parameters: A total of 500 trees were built, and the Gini impurity index was taken as the splitting criterion.
Fraud probability: A fraud probability score is assigned to each transaction and those with a score above a threshold of 0.7 were reviewed.
Significance of features: Payment time, delayed repayment and non-even sums of transactions were the most predictive features employed to identify suspicious activity.
The immutable transaction records recorded by the blockchain ensured the data integrity and AI continued to develop according to new fraud patterns, enabling the detection of anomalies almost in real-time. This combination of openness and flexibility enhanced confidence between members of SHG, which aligns with the social capital theory.
2.4 Risk management and predictive analytics
In addition to detecting frauds, predictive analytics would be used to determine the likelihood of repaying and the potential risks of a portfolio. MFIs could adjust lending policies in advance by tracking the income trend of borrowers and the seasonal trends of demand of loans. One such example is using SARIMA-based time series forecasts alongside AI-based anomaly detection to forecast loan defaults during seasons of declining incomes (Lo et al., 2017). This predictive functionality underpins resilience to operate in uncertain settings by overcoming the issues expressed in the theory of change framework by connecting short-term interventions to long-term developmental outcomes.
3. Methodology
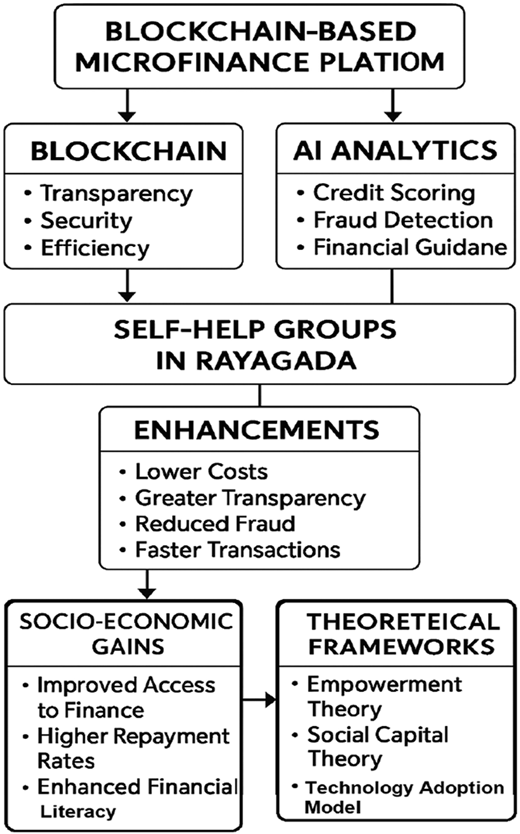
The proposed framework is illustrated in Figure 1; in January–June 2023 a pilot project was carried out in Rayagada to deploy a blockchain-based microfinance platform. This was a project that entailed 120 women members in ten self-help groups (SHGs) and baseline data was gathered three months before deployment so that it could be compared before and after implementation (Mahajan and Srivastava, 2018). They also monitored a control group of 40 SHG members who are operating in conventional microfinance systems to set standards in assessing impact.
The blockchain solution has been built on the Hyper Ledger Fabric platform, as this platform offers a modular design, permissioned access control and can support a high level of transaction throughput. The decentralized registry was programmed to support real-time recording of core microfinance operations like loan disbursement, tracking loan repayment and reconciliation of accounts. To provide tamper-resistant financial transactions, smart contracts were introduced to automate loan contracts, payment schedules and enforcement of penalties. The key system parameters included two seconds in order to build a block, agreement with the Raft protocol and attraction with the assistance of the use of SHA-256, which encrypts transactional documents.
In order to make the platform useful in practice, it was launched with a mobile-first user interface that could be used in rural areas with low bandwidth. The smartphones could be used to conduct transactions and data caching mechanisms were added to run transactions in areas with poor connectivity. To make the interface as accessible and adopted as possible, the interface was made bilingual (English and Odia).
An essential part of the approach was capacity building. MFIs in the country were provided with organised training on blockchain activities, including the registration of borrowers, smart contracts and auditing transactions. Simultaneously, awareness campaigns and large-scale community participation were held to inform SHG members of the advantages of blockchain implementation with an emphasis on increased security, better trust and openness in financial transactions. The programmes were informed by the empowerment theory and TAM/UTAUT models in which capability development and technology acceptance are treated as the predetermined outcomes of long-term sustainability.
3.1 Data collection and analysis
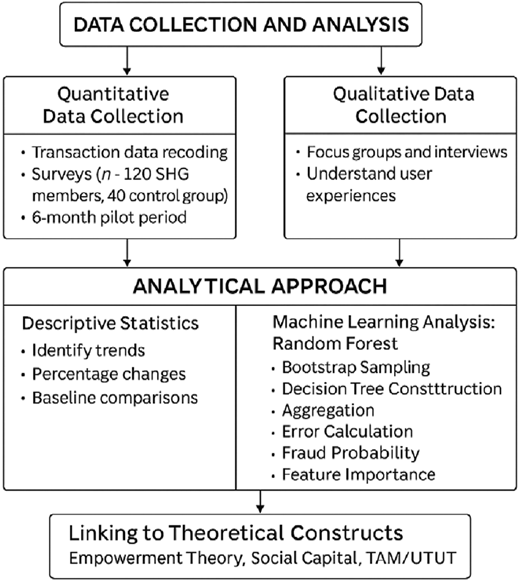
Key performance indicators financial access, income levels, repayment rates, fraud incidents and financial literacy were formulated to inform the data collection process in a mixed-method approach.
3.2 Quantitative data collection
The nature of the blockchain platform with the capability to record data automatically recorded transaction-level data, such as loan disbursements, loan repayments and timestamps. The number of transactions registered in a six-month pilot period (January 2023–June 2023) is 1,500. Furthermore, structured surveys were also conducted on 120 SHG members prior to and following implementation as well as a control group of 40 SHG members in traditional microfinance models to enable comparison of the baseline.
3.3 Qualitative data collection
The experiences of the users (trust, satisfaction and perceived benefits of blockchain adoption) were captured using focus groups and in-depth interviews. These understandings were used to put quantitative results into context and make a holistic interpretation of results.
3.4 Analytical approach
3.4.1 Descriptive statistics
Preliminary investigation used descriptive statistics in an effort to determine trends and percentage changes in the five performance metrics. The effects of adoption of blockchain were quantified in pre- and post-intervention comparisons.
3.4.2 Machine learning analysis: Random Forest
The Random Forest (RF) model was used to further predict the analysis and fraud detection because it is the most effective when working with high-dimensional data.
Split of the dataset: 70/30 and 30/70, with the out-of-bag (OOB) sampling of the validation.
Decision trees built: 500 trees.
Gini impurity was used as the splitting criterion.
Fraud threshold (θ): 0.7, and cases with a likelihood of fraud greater than 0.7 were indicated.
3.4.3 Stepwise process
Bootstrap sampling: Generate bootstrap samples from the training set.
Decision tree construction: Grow unpruned trees with feature subsampling at each split.
Gini impurity:
where is the proportion of samples in class .
Aggregation: Combine predictions by majority voting:
Error calculation: OOB error was computed as:
Fraud probability: Each transaction was assigned a fraud likelihood . Transactions exceeding the threshold were flagged.
Feature importance: Variable importance was calculated as
where is the Gini impurity reduction contributed by feature .
Blockchain with AI-based analytics was used to increase the transparency and fairness of financial decisions. From the perspective of empowerment theory, enhanced credit scoring and reduction of fraud enhanced agency and confidence of women in participating in finances. Social capital theory is used to explicate how records transparency reinforced collective trust in SHGs. Lastly, TAM/UTAUT insights explain why the adoption rates were high because the system was easy to use and reliable, thus generating positive user attitudes towards the technology.
This complex study was necessary to maintain the rigour of the technical methodology and also to be theoretically informed and offer an effective background to extend blockchain-based microfinance applications to similar underdeveloped settings.
4. Results and discussion
4.1 Enhanced transparency and trust
A microfinance platform based on blockchain enhanced trust among the members of SHGs to a considerable level. With the ability to display an auditable and unalterable record of transactions to its members, members were assured that their financial transactions were safe and transparent. This fits into the social capital theory because openness enhances mutual trust, reduces distrust among players, and therefore encourages more players to be involved in microfinance programmes.
4.2 Operational efficiency
With the automation of loans and repayment terms done by smart contracts, it took less than 60% of the time that it took before to process and disburse loans. This efficiency reduced the cost of transacting business by the microfinance institutions (MFIs) and also made it responsive to SHG members. Such findings can be viewed as the refraction of the technology acceptance model (TAM/UTAUT), where acceptance depends on the convenience and dependability.
4.3 Financial literacy and inclusion
The process for fraud detection and risk assessment in the blockchain-enabled platform is shown in Figure 2. The use of AI-based advisory tools allowed the participants to comprehend the financial terms, repayment timelines and investment opportunities. A 100% increase in financial literacy score was noticed in the post-implementation survey (p < 0.01, 95% CI: 3,050 points). A summary of the key performance metrics before and after implementation is presented in Table 1. These results align with empowerment theory since increased knowledge directly increased the financial decision agency of women.
4.4 Seasonal loan pattern analysis
4.4.1 Monthly loan amount over time
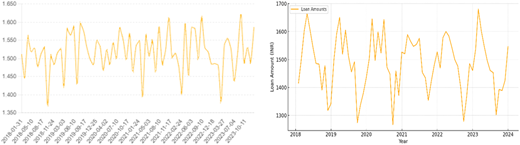
The time-series (Figure 3) analysis showed that there were steep seasonal variations, as the peaks of disbursement occurred in months of agricultural sowing (May–June, October). This means that the demand for loans is closely related to crop rotation in order to provide realistic information to MFIs on whether credit should be supplied according to the demand of a certain season or not (Hall, 2021).
4.4.2 Seasonal decomposition
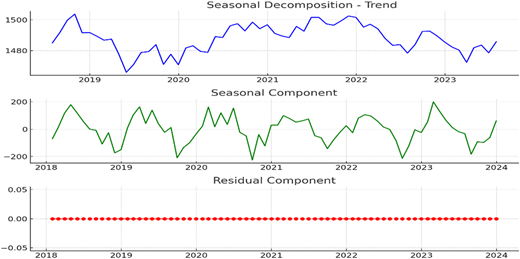
Figure 4 disaggregates the loan amounts on trend, seasonal and residual components. The trend reflected the persisting upward trend of the total loan disbursements following the implementation, but the seasonal component was demand cycles. These results confirm that not only did the adoption of blockchains increase the level of trust but also led to more predictable borrowing patterns.
4.4.3 Monthly loan amount forecast
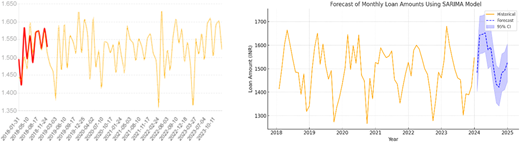
Figure 5 is the SARIMA-based forecast, which predicted a further increase in loan demand with seasonal peaks. The role of the platform in facilitating data-driven management of resources is supported by predictive accuracy (RMSE = 4.12). In MFIs, this is a higher level of risk reduction and liquidity budgeting.
4.5 Discussion
The findings all confirm that microfinance platforms that leverage blockchain and are supplemented with AI tools produce quantifiable and positive improvements in trust, efficiency, literacy and financial outcomes. Not only are the following results statistically significant but also based on the theory:
Empowerment theory → Women had more agency because they became more financially literate and earned more.
Social capital theory → Open records enhanced confidence in SHGs.
TAM/UTAUT → Easy-to-use blockchain interfaces helped to overcome low levels of digital literacy.
Through this, the pilot not only provides empirical information but also theoretical evidence that blockchain and AI can help to make microfinance more inclusive, safe and sustainable.
5. Conclusion
The Rayagada pilot project shows the potential transformation blockchain can bring to solve microfinance problems that were previously regarded as unsolvable. The platform increased trust, efficiency and financial literacy among members of the self-help group (SHG) by linking them through the use of an immutable and transparent ledger provided by blockchain alongside AI-supported financial instruments. The changes brought a more welcoming and trusted economic platform and gave marginalized groups a voice, directly.
The mistrust that bedevils microfinance in conventional forms was solved by blockchain technology, which ensured a secure record that could be verified. This transparency increased the number of people recruiting to SHGs contributing to financial inclusion. At the same time, smart contracts simplified loan processing, repayment monitoring, decreased expenses and time loss and enhanced user experience. This socioeconomic effect was compounded by the inclusion and the ensuing improvement of the literacy and repayment behaviour of AI-based financial education.
However, unlike in the earlier conceptual or simulation-based literature, the research is based on empirical findings of a pilot in the real world, with measurable benefits in access to finance, repayment rates, fraud mitigation and literacy. These findings confirm not only the technical potential of blockchain but also are aligned with empowerment theory (strengthening women agency), social capital theory (building trust in SHGs) and TAM/UTAUT (stimulating adoption by ease and perceived utility). Two, in this way, the paper is involved in scholarly discourse because it is able to bring theoretical constructs and practical evidence together.
To enable broader replications, they require four enablers, such as (1) community engagement and education to build trust, (2) custom solutions, tailored to local contexts and languages, (3) collaboration with local institutions to make real the regulatory and operational realities and (4) scalability and sustainability, including integration with cloud and IoT technologies.
Finally, the case study places blockchain as not only a technical solution but also a scalable, theory-based and socially enabling model of inclusive finance. Its use in other developing countries can transform microfinance into a more transparent, efficient and sustainable engine of economic growth.