


In this paper, we examine the impact of stakeholder orientation on environmental performance and on financial benefits from environmental performance. We use firm-level data from Canada and the United States spanning the years 2002 to 2020 and classify all Canadian firms and those U.S. firms located in states that have passed constituency statutes as stakeholder-oriented. We first show that Canadian firms and stakeholder-oriented U.S. firms have better environmental performance than shareholder-oriented U.S. firms. We then find that good environmental performance increases profits and valuations for all firms in the U.S., but especially for shareholder-oriented firms. For Canadian firms overall there is no consistent financial impact. Moreover, the financial impact of environmental performance becomes negative for Canadian firms after the Supreme Court decision in 2008 on BCE Inc. vs. 1976 Debentureholders, stating that the duty of the board of directors is to act in the best interest of the corporation, not its shareholders. The U.S. results for valuations are robust after taking into account potential endogeneity issues using instrumental variables and dynamic panel regressions. Thus, our results suggest a trade-off between firm environmental and financial performance under different governance schemes. On the one hand, stakeholder orientation decreases financial benefits from firms’ environmental performance. On the other hand, shareholder orientation may be detrimental to the environment. This has important policy implications for the current debate on climate change mitigation.
1 Introduction
Climate change is deemed to be “the biggest threat to security that modern humans have ever faced,” according to the famed naturalist and film-maker David Attenborough.1 Most scientists would concur (see, e.g., the joint editorial published simultaneously in more than 200 medical journals on September 16 , 2021)2. In addition to rising temperatures, we are facing challenges due to loss of biodiversity, increasing incidence of forest fires, severe droughts and flooding, and lack of water, to name just a few of the issues facing humanity. To address these grand issues, it is imperative to motivate buy-in from the private sector. Therefore, understanding whether and how companies can transfer high environmental performance into financial returns is an important task for academic scholars, that is, the business case for doing good.
In this paper, we study and compare the environmental performance of publicly listed companies in Canada and the United States. In particular, we examine the financial impact of environmental performance, and whether companies in the two countries benefit financially from performing well environmentally. Canada and the U.S. represent an interesting case for comparison. They share the same legal origin – common law3 – but differ historically and culturally. Legal origin has been shown to be a stronger predictor of Environmental, Social and Governance (ESG) performance (Liang and Renneboog, 2017) than other country or firm characteristics; nonetheless, the other characteristics may still play a significant role. In this paper, we focus on the differences between corporate governance paradigms in Canada and the U.S. in explaining environmental performance and its financial impacts on firms.
We also utilize the fact that 35 U.S. states have adopted constituency statutes. A common provision in constituency statutes is that “the board of directors of a corporation may consider the interests and effects of any action upon non-shareholders” (Bisconti, 2009). Thus, the adoption of constituency statutes, starting in 1984 in Ohio, throughout the 1980s and early 1990s in most of the states, and ending with Texas in 2006, may have impacted the environmental performance of U.S. firms and financial benefits from it.
The current literature argues that whether a high environmental, or more generally, environmental and social (ES), performance leads to higher shareholder value depends on the governance model a firm adopts. Rooted in instrumental stakeholder theory (Jones, 1995), a shareholder-oriented governance scheme postulates that the corporate directors owe fiduciary duty to the shareholders, and all corporate actions, including ES activities, should strive to increase value for shareholders (Friedman, 1970; Jones, 1995; Jones and Wicks, 1999). Therefore, firms located in jurisdictions where corporate governance is firmly rooted in enhancing shareholder value will choose to engage in environmental activities only when they perceive that achieving higher environmental performance will lead to better financial outcomes. In contrast, a stakeholder-oriented governance scheme postulates that the fiduciary duty of a firm’s directors and managers is owed to all stakeholders of a firm (Donaldson and Preston, 1995; Donaldson, 1999). Therefore, achieving high environmental performance does not necessarily lead to better financial outcomes, which only reflect the shareholders’ interest in the firm. Furthermore, the efficacy of environmental performance should be judged in a way that is commensurate with the goal of the activities (Wood and Jones, 1995).
We first show that environmental scores (E scores), based on Refinitiv ratings, are significantly higher for Canadian firms than for U.S. firms. We get even stronger results when we examine ES performance: Canadian firms have clearly higher ES scores. We next examine if the landmark 2008 Canadian Supreme Court decision, BCE Inc. vs. 1976 Debentureholders, had any impact on Canadian E scores. This decision arguably changed the fiduciary duty of Canadian companies towards a more stakeholder-oriented direction. We find that BCE Inc. vs. 1976 Debentureholders had no impact. This result is consistent with Tingle and Spackman (2019), who show that the decision did not affect litigation patterns, takeover premiums or corporate valuations in Canada. We also show that firms incorporated in U.S. states that have adopted constituency statutes have higher E scores than firms from other states. The difference is not as large as the difference between Canadian and U.S. firms.
We next study the impact of environmental performance on three financial outcomes: systematic risk (beta), valuation (Tobin’s Q), and profitability (Return on Assets (ROA)). We find that environmental performance has a positive impact on Tobin’s Q and ROA for U.S. firms. Interestingly, high environmental performance does not lower beta, even though the previous literature (e.g., Albuquerque et al., 2019) has shown that ES activities decrease beta4. For Canadian firms, we find very different and puzzling results: good environmental performance lowers Tobin’s Q and there is even weak evidence that environmental performance increases beta.
One reason for these findings is that the industrial structure and firm distribution are very different between Canada and the U.S.: the Canadian economy is dominated by the resource sector (energy and mining), whereas in the U.S. stock market high-tech firms play a significant role. The differences between Canadian and U.S. companies are manifested in a few key variables: U.S. firms have on average higher valuations (measured by Tobin’s Q and book-to-market ratio) and are more profitable (higher ROA) but have lower systematic risk (measured by beta). In our baseline regressions, we do control for industry, but in order to make sure that our results are not driven by the different types of firms in the two countries, we employ propensity score matching. We match firms in the two countries based on their age, size and industry. Our results remain qualitatively the same, albeit with a lower level of statistical significance for the matched U.S. sample.
We then turn to examining how corporate governance regimes affect financial results. We find that if firms are incorporated in states that have adopted constituency statutes, our results get weaker: High E scores have less of a positive impact on Tobin’s Q and ROA. There is no impact on beta, for which the effect of environmental performance remains insignificant. Our results for the U.S. firms indicate that more stakeholder-oriented corporate governance regimes change the motivation for and intent of corporate environmental performance. When firms are interested in maximizing only shareholder wealth, environmental performance serves that purpose. When firms become more stakeholder friendly, the positive link weakens. Thus, the adoption of constituency statutes makes U.S. firms behave in a more Canadian way.
We also examine whether the reverse is true: if Canadian firms become more like U.S. firms, does environmental performance start to have a positive financial impact? It is common for Canadian firms to also list on the New York Stock Exchange, in addition to being publicly traded in Toronto. We find that cross-listing has no impact on the association between E score and financial performance for Canadian firms. Canadian firms behave the same way no matter where they are listed. Our results contrast with that of Boubakri et al. (2016), who show that better ESG performance leads to higher valuations for cross-listed firms.
We also study how the 2008 Supreme Court decision of BCE Inc. vs. 1976 Debentureholders has affected financial outcomes. We first examine whether there is any difference between financial outcomes for the U.S. firms during the early period the early period of 2002–2008 compared to the late period from 2009 onwards. The rationale for this is that good environmental performance may have become more ubiquitous after the Kyoto Protocol came into effect in 2005 and after the United Nations Copenhagen Climate Summit that took place in 2009. Albuquerque et al. (2019) postulate that environmental performance (or in general, ESG performance) will have a positive impact on financial outcomes if the environmental performance is a differentiating factor for the firm adopting the policy. In this regard, the results for the U.S. are mixed: the results for Tobin’s Q are as expected, significantly positive for the early period, but insignificant in the latter period. The results for beta and ROA do not follow this pattern. For Canada, the results are better. Both the Supreme Court of Canada decision and the expectation that more firms would have better environmental performance should lead to the same outcome: the financial impact of environmental performance should have less positive (or more negative) impact starting in 2009. This is what we find for Tobin’s Q, but the results for beta and ROA remain the same. The negative impact on Tobin’s Q is more likely due to the 2008 decision on BCE Inc. vs. 1976 Debentureholders, since Canadian companies had very little political pressure to adopt more environmentally friendly policies. The conservative government of Stephen Harper came into power in 2006, and Prime Minister Harper famously declared that the Kyoto protocol is a “socialist scheme to suck money out of wealth-producing nations”.5 Canada eventually withdrew form the Kyoto protocol in 2011.6
We have established that good environmental performance for U.S. firms is associated with improved financial performance. To establish causality, we follow Albuquerque et al. (2019) and use the political orientation of U.S. states as an instrument. Support from democratic politicians leads to better environmental and social outcomes (Di Giuli and Kostovetsky, 2014), but is unrelated to financial outcomes (Albuquerque et al., 2019). In our instrumental variable regression, we show that the positive connection between environmental performance and Tobin’s Q is robust. There is no effect on ROA, so that result is likely just an association. We conclude by estimating dynamic panel regressions for both the U.S. and Canada. The environmental score has a positive impact on Tobin’s Q for the U.S. firms, as in all previous regressions.
For the Canadian firms, as always, there are no significant results.
The remainder of this paper is organized as follows: Section 2 reviews the related literature. Section 3 describes our methodology and data. Section 4 discusses our empirical results. Section 5 addresses the endogeneity issues and provides other robustness checks. Section 6 concludes and discusses our contributions.
2 Literature Review
For decades, scholars have been trying to answer a fundamental question: whether corporations can achieve better financial outcomes by increasing their environmental and social performance, that is, the notion of “doing well by doing good”. There is now overwhelming evidence that better ES performance is positively associated with better financial outcomes. For example, a metaanalysis by Friede et al. (2015) shows that about 90% of studies examining the link between ES performance and financial outcomes find a non-negative, mostly positive relationship. The difficulty, though, has been in identifying the direction of causality and the underlying mechanisms for the positive association between ES performance and financial outcomes: is it the case that firms in strong financial condition can afford to engage in ES activities, or is it that ES activities add value to shareholders? Several recent papers have asserted a positive causal link between ES activities and firms’ financial outcomes. El Ghoul et al. (2011) employ instrumental variables estimation and dynamic panel data methods to show causality from ES activities to lower cost of capital. Albuquerque et al. (2019) similarly use instrumental variables estimation to demonstrate a causal link from ES to reduced systematic risk and increased valuations. Dimson et al. (2015) and Krüger (2015) use event-study analyses to link ESG events to subsequent firm financial performance; their method alleviates concerns about reverse causality and omitted variables. Flammer (2015) employs the regression discontinuity design to show that successful shareholder ES proposals result in positive abnormal returns. However, careful research has also shown that corporate endeavours to increase ES performance can backfire and result in negative outcomes. List and Momeni (2021) show, in a natural field experiment, that introducing ES policies can lead employees to shirk in their primary job duties. Masulis and Reza (2015) use the 2003 Tax Reform Act, which reduced personal tax rates on dividends, as an exogenous event to show that corporate giving – a component of ES policies – reduces shareholder wealth.7
Evidence regarding environmental performance on financial outcomes is not as abundant as that of ESG, but it is growing fast. There is an increasing amount of evidence showing that high environmental standards and policies lead to better firm outcomes. In an early attempt, Russo and Fouts (1997) find that the relationships between environmental performance and financial outcomes are generally positive, especially in industries with high growth rates. Dowell et al. (2000) show that U.S. multinational companies have higher valuations when they adopt stringent global environmental standards rather than more lax local standards. In a 58-country study, Miroshnychenko et al. (2017) provide evidence that pollution prevention and green supply chain practices are the main ingredients that lead to positive financial impacts.
Interestingly, regulatory risk, rather than physical risk, seems to be the most important environmental risk facing companies and potentially affecting financial outcomes (Stroebel and Wurgler, 2021). Horváthová (2010) shows in a meta-analysis that the impact of environmental performance on financial outcomes is mixed and depends on the econometric methods used. The impact can be either negative or positive. The author also finds that the impact is more likely to be positive in common-law countries, such as Canada and the U.S., compared to civil-law countries in continental Europe. Ambec and Lanoie (2008) argue that firms that are less scrutinized by regulators, have fewer employees, and sell homogenous products are less likely to benefit financially from good environmental performance. There is solid evidence that bad environmental performance hurts companies financially. Flammer (2013) shows that firms experience larger stock price declines for irresponsible environmental behavior when they face increased public scrutiny. Fernando et al. (2017) provide evidence that institutional investors shun stocks with high environmental risk exposure and these stocks have lower valuations.
Investors are also paying more attention to environmental risks. Krueger et al. (2020) survey institutional investors about their climate risk perceptions. The authors provide evidence that climate risks, especially regulatory risks, are important and are already affecting risks and returns for stocks. Consistent with this conclusion, Chava (2014) finds that investors demand higher expected returns and charge higher interest rates for firms with environmental concerns. Bolton and Kacperczyk (2021) show that investors are demanding higher compensation for investing in companies with significant carbon emissions. Hsu et al. (2023a) provide evidence that firms with high toxic emissions yield high stock returns as compensation for pollution risk. Investors have also a direct impact on carbon emissions. Azar et al. (2021) show that the “Big Three” (BlackRock, Vanguard, and State Street Global Advisors) reduce carbon emissions when they engage with their portfolio companies.
Current research on the relationship between ES performance and financial outcomes for Canadian firms is relatively scarce. However, the conclusions seem to be consistent: usually, at best, no positive relationship can be identified between ESG and financial outcomes. For example, Makni et al. (2009) find no significant relationship between overall ESG and financial performance for Canadian firms, and a detrimental effect of environmental performance on profitability. Similarly, Mahoney and Roberts (2007) find that although high ESG leads to an increase in the number of institutions investing in the firm, it does not lead to better financial performance. Research done by May and Khare (2008) confirms that the relationship between ESG and accounting performance is at best mixed, and that ESG’s impact on market value is non-significant in Canada. These results call for further investigation of the reasons for such disparate outcomes of ESG between Canada and the rest of the world. However, the limited research in the Canadian context has failed to explore the reasons for its uniqueness, but rather has left it as an area for future research (e.g., Mahoney and Roberts, 2007).
Liang and Renneboog (2017) show that legal origin is a stronger driver than firm and country characteristics (such as political institutions) in explaining the environmental and social performance of firms. Interestingly, firms from common-law countries have lower ES performance than companies from civil-law countries, with Scandinavian civil-law firms having the highest ES ratings. Similarly, Cai et al. (2016) provide evidence that firm characteristics explain very little of the variations in ES ratings. In contrast, variations in country factors, such as culture and institutions, have more explanatory power. Furthermore, Cai et al. (2016) find that home-country factors explain a smaller portion of the overall variation in environmental and social performance for multinational companies and cross-listed firms than they do for purely domestic firms.
Despite the dominance of legal origins, firm-level corporate governance has also been shown to affect environmental and social policies. Ferrell et al. (2016) find that well-governed firms that suffer less from agency concerns engage more in ES activities. They also document a positive relation between ES performance and corporate valuation for firms that do not suffer from serious agency problems. For country-level corporate governance, Tingle and Spackman (2019) study the effects of the Supreme Court of Canada’s 2008 decision, BCE Inc. vs. 1976 Debentureholders, which changed the nature of the fiduciary duty for Canadian companies. They find that the move from shareholder orientation to a stakeholder regime does not appear to produce any impacts on takeover premiums, asset values, and equity risk premiums. The authors conclude that in order for corporate behavior to change, many other things would have to be changed, such as securities law and executive compensation practices. Indeed, Lin (2021) concludes that the corporate governance paradigm shift since BCE seems more symbolic than judicially substantive in practice.
A significant part of the literature on constituency statutes has focused on the efficacy of the statutes on the takeover market, since constituency statutes were generally enacted to fend off hostile takeover bids to protect stakeholders (e.g., Flammer and Kacperczyk, 2016; Gao et al., 2021). Bebchuk and Tallarita (2020) show that managers seldom use the power granted to them by constituency statutes to protect stakeholder interests in takeovers, and even if they do so, their actions are cosmetic and inconsequential. Bebchuk et al. (2020) further add that constituency statutes do not make managers better at considering stakeholder interests, whether in takeovers or in the overall operations of firms. Apart from takeover protection, the existing finance literature also examines the enactment of constituency statutes more generally from the stakeholder-orientation perspective. For example, Flammer and Kacperczyk (2016) find that the statutes increase firms’ patent counts, citations, and originality. Gao et al. (2021) show that the spread of bank loans decreases after the enactment of constituency statutes. Both papers attribute the increase in patents and the decrease in bank loan spreads to the stronger stakeholder orientation provided by constituency statutes.
3 Methodology
3.1 Data
We form our sample by combining the Thomson Reuters Refinitiv database for environmental performance, Compustat Capital IQ for financial information, Center for Research in Security Prices (CRSP) for stock market data for U.S. firms, and Thomson Reuters Datastream and Canadian Financial Markets Research Center (CFMRC) for stock market data for Canadian firms. Our final sample contains 26,519 unique firm-year observations (22,898 for U.S. firms and 3,621 for Canadian firms) from 2002 to 2020, although the actual number of observations in each model specification might vary depending on the availability of the dependent variables.
3.2 Dependent Variables
where ritis the value-weighted return for firm i at time t and rmtis the market value-weighted return at time t. For the U.S. firms, the market return is the value-weight return of all CRSP firms incorporated in the U.S., and the market proxy for Canada is the value-weighted return of all CFMRC firms incorporated in Canada. The r0 is the risk-free rate for the market model, measured as the one-month Treasury Bill rate for the U.S. and Canada, respectively. We calculate beta using monthly returns for each firm.
Second, we measure market value using Tobin’s Q, calculated as the market value of equity plus liquidation value of preferred shares and book value of debt over total assets (e.g., Chung and Pruitt, 1994; Jayachandran et al., 2013; Hawn and Ioannou, 2016). Lastly, we calculate profitability as the return on assets (ROA), which is measured as total net income over total assets ( Wang et al., 2015; Flammer, 2015).
3.3 Independent Variables
We use the Thomson Reuters Refinitiv ESG database to measure environmental scores. The Refinitiv database is widely accepted to be a reliable database for firm ESG performance in various disciplines (Ioannou and Serafeim, 2012; Bae et al., 2021; Habermann and Fischer, 2023). Compared with other major ESG rating databases such as MSCI, Refinitiv has better coverage in global stock markets outside of the U.S., including Canada (Habermann and Fischer, 2023). The database covers over 12,000 global companies across 76 different countries since 2002 (Refinitiv, 2023). Specifically, it provides ESG ratings for U.S. firms in the S&P 500 composite index and Canadian companies on the
Toronto Stock Exchange (TSX) composite (Refinitiv, 2022). Since this paper compares U.S. and Canadian firms, we believe that the Refinitiv database is the most suitable for our study.
Refinitiv rates the ESG performance of each firm based on multiple sources, such as company annual financial and ESG reports, non-government organization reports, stock exchange filings, and news sources (Refinitiv, 2022). The ratings are calculated based on over 630 individual criteria and compiled into three final pillar scores, namely the environmental, social, and corporate governance scores. The pillar scores are normalized to percentage ratings between 0 and 100, with 0 indicating poor performance and 100 indicating excellent achievements in a specific category (Refinitiv, 2023). We use the overall environmental score as the main independent variable in our analyses.8
3.4 Moderating Variables
To further compare the relationship between environmental performance and financial outcomes between the U.S. and Canada, we incorporate relevant firmlevel and state-level moderators in the analysis. First, one may argue that the institutional environments in the U.S. and Canada are significantly different, which may lead to a divergent environmental–financial performance relationship between the two countries. In order to test whether a stakeholder-oriented institutional environment significantly changes the relationship between environmental and financial performance, we create a constituency dummy that equals one if a U.S. firm is incorporated in a state that passed a constituency statute, and zero otherwise (Ni, 2020; Luoma and Goodstein,1999).9 We expect firms in constituency statute states will experience less financial benefit from high environmental performance.
Second, we create a dummy variable, cross-listing, that equals one if a Canadian firm is cross-listed in any jurisdiction outside of Canada, and zero if it remains domestic. If the differences in economic and legal environments between the two countries impact the relationship between environmental and financial performance, we should expect that cross-listed Canadian firms show similar results as U.S. firms, whereas not cross-listed Canadian firms would show divergent results.
3.5 Control Variables
For all our analyses, we add a number of control variables that may influence a firm’s environmental performance and financial outcomes (e.g., Albuquerque et al., 2019; Hull and Rothenberg, 2008), including firm size, operating leverage, capital expenditure, financial slack, earnings variability, book-to-market ratio, institutional ownership, and industry environmental score volatility. All of the independent and control variables are lagged by one year, following the current literature (e.g., Hillman and Keim, 2001; Waddock and Graves, 1997; Lu et al., 2022). Detailed descriptions of the variables used in the analyses are listed in Appendix A. Unless otherwise specified, we include year-fixed effects to control for time-varying heterogeneity and industry-fixed effects at the 3-digit SIC level to control for the industry effects that do not change over our sample period. The standard errors are clustered at the firm level for all regression models. In order to remove the influence of significant outliers, we winsorize all continuous variables at the (1, 99) level.
4 Results
The summary statistics for all variables are presented in Table 1. The results show that, except for the correlations between the ES score and the separate E score, all bivariate correlations are below 0.6. The highest correlation is between firm size and ES score (0.52). Moreover, the variance inflation factors (VIF) for all independent variables are below 2.00.10 Therefore, we confirm that the data does not suffer from multicollinearity issues.
In Table 2, we compare the summary statistics for the U.S. and Canadian firms. Overall, the U.S. and Canadian firms are similar in size. However, Canadian firms tend to have lower operating leverage, slack, and earnings variability but higher capital expenditure and book-to-market ratio. On average, Canadian firms have higher ES and environmental scores and lower environmental score variability than their U.S. counterparts. This indicates that Canadian firms may strive to achieve high environmental performance due to institutional pressure (DiMaggio and Powell, 1983; Brower and Dacin, 2020). Moreover, Canadian firms tend to have higher beta but lower profitability than U.S. firms, indicating that Canadian firms are more vulnerable to market fluctuations. Firms in the two countries also show significant differences in market capitalization in terms of both Tobin’s Q and book-to-market ratio.
Descriptive statistics.
| Mean | SD | 1 | 2 | 3 | 4 | 5 | 6 | 7 | 8 | 9 | 10 | 11 | 12 | 13 | |
|---|---|---|---|---|---|---|---|---|---|---|---|---|---|---|---|
| Beta | 1.15 | 1.11 | |||||||||||||
| Tobin’s Q | 1.79 | 1.58 | –0.06*** | ||||||||||||
| ROA | 0.03 | 0.12 | -0.11*** | 0.09*** | |||||||||||
| ES Score | 0.42 | 0.28 | -0.01** | -0.08*** | 0.18*** | ||||||||||
| Env. Score | 0.41 | 0.31 | -0.01 | -0.08*** | 0.15*** | 0.95*** | |||||||||
| Shareholder Relations | 0.51 | 0.29 | 0.01** | -0.04*** | 0.04*** | 0.15*** | 0.14*** | ||||||||
| Env. Volatility | 0.29 | 0.04 | -0.06*** | 0.13*** | -0.02*** | 0.20*** | 0.22*** | -0.03*** | |||||||
| Firm Size | 8.34 | 1.70 | -0.02*** | -0.32*** | 0.19*** | 0.52*** | 0.47*** | 0.10*** | -0.08*** | ||||||
| Operating Leverage | 0.91 | 1.00 | 0.02*** | 0.14*** | -0.45*** | -o.n*** | -0.10*** | -0.04*** | 0.13*** | -0.26*** | |||||
| CAPEX | 0.04 | 0.05 | 0.08*** | -0.01 | 0.02*** | 0.07*** | 0.06*** | 0.04*** | -0.07*** | -0.07*** | -0.03*** | ||||
| Cash Slack | 0.14 | 0.17 | 0.00 | 0.45*** | -0.20*** | -0.14*** | -0.13*** | -0.05*** | 0.15*** | -0.36*** | 0.38*** | -0.13*** | |||
| Earnings Variability | 0.02 | 0.03 | 0.05*** | -0.09*** | -0.06*** | 0.03*** | 0.03*** | 0.01* | 0.03*** | 0.09*** | 0.05*** | 0.05*** | 0.01* | ||
| BM Ratio | 0.53 | 0.48 | 0.11*** | –0.44*** | -0.19*** | -0.06*** | -0.06*** | 0.02*** | -0.16*** | o.n*** | -0.08*** | 0.00 | —0.24*** | 0.06*** | |
| Inst. Ownership | 0.68 | 0.23 | 0.05*** | 0.06*** | 0.17*** | 0.13*** | 0.12*** | 0.07*** | 0.06*** | 0.14*** | -0.11*** | -0.08*** | -0.01* | 0.03*** | -0.15*** |
Generally speaking, the comparison shows that Canadian firms outperform U.S. firms in environmental and ES performance, but do not show signs of financial benefit from it. Moreover, institutional pressure may be an important factor that leads to convergence in both environmental performance and financial performance for Canadian firms compared with U.S. firms. These results call for a comparative analysis of the relationship between ES performance and financial outcomes for the two countries.
4_1 Environmental Performance and Firms’ Country of Origin
In this section, we investigate the environmental performance of firms in the U.S. and Canada. In the analysis, we include various indicators that might affect the corporate governance model of the firms. First, we include a Canadian dummy variable, which equals one if the firm is domiciled in Canada, and zero if the firm is domiciled in the U.S. A firm’s country of origin is important as national institutional differences might impact its engagement in the ES and environmental issues (e.g., Freeman and Hasnaoui, 2011; Thorne et al., 2017).
Second, for Canadian firms, we use a post-2009 dummy variable that equals one if it is after the year 2008 and zero otherwise. In 2008, a Supreme Court ruling in Canada made it clear that the fiduciary duty of the directors should be to the corporation, not its shareholders. Specifically, the Supreme Court of Canada made a decision in BCE Inc. vs. 1976 Debentureholders rejecting Revlon’s duties to maximize shareholder value in connection with a change of control transaction. In its decision, the court specifically provided that “the fiduciary duty of the directors to the corporation originated in common law. It is a duty to act in the best interests of the corporation. Often the interests of shareholders and stakeholders are co-extensive with the interests of the corporation. But if they conflict, the directors’ duty is clear – it is to the corporation.” 11Consequently, after the ruling, the fiduciary duty of directors was expected to no longer be solely focused on the maximization of shareholder value.
Third, for U.S. firms, we include the constituency statutes dummy in the regression. The passage of constituency statutes is widely considered to have facilitated a stronger firm focus on stakeholder interests in corporate decisionmaking (Ni, 2020; Luoma and Goodstein, 1999). We present the results of the regressions of ES and E scores, including a number of control variables together with year and industry fixed-effects, in Table 3. We find that Canadian firms have consistently higher scores across the ES and E dimensions than their U.S. counterparts, even after controlling for industry composition differences, time fixed-effects and other standard firm-level controls. On average, Canadian firms have a 16.95% higher ES score (with a mean of 0.46) and a 17.11% higher E score (with a mean of 0.45) than U.S. firms (Columns (1) and (2) of Table 3).
Comparison of U.S. and Canadian firms.
| Canadian Firms (1) | U.S. Firms (2) | Difference in Mean: (l)-(2) | |||||||||
|---|---|---|---|---|---|---|---|---|---|---|---|
| Mean | SD | Min | Max | Mean | SD | Min | Max | Mean diff | t stat. | P value | |
| Beta | 1.24 | 1.35 | -1.89 | 6.26 | 1.13 | 1.07 | -2.33 | 4.69 | 0.11*** | 5.44 | 0.000 |
| Tobin’s Q | 1.19 | 0.90 | 0.08 | 5.61 | 1.90 | 1.64 | 0.13 | 9.78 | -0.71*** | -25.05 | 0.000 |
| ROA | 0.02 | 0.10 | -0.51 | 0.27 | 0.03 | 0.12 | -0.60 | 0.28 | -0.01*** | -3.39 | 0.000 |
| ES Score | 0.46 | 0.28 | 0.07 | 0.95 | 0.41 | 0.28 | 0.08 | 0.95 | 0.05*** | 9.20 | 0.000 |
| Env. Score | 0.45 | 0.29 | 0.09 | 0.95 | 0.40 | 0.31 | 0.09 | 0.95 | 0.05*** | 8.68 | 0.000 |
| Shareholder Relations | 0.50 | 0.29 | 0.00 | 1.00 | 0.51 | 0.29 | 0.00 | 1.00 | -0.02*** | -3.04 | 0.001 |
| Env. Volatility | 0.27 | 0.04 | 0.15 | 0.34 | 0.29 | 0.04 | 0.15 | 0.34 | -0.02*** | -23.10 | 0.000 |
| Firm Size | 8.33 | 1.70 | 5.09 | 13.49 | 8.35 | 1.70 | 4.11 | 12.81 | -0.02 | -0.54 | 0.295 |
| Operating Leverage | 0.78 | 0.49 | 0.13 | 3.99 | 0.93 | 1.05 | 0.19 | 9.95 | -0.15*** | -8.37 | 0.000 |
| CAPEX | 0.07 | 0.07 | 0.00 | 0.30 | 0.04 | 0.04 | 0.00 | 0.25 | 0.03*** | 34.95 | 0.000 |
| Cash Slack | 0.08 | 0.11 | 0.00 | 0.57 | 0.15 | 0.17 | 0.00 | 0.82 | -0.07*** | -22.65 | 0.000 |
| Earnings Variability | 0.01 | 0.02 | 0.00 | 0.15 | 0.02 | 0.03 | 0.00 | 0.24 | -0.01*** | -9.43 | 0.000 |
| BM Ratio | 0.77 | 0.72 | -0.26 | 4.62 | 0.49 | 0.42 | -0.60 | 2.29 | 0.28*** | 32.65 | 0.000 |
| Inst. Ownership | 0.42 | 0.20 | 0.01 | 0.90 | 0.72 | 0.21 | 0.09 | 1.00 | -0.30*** | -80.71 | 0.000 |
However, in columns (3) and (4) of Table 3, we find that the coefficient of the post-2009 dummy is not statistically significant for Canadian firms. This indicates that the Supreme Court ruling against shareholder-centric governance does not increase environmental performance for Canadian firms. In column (5) of Table 3, we show that U.S. firms headquartered in states that passed constituency statutes have an E score on average 3.4% higher than firms in states without constituency statutes.
We also investigate the influence of constituency statutes for U.S. firms only. Columns (6) and (7) of Table 3 show how the E and ES scores differ between U.S. firms in states with and without constituency statutes. The results show that the constituency dummy is significant and positive for both the E and ES scores regressions, indicating that firms in states that have passed the constituency statutes outperform those in other states in terms of environmental and social performance. On average, firms in states with constituency statutes have a 4.4% higher ES score (with a mean of 0.41) and a 3.5% higher E score (with a mean of 0.40).
Overall, the results are consistent with the previous literature, which finds that Canadian firms are under higher institutional pressure to adopt a stakeholder-oriented governance policy, whereas U.S. firms are more shareholderoriented in terms of governance policies (e.g., Kuras, 2000). Similar comparisons between stakeholder-oriented and shareholder-oriented states in the United States are also observable from the results.
4.2 Environmental Score and Firm Financial Outcomes
Table 4 shows the comparison between U.S. and Canadian firms in terms of the relationships between all dependent variables and the E score. We find similar profit-maximization effects of environmental performance on ROA and
Tobin’s Q as previous research for U.S. firms (e.g., Albuquerque et al., 2019; Tang et al., 2012; Jayachandran et al., 2013; Flammer, 2015). Looking at columns (2) and (3) of Table 4, one standard deviation increase in E score increases Tobin’s Q by 2.72% (with a mean of 1.90) and increases ROA by 18.6% (with a mean of 0.03) for U.S. firms. The results show that U.S. firms financially benefit from higher E scores, demonstrating their capabilities in transforming environmental performance into financial returns. Interestingly, we do not find any risk-reduction effect of E score. The coefficient of the E score in the beta regression for U.S. firms is negative but non-significant.
E and ES score as dependent variable, canada dummy and constituency dummy.
| (1) | (2) | (3) | (4) | (5) | (6) | (7) | |
|---|---|---|---|---|---|---|---|
| All Firms | US Firms Only | ||||||
| ES score | Env. Score | Env. Score | Env. Score | Env. Score | ES score | Env. Score | |
| Canada Dummy | 0.078*** (0.012) | 0.077*** (0.013) | 0.077*** (0.013) | 0.089*** (0.020) | 0.083*** (0.013) | ||
| Dummy 2009 | -0.021 (0.024) | -0.019 (0.025) | |||||
| Canada Dummy X Dummy 2009 | -0.014 (0.018) | ||||||
| Constituency Dummy | 0.016* (0.008) | 0.018** (0.007) | 0.014* (0.008) | ||||
| Env. Volatility | -0.020 (0.110) | 0.088 (0.118) | 0.088 (0.118) | 0.087 (0.118) | 0.099 (0.118) | -0.112 (0.115) | 0.130 (0.130) |
| Firm Size | 0.120*** (0.002) | 0.123*** (0.003) | 0.123*** (0.003) | 0.123*** (0.003) | 0.123*** (0.003) | 0.121*** (0.002) | 0.124*** (0.003) |
| Operating Leverage | 0.001 (0.002) | 0.003 (0.002) | 0.003 (0.002) | 0.003 (0.002) | 0.003 (0.002) | -0.000 (0.002) | 0.002 (0.002) |
| CAPEX | 0.051 (0.069) | 0.117 (0.074) | 0.117 (0.074) | 0.115 (0.074) | 0.117 (0.074) | 0.123 (0.084) | 0.153* (0.092) |
| Cash Slack | 0.055*** (0.021) | 0.076*** (0.024) | 0.076*** (0.024) | 0.076*** (0.024) | 0.081*** (0.024) | 0.043** (0.022) | 0.064*** (0.025) |
| Earnings Variability | -0.365*** (0.085) | -0.306*** (0.090) | -0.306*** (0.090) | -0.307*** (0.090) | -0.295*** (0.091) | -0.317*** (0.081) | -0.256*** (0.089) |
| BM Ratio | -0.039*** (0.005) | -0.038*** (0.006) | -0.038*** (0.006) | -0.038*** (0.006) | -0.038*** (0.006) | -0.058*** (0.006) | -0.055*** (0.007) |
| Inst. Ownership | 0.020 (0.014) | 0.003 (0.016) | 0.003 (0.016) | 0.003 (0.016) | 0.005 (0.016) | 0.007 (0.014) | -0.015 (0.016) |
| Constant | -0.593*** (0.037) | -0.652*** (0.041) | -0.634*** (0.046) | -0.637*** (0.046) | -0.665*** (0.041) | -0.560*** (0.039) | -0.655*** (0.046) |
| Industry FE | Yes | Yes | Yes | Yes | Yes | Yes | Yes |
| Year FE | Yes | Yes | Yes | Yes | Yes | Yes | Yes |
| Adjusted—R2 | 0.551 | 0.517 | 0.517 | 0.517 | 0.517 | 0.566 | 0.530 |
| N | 26519 | 26519 | 26519 | 26519 | 26519 | 22898 | 22898 |
Main effects of E score on all dependent variables.
| (1) | (2) | (3) | (4) | (5) | (6) | |
|---|---|---|---|---|---|---|
| USA | Canada | |||||
| Betat+1 | Qt+1 | ROAt+1 | Betat+1 | Qt+1 | ROAt+1 | |
| Environmental Score | −0.042 | 0.167⋆⋆ | 0.018⋆⋆⋆ | 0.205⋆ | −0.225⋆⋆ | −0.006 |
| (0.037) | (0.078) | (0.004) | (0.117) | (0.112) | (0.012) | |
| Env. Volatility | −0.502 | −1.103⋆ | 0.208⋆⋆⋆ | −1.130 | 1.534 | 0.101 |
| (0.421) | (0.581) | (0.038) | (0.768) | (0.934) | (0.071) | |
| Firm Size | 0.009 | −0.125⋆⋆⋆ | 0.005⋆⋆⋆ | −0.056⋆ | −0.146⋆⋆⋆ | 0.004 |
| (0.008) | (0.019) | (0.001) | (0.030) | (0.026) | (0.003) | |
| Operating Leverage | 0.038⋆⋆⋆ | −0.084⋆⋆⋆ | −0.042⋆⋆⋆ | 0.200⋆⋆ | −0.027 | −0.025⋆⋆⋆ |
| (0.013) | (0.022) | (0.002) | (0.080) | (0.049) | (0.009) | |
| CAPEX | 0.774⋆⋆ | 3.756⋆⋆⋆ | 0.130⋆⋆⋆ | 1.596⋆⋆ | 0.793⋆ | −0.048 |
| (0.328) | (0.644) | (0.040) | (0.673) | (0.412) | (0.053) | |
| Cash Slack | 0.115⋆ | 2.914⋆⋆⋆ | −0.034⋆⋆⋆ | −0.041 | 1.110⋆⋆⋆ | −0.008 |
| (0.069) | (0.180) | (0.013) | (0.277) | (0.428) | (0.031) | |
| Earnings Variability | 1.347⋆⋆⋆ | −1.370⋆⋆⋆ | −0.132⋆⋆⋆ | 1.859 | −0.321 | 0.038 |
| (0.349) | (0.409) | (0.040) | (1.810) | (1.084) | (0.126) | |
| BM Ratio | 0.155⋆⋆⋆ | −1.264⋆⋆⋆ | −0.058⋆⋆⋆ | 0.235⋆⋆⋆ | −0.390⋆⋆⋆ | −0.044⋆⋆⋆ |
| (0.029) | (0.050) | (0.003) | (0.053) | (0.036) | (0.005) | |
| Inst. Ownership | 0.329⋆⋆⋆ | 0.170⋆ | 0.040⋆⋆⋆ | −0.042 | 0.345⋆⋆ | 0.017 |
| (0.050) | (0.102) | (0.007) | (0.156) | (0.142) | (0.012) | |
| Constant | 0.802⋆⋆⋆ | 3.123⋆⋆⋆ | −0.039⋆⋆ | 1.490⋆⋆⋆ | 2.122⋆⋆⋆ | 0.013 |
| (0.141) | (0.233) | (0.016) | (0.358) | (0.357) | (0.038) | |
| Year FE | Yes | Yes | Yes | Yes | Yes | Yes |
| Industry FE | Yes | Yes | Yes | Yes | Yes | Yes |
| Adjusted_R2 | 0.104 | 0.450 | 0.363 | 0.201 | 0.553 | 0.282 |
| N | 22103 | 19615 | 22332 | 3472 | 3520 | 3549 |
However, Canadian firms do not experience these profit-maximization effects when they achieve high E scores, as shown in columns (4) to (6) of Table 4. In fact, we find a negative correlation between E score and Tobin’s Q. One standard deviation increase in E score reduces Tobin’s Q by 5.48% ( with a mean of 1.19) for Canadian firms. Therefore, we confirm that Canadian firms do not benefit from outstanding environmental performance.
4.3 Matching U.S. Firms with Canadian Firms
Although we include industry fixed-effects and standard firm-level controls in all of our analyses, one argument that can be made to explain the observed differences in the impact of the E score between U.S. and Canadian firms is that the U.S. sample is simply different from the Canadian sample. Therefore, we rerun our main results on a subset of similar U.S. and Canadian firms. In particular, we conduct propensity score-matching (PSM) in which we match each Canadian firm with one U.S. firm based on industry, size and age.
Table 5 presents the results for Canadian firms and U.S. firms that are similar to each other based on observable characteristics. Even with a sample of U.S. firms that are similar to Canadian firms, we still find that U.S. firms benefit from environmental performance. While U.S. firms with higher E scores have higher Tobin’s Q and profitability, Canadian firms not only do not benefit from higher E scores, but they also experience a reduction in Tobin’s Q. These results are consistent with our baseline results presented in Table 4.
PSM between U.S. and Canadian firms, main results.
| (1) | (2) | (3) | (4) | (5) | (6) | |
|---|---|---|---|---|---|---|
| USA | Canada | |||||
| Betat+i | Qt+i | ROAt+i | Betat+i | Qt+i | ROAt+i | |
| Environmental Score | -0.046(0.111) | 0.323* (0.179) | 0.021* (0.013) | 0.084 (0.112) | -0.244** (0.116) | -0.007 (0.012) |
| Env. Volatility | -3.313** (1.451) | -0.986 (1.222) | 0.443*** (0.108) | -1.421* (0.763) | 1.362 (0.937) | 0.087 (0.073) |
| Firm Size | 0.034 (0.029) | -0.127*** (0.042) | 0.007** (0.003) | -0.058** (0.028) | -0.154*** (0.028) | 0.003 (0.004) |
| Operating Leverage | 0.033 (0.037) | -0.117*** (0.034) | -0.015** (0.008) | 0.196** (0.084) | -0.019 (0.053) | -0.026*** (0.010) |
| CAPEX | 1.093 (0.890) | 1.459** (0.738) | 0.109 (0.082) | 1.905*** (0.694) | 1.112** (0.449) | -0.048 (0.057) |
| Cash Slack | -0.023 (0.237) | 2.460*** (0.561) | -0.085* (0.049) | 0.058 (0.270) | 1.001** (0.443) | -0.012 (0.033) |
| Earnings Variability | 0.470 (0.790) | -0.433 (0.817) | -0.054 (0.104) | 1.319 (1.765) | -0.154 (1.083) | 0.066 (0.124) |
| BM Ratio | 0.135* (0.082) | -0.711*** (0.064) | -0.073*** (0.009) | 0.208*** (0.055) | -0.391*** (0.038) | -0.045*** (0.005) |
| Inst. Ownership | 0.147 (0.163) | 0.452*** (0.165) | 0.033* (0.017) | -0.019 (0.157) | 0.356** (0.147) | 0.024* (0.013) |
| PS Score | -0.128 (0.467) | -0.146 (0.277) | 0.003 (0.052) | -0.263 (0.381) | -0.737** (0.345) | -0.044 (0.032) |
| Constant | 1.587*** (0.507) | 2.623*** (0.520) | -0.133** (0.052) | 1.672*** (0.375) | 2.372*** (0.399) | 0.030 (0.045) |
| Year FE | Yes | Yes | Yes | Yes | Yes | Yes |
| Industry FE | Yes | Yes | Yes | Yes | Yes | Yes |
| Adjusted_R2 | 0.147 | 0.592 | 0.299 | 0.210 | 0.560 | 0.287 |
| N | 2635 | 2430 | 2671 | 3260 | 3303 | 3331 |
4.4 Constituency Statutes and Impact of Environmental Score on Firm Outcomes
One may argue that the institutional environment between the U.S. and Canada is significantly different, which may lead to a divergent environmental– financial performance relationship between the two countries. In order to test whether stakeholder orientation significantly changes the relationship between environmental and financial performance in the U.S. market, we use the passage of constituency statutes in 35 U.S. states as a natural experiment. The main intent of the statutes is to permit the consideration of stakeholder interests in corporate decision-making. We create a constituency dummy that equals one if a U.S. firm is incorporated in a state that passed a constituency statute, and zero otherwise (Ni, 2020; Luoma and Goodstein, 1999).12 The timeline of the passage of constituency statutes across different U.S. states is listed in Appendix B.
We present the results of the impact of constituency statutes on the environmental and financial performance relationship in Table 6. In columns (1) to (6) of Table 6, we have separate results for firms in states that already passed constituency statutes and for firms in states without constituency statutes. We find that the positive impact of the E score on U.S. firms’ profit maximization (Tobin’s Q and ROA), is stronger and statistically significant for firms in states without constituency statutes (columns (4) to (6)) compared to firms in states with constituency statutes (columns (1) to (3)).
We find similar results when we rerun the test for the whole U.S. sample, this time including the constituency statutes dummy (columns (7) to (9) of Table 6). The coefficient of the interaction term between the E score and the constituency dummy is negative and statistically significant, which implies that U.S. firms in states with constituency statutes experience less financial benefit from high environmental performance. Figure 1 further illustrates the effect of the constituency dummy for U.S. firms at +/− one standard deviation. The figure shows that firms in states with no constituency statutes see an increase in Tobin’s Q and ROA when they have higher environmental performance. In contrast, in states where constituency statutes were passed, there is no difference in terms of Tobin’s Q and ROA between firms with high and low environmental performance.
Separate U.S. firms by constituency statutes.
| (1) | (2) | (3) | (4) | (5) | (6) | (7) | (8) | (9) | |
|---|---|---|---|---|---|---|---|---|---|
| States with Constituency Statutes | States without Constituency Statutes | Combined with Const. Dummy | |||||||
| Betat+1 | Qt+1 | ROAt^1 | Betat+1 | Qt+1 | ROAt^1 | Betat+1 | Qt+i | ROAt^1 | |
| Environmental Score | -0.075 (0.057) | 0.035 (0.106) | 0.014* (0.006) | -0.025 (0.047) | 0.257* (0.106) | 0.018** (0.006) | -0.046 (0.042) | 0.229** (0.093) | 0.026*** (0.005) |
| Constituency Dummy | -0.032 (0.030) | 0.005 (0.068) | 0.021*** (0.004) | ||||||
| Env. Score X Const. Dummy | 0.019 (0.050) | -0.193* (0.111) | -0.028*** (0.007) | ||||||
| Env. Volatility | -0.854 (0.649) | -1.724* (0.823) | 0.111* (0.053) | -0.311 (0.550) | -0.641 (0.764) | 0.221*** (0.049) | -0.502 (0.421) | -1.073* (0.581) | 0.211*** (0.038) |
| Firm Size | 0.022 (0.015) | -0.162*** (0.031) | 0.001 (0.002) | 0.004 (0.010) | -0.119*** (0.024) | 0.007*** (0.001) | 0.008 (0.008) | -0.126*** (0.019) | 0.005*** (0.001) |
| Operating Leverage | 0.052 (0.032) | -0.143*** (0.038) | -0.037*** (0.006) | 0.031* (0.014) | -0.075** (0.024) | -0.040*** (0.003) | 0.038*** ? (0.013) | -0.084*** (0.021) | -0.041*** (0.002) |
| CAPEX | 1.106+ (0.614) | 2.559 (1.796) | 0.224** (0.074) | 0.719+ (0.394) | 4.082*** (0.667) | 0.082+ (0.046) | 0.775** (0.329) | 3.749*** (0.642) | 0.129*** (0.039)(0.233) -0.050*** |
| Cash Slack | -0.012 (0.147) | 2.008*** (0.424) | -0.036 (0.027) | 0.123 (0.079) | 3.095*** (0.207) | -0.032* (0.015) | 0.107 (0.070) | 2.895*** (0.181) | -0.031** (0.013) |
| Earnings Variability | 1.030+ (0.561) | -0.896 (0.689) | -0.025 (0.065) | 1.431*** (0.404) | -1.388** (0.480) | -0.159*** (0.044) | 1.335*** (0.349) | -1.408*** (0.410) | -0.128*** (0.040) |
| BM Ratio | 0.147** (0.051) | -1.171*** (0.085) | -0.052*** (0.005) | 0.152*** (0.037) | -1.266*** (0.062) | -0.060*** (0.004) | 0.156*** ? (0.029) | -1.263*** (0.050) | -0.058*** (0.003) |
| Inst. Ownership | 0.371*** (0.091) | 0.089 (0.188) | 0.013 (0.010) | 0.303*** (0.063) | 0.209 (0.128) | 0.058*** (0.009) | 0.324*** (0.051) | 0.166 (0.103) | 0.043*** (0.007) |
| Constant | 0.717*** (0.216) | 3.821*** (0.381) | 0.037 (0.023) | 0.839*** (0.186) | 2.833*** (0.298) | -0.078*** (0.021) | 0.821*** (0.142) | 3.129*** (0.233) | -0.050*** (0.017 |
| Year FE | Yes | Yes | Yes | Yes | Yes | Yes | Yes | Yes | Yes |
| Industry FE | Yes | Yes | Yes | Yes | Yes | Yes | Yes | Yes | Yes |
| Adjusted_R2 | 0.138 | 0.484 | 0.326 | 0.100 | 0.449 | 0.383 | 0.104 | 0.451 | 0.365 |
| N | 7365 | 5938 | 7435 | 14735 | 13674 | 14894 | 22103 | 19615 | 22332 |
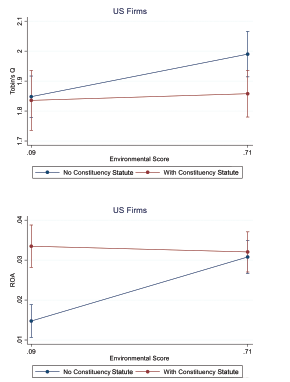
Marginal effects of the interactions between E score and constituency statutes.
Marginal effects of the interactions between E score and constituency statutes.
4.5 Impact of Canadian Firms’ Cross-listing in the U.S. Markets
To further investigate the reason behind the differences between U.S. and Canadian firms, we rerun our baseline analysis for the Canadian firms, this time including the cross-listing dummy variable that equals one if a Canadian firm is cross-listed in any jurisdiction outside of Canada and zero if it remains domestic. If the differences in economic and legal environments between the two countries impact the relationship between environmental and financial performance, we should expect cross-listed Canadian firms to show similar results as U.S. firms, whereas non–cross-listed Canadian firms should show divergent results.
The results of cross-listing are presented in Table 7. Contrary to the prediction, we find that Canadian firms that are cross-listed in the U.S. stock market do not exhibit similar trends as U.S. firms in terms of the financial benefit from environmental performance. The interaction term between the environmental score and the cross-listing dummy is statistically insignificant. The results might imply that the behavior of Canadian firms is based on the corporate governance regime of their country of domicile (Canada) and is not as strongly impacted by the corporate governance regime in the country where they are cross-listed (in the U.S.).
4.6 Subsample Analysis for Canada
In general, the Canadian corporate governance regime has been more stakeholderoriented than shareholder-oriented. In 2008, a Supreme Court ruling in Canada made it clear that the fiduciary duty of the directors should be to the corporation, not to its shareholders. Consequently, after the ruling, the fiduciary duty of directors was expected to no longer be solely focused on the maximization of shareholder value.
We rerun our baseline analysis, splitting the Canadian sample into two periods, before and after 2009. We also run the same subsample analysis for U.S. firms, for comparison. The results are presented in Tables 8 and Tables 9. For the U.S. sample, we find that the value-enhancing effects are stronger in the 2002–2008 period in terms of both economic size and significance. The profit-maximization effect of E scores is stronger in economic size, but less significant during the 2002–2008 period compared to the 2009–2020 period. These results further support the current literature in terms of the effect of institutionalization of ESG on financial performance (e.g., Flammer, 2013). For Canadian firms, columns (1) to (3) of Table 9 show that there is no significant impact of environmental performance on financial outcomes before the ruling. However, in columns (4) to (6) of Table 9, the financial impact of environmental performance becomes negative for Canadian firms after the Supreme Court ruling. The coefficient of the E score is negative and statistically significant for the regressions on firms’ Tobin’s Q. Thus, stakeholder-friendly corporate governance decreases financial benefits from firms’ environmental performance for both U.S. and Canadian firms.
Cross-listing of Canadian firms.
| (1) | (2) | (3) | (4) | (5) | (6) | |
|---|---|---|---|---|---|---|
| Betat+1 | Betat+1 | Qt+1 | Qt+1 | ROAt+1( | ROAt+1 | |
| Environmental Score | 0.181(0.119) | 0.273** (0.124) | -0.218** (0.110) | -0.214* (0.114) | -0.004 (0.012) | 0.001 (0.011) |
| Cross-listing | 0.155** (0.077) | 0.314** (0.149) | -0.044 (0.080) | -0.036 (0.162) | -0.013 (0.008) | -0.004 (0.014) |
| Env Score X Cross-listing | -0.297 (0.197) | -0.015 (0.206) | -0.017 (0.021) | |||
| Env. Volatility | -1.047 (0.774) | -0.932 (0.786) | 1.510 (0.924) | 1.515* (0.892) | 0.094 (0.072) | 0.101 (0.069) |
| Firm Size | -0.070** (0.030) | -0.069** (0.030) | -0.142*** (0.028) | -0.142*** (0.028) | 0.005 (0.004) | 0.005 (0.004) |
| Operating Leverage | 0.188** (0.081) | 0.187** (0.081) | -0.024 (0.049) | -0.024 (0.049) | -0.024*** (0.009) | -0.024*** (0.009) |
| CAPEX | 1.589** (0.676) | 1.553** (0.683) | 0.793* (0.416) | 0.792* (0.417) | -0.047 (0.053) | -0.049 (0.053) |
| Cash Slack | -0.027 (0.276) | -0.015 (0.278) | 1.106*** (0.424) | 1.106*** (0.423) | -0.010 (0.030) | -0.009 (0.030 |
| Earnings Variability | 2.082 (1.790) | 2.128 (1.802) | -0.384 (1.060) | -0.382 (1.052) | 0.019 (0.124) | 0.022 (0.123) |
| BM Ratio | 0.240*** (0.053) | 0.239*** (0.053) | -0.391*** (0.036) | -0.391*** (0.036) | -0.045*** (0.005) | -0.045*** (0.005) |
| Inst. Ownership | -0.092 (0.160) | -0.080 (0.160) | 0.359** (0.140) | 0.359** (0.142) | 0.021 (0.013) | 0.022* (0.013) |
| Constant | 1.568*** (0.360) | 1.497*** (0.369) | 2.101*** (0.366) | 2.098*** (0.353) | 0.007 (0.039) | 0.003 (0.039) |
| Year FE | Yes | Yes | Yes | Yes | Yes | Yes |
| Industry FE | Yes | Yes | Yes | Yes | Yes | Yes |
| Adjusted_R2 | 0.202 | 0.202 | 0.553 | 0.553 | 0.284 | 0.284 |
| N | 3472 | 3472 | 3520 | 3520 | 3549 | 3549 |
5 Endogeneity Control and Identification Strategy
The major concern with our study, as well as with the majority of studies on the impact of environmental performance, is endogeneity, and in particular, reverse causality. It might be the case that firms with higher profitability have more available resources to invest in environmental performance, resulting in higher E scores. This argument would be consistent with the slack hypothesis by Waddock and Graves (1997). It might also be the case that firms with higher valuations are those in industries that traditionally dedicate more resources to their environmental strategies.
Separating data by 2009, U.S. firms only.
| (1) | (2) | (3) | (4) | (5) | (6) | |
|---|---|---|---|---|---|---|
| 2002–2008 | 2009–2020 | |||||
| Betat+1 | Qt+1 | ROAt+1 | Betat+1 | Qt+1 | ROAt+1 | |
| Environmental Score | 0.164⋆⋆(0.078) | 0.268⋆⋆(0.105) | 0.017⋆⋆(0.008) | −0.051(0.039) | 0.144(0.090) | 0.014⋆⋆⋆(0.005) |
| Env. Volatility | 2.651⋆⋆⋆(0.805) | −0.220(0.752) | 0.103(0.071) | −1.344⋆⋆(0.624) | −3.186⋆⋆⋆(0.918) | 0.217⋆⋆⋆(0.055) |
| Firm Size | −0.074⋆⋆⋆(0.024) | −0.205⋆⋆⋆(0.034) | −0.001(0.003) | 0.017⋆⋆(0.008) | −0.118⋆⋆⋆(0.021) | 0.005⋆⋆⋆(0.001) |
| Operating Leverage | 0.146⋆⋆⋆(0.050) | −0.174⋆⋆⋆(0.058) | −0.048⋆⋆⋆(0.015) | 0.028⋆⋆(0.013) | −0.075⋆⋆⋆(0.022) | −0.040⋆⋆⋆(0.002) |
| CAPEX | 0.200(0.749) | 1.873⋆⋆(0.901) | 0.061(0.084) | 0.887⋆⋆(0.356) | 4.091⋆⋆⋆(0.729) | 0.112⋆⋆⋆(0.043) |
| Cash Slack | 0.294(0.196) | 3.002⋆⋆⋆(0.384) | 0.018(0.032) | 0.047(0.071) | 2.907⋆⋆⋆(0.193) | −0.038⋆⋆⋆(0.013) |
| Earnings Variability | 4.644⋆⋆⋆(0.971) | −0.771(0.830) | 0.037(0.126) | 0.755⋆⋆(0.356) | −1.378⋆⋆⋆(0.437) | −0.144⋆⋆⋆(0.040) |
| BM Ratio | 0.494⋆⋆⋆(0.073) | −0.865⋆⋆⋆(0.075) | −0.086⋆⋆⋆(0.008) | 0.105⋆⋆⋆(0.031) | −1.293⋆⋆⋆(0.053) | −0.054⋆⋆⋆(0.003) |
| Inst. Ownership | 0.175(0.148) | −0.429⋆(0.230) | 0.004(0.018) | 0.333⋆⋆⋆(0.052) | 0.185⋆(0.110) | 0.041⋆⋆⋆(0.007) |
| Constant | 0.549(0.374) | 3.803⋆⋆⋆(0.447) | 0.090⋆⋆(0.042) | 1.018⋆⋆⋆(0.190) | 3.703⋆⋆⋆(0.314) | −0.052⋆⋆⋆(0.020) |
| Year FE | Yes | Yes | Yes | Yes | Yes | Yes |
| Industry FE | Yes | Yes | Yes | Yes | Yes | Yes |
| Adjusted_R2 | 0.239 | 0.563 | 0.302 | 0.095 | 0.444 | 0.380 |
| N | 3591 | 3245 | 3619 | 18493 | 16351 | 18694 |
To address these concerns, we include a number of firm-level characteristics, such as capital expenditure (CAPEX) and cash slack to mitigate possible omitted variable biases. We also include industry fixed-effects to control for industry unobserved characteristics. Moreover, we conduct the instrumental variable (IV) method and dynamic panel regressions to directly address the endogeneity concern.
5.1 Instrumental Variable
Our instrument is based on the current literature, which shows that voters who vote for the Democrats are more concerned about the environmental performance of firms. For example, Di Giuli and Kostovetsky (2014) show that firms that have headquarters in more Democratic-leaning states are more likely to dedicate resources to environmental performance. Similar to Albuquerque et al. (2019), we use the state’s political leaning as the instrument for environmental performance. Specifically, for the U.S. sample, we use a dummy variable, Democratic dominance, that equals one if there were more votes for the Democratic candidate than for the Republican candidate for president in a particular state, and zero otherwise.13
Separating data by 2009, Canadian firms only.
| (1) | (2) | (3) | (4) | (5) | (6) | |
|---|---|---|---|---|---|---|
| 2002-2008 | 2009-2020 | |||||
| Betat+1 | Qt+1 | ROAt+1 | Betat+1 | Qt+1 | ROAt+1 | |
| Environmental Score | 0.156 (0.171) | 0.150 (0.156) | -0.004 (0.015) | 0.157 (0.139) | -0.313** (0.136) | -0.012 (0.014) |
| Env. Volatility | -2.289* (1.224) | -1.168 (0.714) | 0.149 (0.129) | -3.158** (1.357) | 1.870* (0.975) | 0.131 (0.093) |
| Firm Size | 0.018 (0.047) | -0.226*** (0.056) | -0.000 (0.005) | -0.059* (0.034) | -0.137*** (0.027) | 0.004 (0.004) |
| Operating Leverage | -0.294 (0.200) | 0.107 (0.119) | -0.024** (0.011) | 0.222** (0.088) | -0.028 (0.047) | -0.022** (0.009) |
| CAPEX | 1.751* (1.044) | 0.764 (0.976) | -0.072 (0.087) | 1.741** (0.782) | 0.526 (0.466) | -0.081 (0.059) |
| Cash Slack | 0.364 (0.635) | 1.327* (0.741) | 0.015 (0.068) | -0.019 (0.298) | 1.056** (0.464) | -0.011 (0.036) |
| Earnings Variability | 0.195 (3.144) | 2.865 (3.489) | 0.285 (0.287) | 2.128 (1.945) | -0.560 (1.102) | 0.057 (0.141) |
| BM Ratio | 0.414*** (0.122) | -0.314*** (0.066) | -0.021** (0.009) | 0.227*** (0.058) | -0.381*** (0.038) | -0.046*** (0.005) |
| Inst. Ownership | 0.266 (0.233) | 0.100 (0.250) | 0.006 (0.021) | -0.090 (0.179) | 0.355** (0.149) | 0.021 (0.014) |
| Constant | 1.105* (0.571) | 3.323*** (0.537) | 0.040 (0.059) | 2.117*** (0.505) | 2.006*** (0.366) | -0.002 (0.045) |
| Year FE | Yes | Yes | Yes | Yes | Yes | Yes |
| Industry FE | Yes | Yes | Yes | Yes | Yes | Yes |
| Adjusted_R2 | 0.346 | 0.667 | 0.299 | 0.189 | 0.549 | 0.277 |
| N | 550 | 558 | 559 | 2907 | 2947 | 2975 |
Table 10 presents the results of the IV analysis. In the first-stage regression, reported in column (1) of Table 10, we regress the firm’s E score on the instrument, Democratic dominance, is positive and statistically significant, which implies that firms headquartered in more Democratic-leaning states have higher environmental scores.
Main effects, IV regression, U.S. firms only.
| (1) | (2) | (3) | (4) | |
|---|---|---|---|---|
| First Stage | Betat+1 | Qt+1 | ROA+1 | |
| Democratic Dominance | 0.020**(0.008) | |||
| Environmental Score | 1.784*(0.987) | 5.170**(2.059) | -0.188(0.158) | |
| GDP Per Capita | -0.000(0.000) | -0.001(0.001) | 0.005***(0.002) | -0.000(0.000) |
| Env. Volatility | 0.128(0.130) | -0.751*(0.441) | -1.733***(0.644) | 0.318***(0.055) |
| Firm Size | 0.124***(0.003) | -0.217*(0.123) | -0.748***(0.258) | 0.029(0.020) |
| Operating Leverage | 0.002(0.002) | 0.035***(0.013) | -0.092***(0.022) | -0.057***(0.004) |
| CAPEX | 0.155*(0.091) | 0.491(0.365) | 3.001***(0.686) | 0.157**(0.071) |
| Cash Slack | 0.057**(0.024) | 0.014(0.092) | 2.580***(0.217) | -0.040*(0.021) |
| Earnings Variability | -0.267***(0.088) | 1.828***(0.434) | -0.063(0.675) | -0.121*(0.063) |
| BM Ratio | -0.054***(0.007) | 0.255***(0.062) | -0.991***(0.120) | -0.077***(0.010) |
| Inst. Ownership | -0.018(0.016) | 0.360***(0.053) | 0.262**(0.110) | 0.062***(0.010) |
| Constant | -0.630***(0.051) | 2.038***(0.650) | 6.089***(1.339) | -0.138(0.105) |
| Year FE | Yes | Yes | Yes | Yes |
| Industry FE | Yes | Yes | Yes | Yes |
| Adjusted_R2 | 0.530 | 0.104 | 0.451 | 0.376 |
| N | 22898 | 22103 | 19615 | 22326 |
In the second-stage regression (columns (2) to (4)), we use the predicted value of the E score from the first stage as the independent regressor. We find the coefficient of the instrumented environmental score to be positive and statistically significant for the beta and Tobin’s Q regressions. The IV results for Tobin’s Q test are consistent with our baseline results.
5.2 Dynamic Panel Regressions
It is also possible that a firm’s environmental and financial performance are path-dependent, leading to a possible overestimation of the relationship. We use Arellano-Bond dynamic panel data (DPD) regressions (Arellano and Bond, 1991; Arellano and Bover, 1995) to treat possible unobservable confounding effects that are consistent across time. Specifically, for a correct model specification, we apply the Blundell and Bond (1998) generalized method of moment (GMM) estimator. The Arellano-Bond DPD regression uses multiple lags of the dependent variable and the independent variable as the instrument to purge out unobservable factors that systematically influence the independent variable over time.
Table 11 shows the dynamic panel regression results for U.S. and Canadian firms separately. The table shows that the lagged dependent variables are significant in most models (except for Model 4), justifying the use of the DPD model. Moreover, even after considering the dynamic nature of the data, the E score still has a positive impact on Tobin’s Q for U.S. firms, indicating a value-enhancing effect, but not for Canadian firms. These results are consistent with the findings from the previous methods. Therefore, we believe that the endogeneity issue does not nullify our results.
5.3 Other Robustness Checks
We run a series of analyses to further check the robustness of our results. First, as noted by Berg et al. (2021), the Refinitiv ESG database has been making significant methodological changes in terms of how the environmental, social and governance scores are aggregated. In order to check the reliability of our results considering the methodological change, we create our own E and ES scores based on the seven categorical scores reported by Refinitiv.14 Specifically, we calculate the new E score as the average of the resource use, emission, and environmental innovation scores in the environmental dimension, and the social score as the average of work force, human rights, community and product scores from the social dimension. The ES score is calculated as the average score in all seven categories in the environmental and social dimensions. The results are similar to what we reported using the aggregated scores calculated by Refinitiv.15
Secondly, a viable concern might be that the two countries have different exposure to natural disasters, thus leading to their disparate interest in addressing environmental issues. This may lead to a divergent relationship between environmental and financial performance. For example, Fiordelisi et al. (2024) show that investors react to natural disasters by investing in sustainable financial products. This should lead to a higher environmental performance.
Dynamic panel regressions, U.S. and Canadian firms.
| (1) | (2) | (3) | (4) | (5) | (6) | |
|---|---|---|---|---|---|---|
| U.S. Firms | Canadian Firms | |||||
| Betat+1 | Qt+1 | ROAt+1 | Betat+1 | Qt+1 | ROAt+1 | |
| Lag of DV | 0.041*** (0.012) | 0.577*** (0.043) | 0.219*** (0.027) | 0.036 (0.038) | 0.636*** (0.051) | 0.135*** (0.050) |
| Environmental Score | -0.126 (0.098) | 0.229* (0.104) | -0.001 (0.010) | -0.207 (0.213) | 0.094 (0.084) | -0.004 (0.021) |
| Env. Volatility | -3.352+ (1.711) | -3.097 (2.335) | -0.156 (0.186) | -7.563*** (2.692) | 2.361** (1.114) | -0.069 (0.232) |
| Firm Size | -0.009 (0.033) | -0.011 (0.037) | 0.005 (0.004) | -0.023 (0.064) | -0.087*** (0.029) | -0.010 (0.009) |
| Operating Leverage | 0.116 (0.104) | 0.050 (0.135) | -0.022** (0.008) | 0.401** (0.191) | 0.003 (0.067) | -0.015 (0.013) |
| CAPEX | 2.659 (1.920) | -0.800 (1.940) | -0.005 (0.157) | 3.554** (1.711) | -0.473 (0.689) | -0.067 (0.199) |
| Cash Slack | 1.661*** (0.500) | 1.295** (0.491) | -0.073 (0.048) | -0.951 (1.070) | -0.225 (0.503) | -0.276*** (0.100) |
| Earnings Variability | 3.473 (2.557) | -0.512 (2.337) | 0.214 (0.171) | 13.049* (7.490) | 3.836 (2.925) | 0.398 (0.538) |
| BM Ratio | 0.879*** (0.134) | -1.318*** (0.213) | -0.115*** (0.019) | 0.327*** (0.125) | -0.155** (0.067) | -0.066*** (0.014) |
| Inst. Ownership | 2.218*** (0.325) | -0.747+ (0.383) | 0.067+ (0.039) | 0.843 (0.609) | 0.404* (0.244) | -0.045 (0.050) |
| Constant | -0.269 (0.683) | 2.817** (0.868) | 0.036 (0.060) | 2.795*** (0.929) | 0.464 (0.456) | 0.223** (0.106) |
| Year FE | Yes | Yes | Yes | Yes | Yes | Yes |
| Wald Chi2 | 8803.38*** | 27608.75*** | 1650.32*** | 1615.86 | 8769.42*** | 484.41*** |
| AR1 | -23.39*** | -13.91*** | -13.72*** | -10.13*** | -5.57*** | -8.03*** |
| AR2 | -0.92 | -0.45 | -2.30* | 1.35 | -0.41 | -1.08 |
| N | 18734 | 16656 | 18915 | 3026 | 3076 | 3097 |
Following Fiordelisi et al. (2024), we use the “Emergency Events Database” (EM-DAT), which contains disaster data worldwide from 1900, to obtain the natural disaster events for U.S. and Canada from 2002 to 2020. To limit the events to natural disasters, we only include incidents of drought, extreme temperature, flood, landslide, mass movement, storm, and wildfire. We create a disaster dummy that equals one if in that year there was a natural disaster in a particular state or province, and zero otherwise. First, we confirm that the incidences of a natural disaster are indeed on average much higher in the
U.S. than in Canada. In our sample, almost 93% of the U.S. observations are from firms in a state that suffered at least one disaster in the given year, compared with 48% for Canadian firms. We next rerun our main analysis including the disaster dummy as a control variable. We find that the results remain qualitatively unchanged compared to our main results in Table 4. Additionally, we use the disaster dummy as the moderator variable to see if the presence of disasters significantly moderates the environmental-financial performance relation. As expected, the disaster dummy does not have a significant moderating effect on the relationship. Thus, the impact of exposure to natural disasters does not seem to drive our results.16
Thirdly, Cumming et al. (2021) argue that the passing of constituency statutes may lead to an increase in effective tax rate for firms. This may influence a firm’s financial bottom line and appetite for environmental performance. In order to test this possible mechanism, we add the tax aggressiveness as a dependent variable in the main regressions. We follow Cumming et al. (2021) and Lennox et al. (2013) and measure tax aggressiveness as the total tax expense divided by pretax income. The results remain the same as what we report in Table 4.
Fourthly, we winsorize all continuous variables at the (1, 99) level in our main analyses. One may argue that this may cause bias to the analysis, especially when the winsorized values are true values rather than errors in data entry. We also run the main regression in Table 4 with unwinsorized data to ensure that winsorization does not cause bias to our results. The results with the winsorized data are almost identical to the results reported in Table 4, confirming that the results are robust to outlier influences.
Lastly, our results should not suffer from survivorship bias because firms exit our sample if they become inactive (bankrupt or being acquired). However, we test the main results in Table 4 using a sample of firms that are still active by the end of fiscal year 2020. The results are, again, almost identical to what we report in Table 4. Therefore, we don’t believe that our results have potential survivorship biases.17
6 Discussion and Conclusions
In this paper, we investigate the role of corporate governance policies in determining the financial efficacy of environmental performance. We find that since the corporate governance regime in Canada is more stakeholder-friendly than that of the U.S., Canadian companies do not receive any financial benefits for good environmental performance. Canadian firms are more likely to engage in environmental activities because it is good for the companies’ stakeholders and society at large. In contrast, since U.S. firms are in general situated in a more shareholder-oriented corporate governance regime, we would expect them to engage in environmental policies only to the extent that these policies are beneficial to shareholders. Indeed, this is what we find. In terms of governance policies, U.S. firms experience a more significant positive impact on environmental performance. Supporting this argument, we find that U.S. firms incorporated in states that have adopted constituency statutes, which allow firms to take into account stakeholder interests when making decisions, receive lower financial benefits from their environmental performance. In a sense, U.S. firms in constituency statutes states have become partially Canadized.
In this paper, we show that Canadian firms have better environmental performance than U.S. ones. Since the two countries share the same legal origins – common law – this cannot be the explanation. The reasons for the divergent environmental performance likely originate from other institutional factors. We have made the argument that the key institutional factor is corporate governance. This is the same argument that is made by Kock and Min (2016). The authors show that European civil-law countries, with their more stakeholder-oriented corporate governance system, have lower carbon emissions.
Moreover, as Strand et al. (2015) write, Scandinavian countries, including Finland, are world leaders in corporate sustainability. The authors argue that Scandinavian countries have deep-seated traditions of stakeholder engagement and that the concept of “creating shared value” has Scandinavian origins. Consistent with this, Liang and Renneboog (2017) show that firms from Scandinavian countries have the highest environmental and social performance. Additionally, we, as financial scholars, should perhaps re-evaluate our distaste for state-owned enterprises. As Hsu et al. (2023b) show, state-owned enterprises are more responsive to environmental issues. Firms that do not have strong incentives to maximize shareholder value thus seem to be more environmentally friendly.
We cannot all become Scandinavians, but we can change our corporate governance regimes. If we value environmental performance, more stakeholder-friendly corporate governance systems facilitate that. The alternative to corporate governance reform is to change laws and regulations in such a way that it is in the best financial interest of firms to invest in environmental performance.
Online Appendix available from: http://dx.doi.org/10.1561/114.00000061_app
Appendices
Variable descriptions
| Variable | Description |
|---|---|
| Beta | Annualized beta from the CAPM model |
| ROA | Return on Assets = net income / total asset |
| Tobin’s Q | Tobin’s Q = (Market value of equity + liquidation value of preferred shares + book value of debt) / total assets |
| ES Score | The average of environmental and social scores in percentage (X%) |
| E Score | The environmental score from the Thomson Reuters Refinitiv in percentage (X%). |
| Shareholder Relations | A pillar score calculated by Refinitiv that measures a firm’s equal treatment to all stakeholders and anti-takeover devices. |
| Cross Listing Dummy | Dummy = 1 if a Canadian firm is cross-listed in any jurisdiction outside of Canada, and 0 otherwise. |
| Constituency Dummy | Dummy =1 if a firm is incorporated in a state that passed a constituency statute. |
| Canada Dummy | Dummy=1 if the firm is a Canadian-based company, 0 if it is a U.S.-based company. |
| E Score Variability | The standard deviation of the environmental scores of all the firms in a SIC one-digit industry in a given year. |
| Firm Size | Size = ln(total asset) |
| Operating Leverage | Operating Leverage = expected sensitivity of operating costs to total sales based on the past two-year window. Measured as 2 |
| CAPEX | CAPX = capital expenditure / total asset |
| Slack | Cash to Asset = cash and short-term investments / total assets |
| Earnings Variability | The standard deviation of (Income before extraordinary items / shares outstanding) on a five-year rolling window, in 1,000. |
| BM Ratio | Book to Market Ratio = book value of equity / market value of equity |
| Institutional Ownership | Percentage of institutional ownership in total common shares. |
Timeline of constituency statutes adoption in the U.S.
| State Name | Year | State Name | Year |
|---|---|---|---|
| Arizona | 1987 | Nevada | 1991 |
| Connecticut | 1988 | New Jersey | 1989 |
| Florida | 1989 | New Mexico | 1987 |
| Georgia | 1989 | New York | 1987 |
| Hawaii | 1989 | North Carolina | 1993 |
| Idaho | 1988 | North Dakota | 1993 |
| Illinois | 1985 | Ohio | 1984 |
| Indiana | 1986 | Oregon | 1989 |
| Iowa | 1989 | Pennsylvania | 1990 |
| Kentucky | 1988 | Rhode Island | 1990 |
| Louisiana | 1988 | South Dakota | 1990 |
| Maine | 1985 | Tennessee | 1988 |
| Maryland | 1999 | Texas | 2006 |
| Massachusetts | 1989 | Vermont | 1998 |
| Minnesota | 1987 | Virginia | 1988 |
| Mississippi | 1990 | Wisconsin | 1987 |
| Missouri | 1986 | Wyoming | 1990 |
| Nebraska | 1988 |
References
UN Security Council Press Release, February 23, 2021, available at https://press.un.org/en/2021/sc14445.doc.htm.
Available at https://www.nejm.org/doi/full/10.1056/NEJMe2113200.
Except for the province of Quebec, whose legal tradition is based on French civil law.
In untabulated regressions, we indeed show that ES performance has a negative impact on beta even in our sample for U.S. firms. The negative relationship is driven by social performance.
Most of the empirical evidence is conducted with U.S. data. Bajic and Yurtoglu (2018) show, with a global sample drawn from 35 countries, that ES performance increases firm value, but not profitability.
We also used the average of Environmental and Social score as a dependent variable to explore whether there are significant differences in ES performance between U.S. and Canadian firms.
All constituency statute states passed the regulation before our sample period (2002— 2020), except for Texas (2006). The dummy variable for Texas firms equals 0 before 2006, and 1 afterwards.
Results are not reported due to space limitations.
All constituency statute states passed the regulation before our sample period (2002— 2020) except for Texas (2006). The dummy variable for Texas firms equals 0 before 2006, and 1 afterwards.
We also conduct the IV analysis for the Canadian sample. We use the left dominance variable, which is a dummy variable equal to 1 if, in that province, there were more votes for the left-wing party than for the right-wing party in the federal elections in Canada. Untabulated results show insignificant first-stage regressions, which implies that there is no significant relationship between left dominance and the Environmental score.
We originally downloaded the Refinitiv environmental and social aggregate scores in June 2022. We downloaded the categorical scores and manually recalculated the E and ES scores in May 2023.
The results are available in the Online Appendix Tables A1—A5.
The results are available in the Online Appendix Tables A6 and A7.
All the results are available in the Online Appendix Tables A8—A10.

