


This paper aims to apply the debt sustainability framework using various ratios to review the current state of sovereign debt of Economic Community of West African States (ECOWAS) member countries.
Debt sustainability framework using various ratios (which include the present value approach, Country Policy and Institutional Assessment debt policy assessment ranking and solvency ratio of external debt) for the period 2010 and 2017 were used for the analysis to determine external debt sustainability and solvency of ECOWAS members.
The findings indicate that most ECOWAS countries are already turning at the unsustainable debt path and may renege in their debt obligations, thus creating a vicious cycle of external borrowing that could lead to capital flight.
This paper offers the empirical evidence to identify which of the ECOWAS countries are already at the threshold of external debt stress, and in the likelihood to renege on their debt obligations.
1. Introduction
Most of the literature that dominated developing countries’ debt quagmire in the late 1990s into the early 2000s demonstrated that debt forgiveness could provide the much-needed stimulus to investment recovery and economic growth. The shared concern partly emanated from the 23 December 1993 resolution of the United Nations General Assembly at its 87th plenary meeting, which outlined a New Agenda for Africa's Development (UN-NADAF). The Assembly, reflecting on the United Nations Conference on Trade and Development (UNCTAD) Report (United Nations Conference on Trade and Development, 2001), was convinced that financial resource flows to Africa were constrained and stifled by rising debt, debt-service obligations and low private investment flows. The Assembly noted that Africa was the only continent that experienced a negative net transfer of resources in the 1990s, committed the international community to address the external debt crisis region (United Nations General Assembly, 1993).
As sub-Saharan Africa's economic and social conditions and other developing economies worsened, particularly in the first half of the 1990s, there was cause for concern globally. Some of the internal causal factors were low or declining output growth rates, high population growth rates and falling per capita output levels. Other related factors were domestic macroeconomic policy failures and policy mistakes [1]. These effects resulted in rising inflation, high unemployment, rising fiscal deficits and capital flight (lyoha, 1999). For instance, available empirical evidence shows that in sub-Saharan Africa (SSA), per capita income (measured by gross national product per person) declined at an average annual rate of 2.2% between 1980 and 1989. The terms of trade between 1985 and 1990 fell by 9.1%; export volume was stagnant while import volume plummeted at an average annual rate of 4.3%. Frequency distribution of SSA inflation rates shows that the percentage of countries with inflation rates of 10% or less rose to about 61% in 1995–1997 from 46% in 1990–1994, 54% in 1985–1989 and 28% in 1981–1984 (Calamitsis et al., 1999; lyoha, 1999).
Over and above, the international economic environment was relatively hostile, as evident in low and falling primary commodity prices, soaring global interest rates, rising protectionism in the industrialized countries, the severity of imports and dwindling international capital flows (Trade and Development Report, 2008). Capital flows in SSA countries declined from an average of US$20bn annually in the early years of the 1980s to about US$12bn after the mid-1980s (Ndiaye, 1990). As capital flows into African countries dwindled, there were mounting current account and balance-of-payments deficits, which resulted in escalating the external debt stock.
To tackle the debt crisis, creditors (Paris Club, London Club, among others) designed and implemented a series of options such as debt swaps, debt restructuring and debt rescheduling to ensure full debt payment. Despite these, the governments of developing countries and particularly those of SSA, still defaulted in their obligations, making financial rescue initiatives by the creditor countries imperative.
Following the launch of the Heavily Indebted Poor Countries (HIPC) Initiative in 1996, the debt relief framework encompassed private and government creditors along with the World Bank and International Monetary Fund (IMF). In 2005, the Multilateral Debt Relief Initiative (MDRI) provided US$76bn in debt-service relief to 36 countries, 30 of them in Africa. The MDRI allowed for 100% relief on eligible debts owed to the IMF, World Bank and the African Development Fund (AfDF) for countries completing the HIPC Initiative process [2] (International Monetary Fund, 2019, p. 1). It is well over two decades since implementing the first HIPC Initiative and MDRI debt reduction packages. Yet, economic growth is still elusive in SSA countries, as most countries in the continent are still heavily indebted and rapidly slipping back into colossal debt burden and debt overhang.
According to UNCTAD estimates, Africa's external debt stock in 2013 contracted through bilateral borrowing, syndicated loans and bonds, stood at US$443bn. In 2017, total public debt stock as a percentage of gross domestic product in SSA was 45.9% compared with 74% external debt-to-GNP ratio in 1995; and since then, sharp currency devaluations across the continent which pushed up service cost of the massive debt stock (Rao and Strohecker, 2017). For instance, Official Development Assistance (ODA) flows to African countries increased from US$7.4bn in 1970 to US$15.5bn in 1975 and from US$20.9bn in 1985 to US$25.1bn in 1990. After 1990, ODA flows to African countries declined by approximately 43% to US$14.4bn in 1999 (Loots, 2005). According to the World Bank database (2020), Net Official Development Assistance to SSA declined to US$13.1bn in 2000 before rising to US$41.2bn in 2006 and US$44.4bn in 2010, thus, recording an unprecedented growth of 239%. Net ODA grew by 13% to US$50.3bn from 2010 to 2018. This upsurge made critics question its definition and measure whether ODA is a real “assistance” or concessional loans with a grant element of 25% using the faulty OECD criteria, including government grants and the full value (Martens, 2001, p. 2).
For West African economies, their structure and trend performance are similar to SSA's leaning. Prevalent among the patterns are the weight of accumulated foreign debt repayment and servicing. Agreed, the resources of West African economies are grossly insufficient; however, a substantial proportion of the available resources is committed to external debt servicing and repayment obligations (Lawanson, 2014, p. 2). For example, in the 1970s, countries of the subregion accumulated substantial external debt. The sub-region's foreign debt grew by an annual average of 27.4% and 18.85% in 1970 and 1975. The average yearly rates of external debt for anglophone West African countries and non-anglophone grew by 30.9% and 45.7%, respectively, from 1981 to 1985. However, the annual average growth rate of accumulated external debt stock to Gross National Income (GNI) slowed to 9.6% from 1981 to 1989 and slightly above 4% in the 1990s. While the region's annual average growth rate of external debt witnessed declines throughout the 2000s due to debt relief initiatives, except in 2002 and 2003, when the slight increment of 1% and 5%, respectively, were observed, these declines continued till 2018 following an annual average 1.7% decline from 2010. As these growth rate declines continued, external debt stock to Gross National Income (GNI) increased from 79% in 1983 to 115% in 1999 and peaked at 163% in 1998. Following the debt relief initiatives, external debt stock to GNI declined to 47% in 2008 and stood at 32% in 2011. Since 2012, the share of external debt stock to GNI has been rising, likewise resources committed to meeting external debt servicing and repayment obligations. In 2015, the percentage share of foreign debt stock to GNI rose to 34% and stood at 38% in 2018, as total debt service on external debt (current US$) increased from US$3.4bn in 1980 to US$6.4bn in 1985, and US$11.9bn in 2018.
Indeed, there are enormous socio-economic costs that accompany servicing and repaying external debts. Resort to external borrowing could result from weak public financial management, which gives rise to a host of adverse movements in macroeconomic fundamentals, such as exchange rate mismanagement. The expectation of currency devaluation leads to speculative capital flight (Karagol and Bilimler, 2004). As the literature further posits, inadequate capital inflows due to debt overhang can cause severe import strangulation. Import strangulation holds back export growth, and this propagates import shortages. Debt overhang and other uncertainties depress investment; dwindling investment combined with shortages of essential imports results in declining real output (Iyoha, 1999, p. 7). Also very worrisome is the severity of debt when perceived in the light of an unusually fragile and narrow production base and low capacity of many African countries to meet their debt service obligations (Ndiaye, 1990). These fallouts that no doubt, create an impetus for further examination, is a matter of empiricism.
The paper examines the current state of external debt sustainability of member countries of the Economic Community of West African States (ECOWAS). It identifies which of the ECOWAS countries are currently undergoing external debt stress and vulnerable to a financial crisis in the future and, by extension, likelihood to renege on their debt commitments.
The remainder of the paper is divided into five sections. Following the introduction, Section 2 reviews the structure of the economic growth of ECOWAS member countries. Section 3 summarizes the theoretical perspectives and insight into how debt sustainability can influence economic growth. Section 4 examines the scope, dynamics and severity of the debt burden in the sub-region. Section 5 analyzes the solvency and sustainability of ECOWAS countries' debt profiles using some indicators. Section 6 concludes the paper with some policy remarks.
2. Economic growth in Economic Community of West African States countries
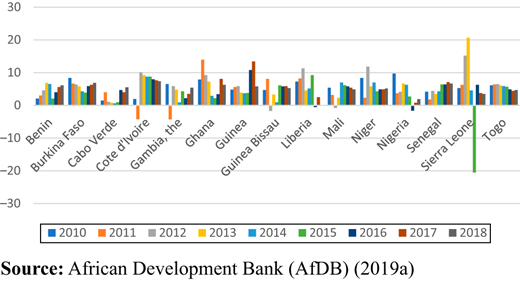
The West African sub-regional economies are structurally heterogeneous, with an economically active population estimated at 130 million people in 2018, out of which Nigeria accounted for approximately 47% (African Development Bank (AfDB), 2019a). Gross Domestic Product (GDP) per capita in 2018 varied from a low of US$453 in Niger to a high of US$3,593 in Cabo Verde. Of the nine francophone countries, seven (except Togo recorded 4.7% growth, and Mali's 4.9%) registered an increase of at least 5% in 2018 (Table 1 and Figure 1). By contrast, only two of the five Anglophone countries within the sub-region, namely, Gambia and Ghana, recorded 5.4% and 6.2% growth rates, respectively. The largest economy in the sub-region, Nigeria, marginally grew at 1.9%, having just recovered from the 2016 economic recession in 2017, as Liberia recorded zero (0) growth rate in 2015 and 2.5% in 2017. This mixed performance recorded by countries of the sub-region was driven mostly by growth in export prices of primary commodities, private and public consumption, remittances, the fallout of the Ebola epidemic, and shrinking fundamentals of Nigeria's oil exports. Overall, West Africa's real GDP growth of 0.5% in 2016 trailed Africa's average growth rate of 2.1% [African Development Bank (AfDB), 2019b].
ECOWAS real GDP growth (%)
| Countries | 2010 | 2011 | 2012 | 2013 | 2014 | 2015 | 2016 | 2017 | 2018 |
|---|---|---|---|---|---|---|---|---|---|
| Benin | 2.1 | 3 | 4.8 | 7.2 | 6.4 | 2.1 | 4.0 | 5.4 | 6.0 |
| Burkina Faso | 8.4 | 6.6 | 6.5 | 5.8 | 4.4 | 3.9 | 5.9 | 6.7 | 7.0 |
| Cabo Verde | 1.5 | 4.0 | 1.1 | 0.8 | 0.6 | 1.1 | 3.6 | 4.0 | 3.9 |
| Cote d'Ivoire | 2.0 | −4.2 | 10.1 | 9.3 | 8.8 | 8.8 | 8.3 | 7.8 | 7.4 |
| Gambia | 6.5 | −4.3 | 5.9 | 4.8 | 0.9 | 4.3 | 2.2 | 3.5 | 5.4 |
| Ghana | 7.9 | 14.0 | 9.3 | 7.3 | 4.0 | 3.9 | 3.7 | 8.5 | 6.2 |
| Guinea | 4.2 | 5.6 | 5.9 | 3.9 | 3.7 | 4.5 | 10.5 | 9.9 | 5.9 |
| Guinea Bissau | 4.6 | 8.1 | −1.7 | 3.3 | 1.0 | 6.1 | 6.3 | 5.9 | 5.3 |
| Liberia | 6.1 | 7.4 | 8.2 | 8.7 | 0.7 | 0.0 | −1.6 | 2.5 | 3.2 |
| Mali | 5.4 | 3.2 | −0.8 | 2.3 | 7.0 | 6.0 | 5.8 | 5.3 | 4.9 |
| Niger | 8.4 | 2.2 | 11.8 | 5.3 | 7.5 | 4.3 | 4.9 | 4.9 | 5.2 |
| Nigeria | 10.6 | 4.9 | 4.3 | 5.4 | 6.3 | 2.7 | −1.6 | 0.8 | 1.9 |
| Senegal | 4.2 | 1.8 | 4.4 | 3.5 | 4.3 | 6.4 | 6.2 | 7.2 | 7.0 |
| Sierra Leone | 5.3 | 6.3 | 15.2 | 20.7 | 4.6 | −20.5 | 6.3 | 5.8 | 3.5 |
| Togo | 6.1 | 6.4 | 6.5 | 6.1 | 5.9 | 5.7 | 5.1 | 4.4 | 4.7 |
| ECOWAS | 9.2 | 5.0 | 5.1 | 5.8 | 6.1 | 3.2 | 0.5 | 2.7 | 3.3 |
| Africa | 5.8 | 2.9 | 7.3 | 3.6 | 3.7 | 3.5 | 2.1 | 3.6 | 3.5 |
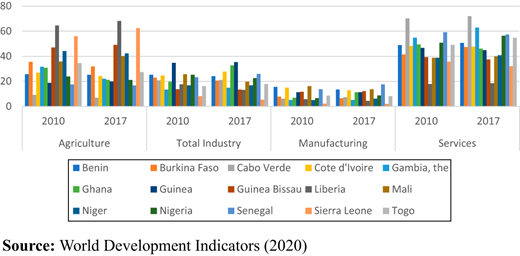
Analysis of the subregion’s structure of GDP and gross value added (at current market prices) as percent share of GDP by different sectors reveals that services remain a dominant sector in value-added between 2010 and 2017, followed by the agricultural sector. Tourism in Cabo Verde and financial services in Ghana and Nigeria are the dominant subsectors. In 2017, Services contributed over 50% of GDP in Cabo Verde, Ivory Coast, The Gambia, Nigeria and Senegal. The share of the Services sub-sector in Ghana declined from 48.18% in 2010 to 42.7% in 2017 (Table 2 and Figure 2). Manufacturing and Industry accounted for an exceedingly small proportion of the region's GDP, which signifies a weak structural transformation of the economies [Omotor, 2016; Omotor and Saka, 2017; Ekpo and Omotor, 2019; African Development Bank (AfDB), 2019b].
Structure of GDP and gross value added (at current market prices) share of GDP (%)
| Country | 2010 | 2017 | ||||||
|---|---|---|---|---|---|---|---|---|
| Agriculture | Industry (Total) | Manufacturing | Services | Agriculture | Industry (Total) | Manufacturing | Services | |
| Benin | 25.84 | 18.01 | 11.74 | 44.55 | 28.49 | 15.11 | 9.62 | 48.40 |
| Burkina Faso | 24.14 | 26.06 | 12.14 | 42.12 | 21.34 | 24.87 | 10.54 | 43.48 |
| Cabo Verde | 7.99 | 18.15 | 5.43 | 61.16 | 6.74 | 18.19 | 6.13 | 61.24 |
| Cote d'Ivoire | 24.53 | 22.41 | 12.63 | 53.06 | 18.74 | 20.46 | 10.11 | 53.36 |
| Ghana | 28.04 | 18.01 | 6.39 | 48.18 | 19.70 | 30.39 | 10.46 | 42.74 |
| Gambia, The | 35.19 | 9.83 | 4.55 | 49.20 | 21.00 | 17.89 | 4.47 | 53.43 |
| Guinea | 17.48 | 32.31 | 10.63 | 43.40 | 18.80 | 29.70 | 10.01 | 41.52 |
| Guinea-Bissau | 45.09 | 13.14 | 11.34 | 39.37 | 49.16 | 12.60 | 10.50 | 32.52 |
| Liberia | 44.80 | 5.00 | 2.61 | 50.20 | 37.09 | 10.20 | 1.84 | 48.24 |
| Mali | 33.02 | 22.73 | 3.15 | 35.45 | 37.41 | 18.83 | 2.32 | 34.86 |
| Niger | 36.28 | 21.18 | 5.58 | 36.41 | 36.01 | 20.25 | 6.65 | 38.56 |
| Nigeria | 23.89 | 25.32 | 6.55 | 50.79 | 20.85 | 22.32 | 8.74 | 55.80 |
| Senegal | 15.84 | 21.56 | 15.47 | 52.75 | 14.98 | 23.28 | 15.81 | 52.17 |
| Sierra Leone | 52.94 | 7.78 | 2.18 | 35.26 | 60.28 | 5.16 | 1.96 | 32.38 |
| Togo | 28.74 | 14.98 | 7.23 | 56.28 | 23.62 | 15.33 | 6.51 | 27.82 |
Structure of GDP and gross value added (at current market prices) Share of GDP (percent)
Structure of GDP and gross value added (at current market prices) Share of GDP (percent)
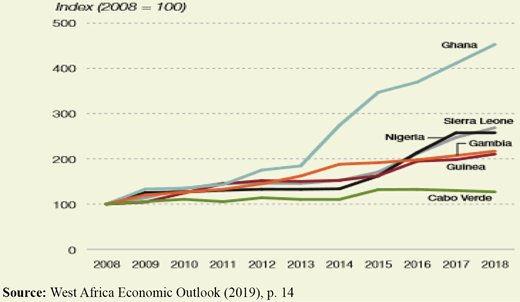
In the preceding two decades, currencies of ECOWAS economies have depreciated in real terms, and Ghana, which once redenominated its currency in 2007, by setting ten thousand cedis to one new Ghana Cedi, GH¢, led the other countries as Figure 3 shows. On the degree of depreciation, Sierra Leone and Nigeria followed in that order, while the exchange rate of Cabo Verde and the Gambia depreciated modestly. Although the Ghanaian cedi, since after the redenomination in 2007, depreciates like other currencies in the region, the cedi's value took a sharp plunge after 2012. In 2018, it depreciated from 1.1 cedis per dollar to 4.8 cedis [African Development Bank (AfDB), 2019b]. In June 2019, the cedi exchanged at 5.5 cedi per dollar, just as the Nigerian naira, due to growing demand and prospects of interest rates hikes, exchanged for 360 naira to a dollar at the parallel market. West African countries being net importers, depreciation could fuel regional inflation, hurt economic growth and cause the economies to become less competitive.
Real exchange rate indices in selected non-West African Economic and Monetary Union countries, 2008–2018
Real exchange rate indices in selected non-West African Economic and Monetary Union countries, 2008–2018
Some improvements were recorded in fiscal balances; fiscal deficits declined from an average of 5.0% recorded in 2014–2016 to 4.7% and 3.6% in 2017 and 2018, respectively (Table 3). The decline in fiscal deficits of ECOWAS economies registered recently was due to favourable revenue receipts in some countries such as Nigeria. Despite the budgetary consolidation exercise [3] in 2018, Ghana had some challenges as its fiscal deficit marginally improved to 5.4% in 2018 from 5.9% in 2017.
Fiscal balances in West Africa, by country – 2014–2019 (% GDP)
| 2014-2016 | 2017 | 2018 | 2019 (projected) | |
|---|---|---|---|---|
| Benin | −5.4 | −5.9 | −4.6 | −2.6 |
| Burkina Faso | −2.6 | −7.5 | −4.7 | −2.9 |
| Cabo Verde | −5.1 | −3.1 | −2.7 | −1.9 |
| Cote d'Ivoire | −3.0 | −4.2 | −0.2 | −3.2 |
| Gambia, the | −7.9 | −7.9 | −3.9 | −0.6 |
| Ghana | −7.2 | −5.9 | −5.4 | −4.4 |
| Guinea | −3.8 | −2.2 | −4.4 | −3.5 |
| Guinea Bissau | −2.5 | −1.3 | −3.5 | −2.2 |
| Liberia | −4.9 | −7.9 | −3.9 | −0.6 |
| Mali | −2.9 | −2.9 | −4.7 | −2.4 |
| Niger | −7.8 | −5.2 | −5.9 | −4.5 |
| Nigeria | −3.0 | −5.2 | 7.3 | −4.2 |
| Senegal | −3.7 | −3.0 | −3.5 | −3.3 |
| Sierra Leone | −6.4 | −6.8 | −6.8 | −7.8 |
| Togo | −9.1 | −2.1 | −6.7 | −1.6 |
| West Africa | −5.0 | −4.7 | −3.6 | −3.0 |
Whether on rational grounds or empiricism, economists differ in their views on the real effects of financing public fiscal deficit on economic growth. Among the mainstream contenders, the neoclassical stance considers fiscal deficits as harmful to economic growth, while in the view of Keynesians, it constitutes an essential policy prescription (Rangarajan and Srivastava, 2005).
Despite the development challenges, some policy interventions required in the West African subregion are those that should promote structural reforms, build public sector institutions, better general management, empowerment, improved domestic revenue mobilization and macroeconomic stabilization.
3. Theoretical perspectives of debt sustainability
The set-off of the multinational debt crisis in developing countries exposed the attendant welfare reducing effects of unsustainable indebtedness of foreign debt in the early 1980s. This indebtedness stimulated new waves of discussions and research about whether public debt, mainly external debt, positively impacts economic growth. The aspect of economic growth, which surveys the association between growth and external debt, argues that low levels of indebtedness (an increase in the share of foreign public debt to GDP) can promote economic growth. And at high levels, indebtedness could harm economic growth (Casares, 2015, p. 1). A differing opinion observed in the literature noted that the foreign debt crisis of the 1980s was due to liquidity shortages, declining terms of trade experienced by primary commodity producers and sluggish growth experienced in industrialized countries, among others (Casares, 2015; Ncube and Brixiová, 2015; AFRODAD, 2003; Warner, 1992). Although not often stressed in the debt literature, it seems plausible that the economic shocks that caused the debt problems would probably have had a less negative effect on economic growth if the flip side of debt sustainability had attracted much attention. Therefore, it is imperative to complement the need to scale up the layout of debt sustainability challenges and economic growth in policy formulation by considering the sustainability of debt dynamics (Buiter, 1985; Blanchard, 1990; Contessi, 2012; Omoruyi, 2016).
External debt sustainability is the capacity and willingness of a debtor country to meet current and future debt service obligations in full, without compromising growth and recourse to debt rescheduling nor accumulation of arrears (International Development Association and the International Monetary Fund, 2001, para. 12). The IMF and World Bank definition, in this instance, relates to either debt capacity or economic development, with the former being the criterion most generally applied in the literature (Ndungu et al., 2004).
Following the lead of Omoruyi (2016, p. 281), the debt sustainability term is somewhat viewed as a blurred and distinct concept, determined by the stratum of reference (when it relates to low-income countries or in the case of middle-income countries that rely more on private financing). In low-income countries, where reliance is on official flows, the debt sustainability concept is blurred in the definition because it (debt sustainability) exists when official creditors and development partners or donors are willing to provide positive net transfers through new financing. As such, debt can be serviced for long periods or suddenly becomes unsustainable, depending on creditors' and donors' willingness to provide net positive transfers through concessional loans and grants. The access here is to donor funding to finance debt.
As a distinct concept, public debt, whether domestic or external, is sustainable where the government is solvent. To be solvent implicitly, the present value of government disbursements (including inherited debt amortization, interest payments and non-interest expenditure) must not exceed the present value (PV) of future revenues. Further, the PV of future revenues net of non-interest spending (primary balance), should cover the existing public debt (Omoruyi, 2016, p. 281). Thus, public debt solvency is predicated on solvency, which satisfies the inter-temporal budget constraints.
There are, however, two main approaches to the debt sustainability study. They are: the IMF and World Bank debt-path-projections and how they relate to thresholds approach, otherwise known as the Joint World Bank-IMF Debt Sustainability Framework, with a variant for Low-Income Countries, and secondly, the debt-stabilizing-primary-balance approach, which looks for the primary balances to achieve a chosen debt path, given the assumptions about the evolution of economic growth and real interest rate (Ncube and Brixiová, 2015).
The modified approach of the joint World Bank-IMF Debt Sustainability Framework (DSF) for Low-Income Countries (LICs), is designed to guide the borrowing decisions of LICs in a manner that the financing needs and current and prospective repayment ability, take into cognizance the country's circumstances (IMF Factsheet, 2016, p. 1). Under the DSF, debt sustainability analyses (DSAs) are conducted frequently and consist of:
a subsequent 20 years review of a country's projected debt burden and its vulnerability to exogenous policy shocks – calculate baseline and stress tests.
an assessment of the risk of external debt distress at that time, based on indicative debt burden thresholds which depend on the quality of the country's policies and institutions; and
recommendations for a lending (and borrowing) strategy that limits the risk of debt distress (IMF, 2016).
According to Painchaud and Stuka (2011, p. 7), DSAs-LICs, by default, are done on gross debt. For LICs, DSA-LICs focuses on different debt burden indicators depending on the coverage of public and publicly guaranteed (PPG) debt. For PPG external debt, the debt burden indicators applied in its methodology include ratios to exports and are as follows:
PV of debt-to-GDP
PV of debt-to-exports.
PV of debt-to-revenues.
Debt service-to-exports.
Debt-service-to-revenues.
For public and publicly guaranteed external and domestic debt (i.e. total public debt), the debt burden indicators are as follows:
PV of debt-to-GDP.
PV of debt-to-revenues.
Debt-service-to-revenues.
A vital feature of the modified approach relates to the relationship between export performance and borrowing cost, on the one hand, and the solvency condition that emerges, on the second hand. The bottom line of this decision is that for the borrower to maintain debt service capacity, the rate at which exports grow must equal or exceed the cost of the borrowed funds (Hjertholm, 2003). One shortcoming of this method is that it assumes a time-invariant growth path for exports and interest rates. These variables follow complicated time paths and limit debt dynamics models for empirically assessing the borrower’s sustainability debt path. Besides, the approach does not consider developments of the import levels (an essential macroeconomic variable that plays a focal role in the borrower's growth process). This feature also tends to undermine the model's applicability when examining debt sustainability (Hjertholm, 2003). Other empirical studies that have applied this approach in various forms and variants are the Ministry of Finance of People’s Republic of China (2019), Cassimon et al. (2016), Nissanke (2013), Painchaud and Stuka (2011), among others.
The debt-stabilizing primary balance approach is relatively simple, transparent and data requirements are few. This approach looks at public debt-to-GDP changes over time and decomposes the changes into debt stock, real interest rate and primary fiscal balance components. The central claim is that a country’s capacity to service debt can be maintained if debt accumulations over time sufficiently contribute to growth. An underlining proviso is that solvency over time requires the rate of output growth to equal or exceed the borrowing rate by using the interest rate as the anchor (Hjertholm, 2003). The debt-stabilizing primary balance framework maintains that policymakers can reduce the public debt-GDP ratio by accelerating growth, improving balances through revenue mobilization, reducing real interest rates and default. A weakness of this method is that it focuses solely on the savings-investment gap. Because this approach does not consider the performance of the foreign sector of the borrower's economy, it undermines a vital transformation challenge (Hjertholm, 2003). Studies that have applied the debt-stabilizing primary balance method are Ng'ang'a et al. (2019), Ncube and Brixiová (2015), Kasekende et al. (2010) and Izák (2009).
Although the two approaches suffer from some shortcomings, they provide valuable insights into the conditions for maintaining debt service capacity. What is paramount in discussing the HIPC debt relief initiative is the concern of debt sustainability, not the superiority of one approach, despite its variants over another. Although the debt relief initiative reduced countries' debt burdens to low levels, it exasperatedly improved their creditworthiness. The debt relief also increased borrowing space even from non-concessional sources (Omoruyi, 2016), like Chinese loans and large-scale domestic borrowing. Such an undue advantage could create another round of vulnerabilities that undermine debt sustainability.
This paper studies the sustainability of ECOWAS member countries' debt dynamics and economic growth using debt path projections and their relation to thresholds approach.
4. Outstanding external debt of Economic Community of West African States member countries
The Heavily Indebted Poor Country (HIPC) Initiative by the World Bank, the International Monetary Fund (IMF), and other multilateral, bilateral and commercial creditors started in 1996. These programs were put in place to cut down the poorest countries' debt, which satisfied some strict criteria and enabled them to scale-up their poverty-reducing expenditures (World Bank and The International Monetary Fund, 2017).
As of 2018 figures, there were 39 countries classified by the initiative as too weak and overwhelmed by unsustainable external debt burdens and hence, were eligible for the intervention. Of these 39 countries, 33 were African countries, of which 13 were West African countries (except Cabo Verde and Nigeria). Why the Debt?
Debt accumulation may be desirable if the borrowed funds are for building quality infrastructure such as transportation, energy, ports, communication (including IT), human capital development, etc. However, it is ludicrous to borrow domestically, externally, or sheer political rascality, to finance consumption. Thus, to service and pay-off debt, a country's expected discounted returns must be greater than the cost of the debt [African Development Bank (AfDB), 2019b].
Various challenges are associated with large stock of external debt, especially when such debt is shrewdly used and managed. Large external debt has implications for macroeconomic management and monetary policy as it undermines two competing objectives of monetary policy-controlling inflation and improvement of external competitiveness. Since sub-Saharan Africa (SSA) countries, including West African countries, have liberalized their financial systems, this makes them susceptible to increased volatility of net capital flows and adverse external developments (Mwega, 2004).
The ECOWAS integration process places a high premium on the convergence of economic structures by avoiding the debt overhang, by member states moving towards policy harmonization and stability, to reduce members' susceptibility to external shock. Despite this, the subregion in 2000, with a debt stock of about USUS$70bn, was the second most indebted in Africa with a 91% debt-GDP ratio and a debt service-export of 20.8%. What collectively accounted for West Africa's increasing debt-export ratio are declining terms of trade experienced by primary commodity producers, declines in export growth rates and negative current account balance (AFRODAD, 2003), which aggravated poverty. The precarious poverty level in the subregion and other developing countries underscored the call for bilateral and multilateral debt forgiveness.
At the end of the first quarter of 2007, 30 (75%) out of 40 countries classified under the HIPC Initiative were in Sub-Saharan Africa, while over one-third (13) were West African. Precisely, only Cabo Verde and Nigeria out of the 15 West African countries were omitted, although Nigeria equally benefited from the debt relief initiatives (Lawason, 2014).
At the turn of the decade preceding 2010, West Africa's average public debt service to export stood at 3.5%. As Table 4 further depicts, the average outstanding external debt to GNI ratio rose from 26.77% in 2013 to 32.94% in 2015, and 36.62% in 2017. In 2018, Cabo Verde recorded the highest debt to GNI ratio with an estimated 92%, followed by Senegal (52.5%), Sierra Leone (45.69%), The Gambia (43.6%) and Liberia (43.46%). In terms of total debt accumulation, Cabo Verde, between 2010 and 2018, recorded the highest level of 754.22%, followed by The Gambia’s 362.78%. However, in 2008, Nigeria's external debt to GNI ratio of 15.2% was the lowest in the region and has been the lowest since 2013. Other ECOWAS countries whose debt-GNI ratio in 2018 was below a threshold of 25% are Guinea (20.9%), Burkina Faso (22.38%) and Nigeria (13.28%). The region's average declined slightly in 2017 from 36.62% to 36.45% in 2018 (WDI, 2020).
External debt stocks (% of GNI)
| Country name | 2010 | 2011 | 2012 | 2013 | 2014 | 2015 | 2016 | 2017 | 2018 |
|---|---|---|---|---|---|---|---|---|---|
| Benin | 16.86 | 17.48 | 15.33 | 16.26 | 15.54 | 19.40 | 19.44 | 22.43 | 25.57 |
| Burkina Faso | na | na | na | na | na | 23.25 | 23.55 | 22.94 | 20.90 |
| Cabo Verde | 55.59 | 58.08 | 74.89 | 83.58 | 87.74 | 100.81 | 96.76 | 104.75 | 92.02 |
| Cote d'Ivoire | 48.77 | 52.37 | 36.81 | 33.00 | 28.46 | 25.41 | 24.44 | 26.87 | 28.05 |
| Gambia, The | 36.21 | 36.74 | 39.10 | 40.97 | 43.67 | 40.44 | 36.54 | 45.47 | 43.64 |
| Ghana | 26.40 | 27.30 | 30.60 | 26.38 | 34.36 | 41.97 | 39.19 | 38.86 | 36.29 |
| Guinea | 51.22 | 51.57 | 20.57 | 23.12 | 23.90 | 24.86 | 25.85 | 23.16 | 22.38 |
| Guinea-Bissau | 133.14 | 27.22 | 29.88 | 29.11 | 28.29 | 33.13 | 27.84 | 32.37 | 37.30 |
| Liberia | 23.03 | 19.73 | 19.81 | 19.19 | 24.24 | 28.97 | 31.79 | 37.63 | 43.46 |
| Mali | 23.97 | 23.36 | 25.58 | 26.90 | 24.74 | 28.82 | 27.77 | 28.87 | 27.97 |
| Niger | 19.88 | 25.67 | 19.50 | 20.03 | 18.87 | 23.42 | 24.92 | 27.72 | 25.24 |
| Nigeria | 5.48 | 5.42 | 4.91 | 5.00 | 5.21 | 6.73 | 8.69 | 11.86 | 13.28 |
| Senegal | 24.31 | 24.55 | 27.90 | 28.01 | 29.00 | 33.97 | 36.08 | 43.60 | 52.54 |
| Sierra Leone | 35.72 | 36.20 | 34.00 | 28.54 | 29.19 | 37.33 | 49.21 | 47.79 | 45.69 |
| Togo | 37.68 | 15.32 | 19.43 | 21.44 | 22.33 | 25.67 | 27.15 | 34.94 | 32.36 |
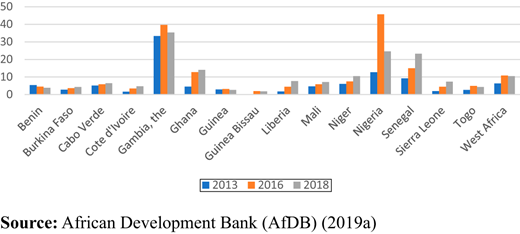
Debt service payments have also increased since 2010 and may not fall in the nearest future. The sustainability of external debt has often resonated. In 2013, Nigeria's foreign debt service payments as a percentage of export stood at 12.7% and rose to 45.7% in 2016 (Figure 4). Ghana falls into a similar category like other West African countries, with debt service accounting for about 40% of revenue (Figure 4). If this is related to the increasing domestic debt burden, estimated at 75% of GDP, the narratives worsen, placing Ghana's debt problems and risk to be severely high. As Figure 4 further shows, other West African countries, except for The Gambia, have maintained a low debt service ratio since 2013, nevertheless suffered significant burden as evidenced by sharp declines in key social-economic indicators. In later years, the spike in debt service payments was due to the growing share of external debts being owed to China – a country critics have accused of extending unsustainable loans (Goldsmith, 2019; WDI, 2020).
Tactlessly, the debt problem in ECOWAS is yet to feature in the community's regional integration agenda. The main reason is that debt always assumes a national character with different profiles and orientations in the various member states within ECOWAS (AFRODAD, 2003, p. 7).
One key message from the above discussions is that developing economies deployed independent policies in managing their foreign debt accumulated over the years, having considered their macroeconomic fundamentals and their capacity to absorb shocks. Coupled with these are copious empirical pieces of evidence indicating that substantial foreign debt and its associated service burden harm growth (Fosu, 1999; Were, 2001; Ali and Mustafa, 2012; Kharusi and Mbah, 2018; Omotor, 2019). For instance, using available data for 35 SSA countries [4]; Fosu (1999) reported that the economic growth rate would have grown by nearly 50% without the external debt burden. Focusing on the effect of debt on investment, Were (2001), using Kenya's data for the period 1970-1995, find that increase in debt service ratio negatively affected private investment; thus, confirming the 'crowding-out' effect of debt service. The findings by Omotor et al. (2020) using country averages of 32 SSA countries from 2005 to 2017, suggest that exports and quality of governance stimulate output positively, while external debt burden hurts economic growth.
Deriving from empirical evidence and considering what bordered on abuse in accumulation of foreign debt by developing countries, mostly in Africa, the need arose in policy cycles to reduce future additional build-ups of obligations. Accordingly, in April 2005, the IMF and World Bank developed the Debt Sustainability Framework (DSA) to assist countries, donors and creditors in financing countries' development needs (IMF Factsheet, 2019). The various indicative thresholds for debt burdens depending on the country's debt-carrying capacity are reported in Table 6. Thresholds that correspond to strong performers indicate that such countries have good macroeconomic fundamentals and policies and can generally handle more considerable debt accumulation.
External debt service to exports of goods and services (%) ratio of selected ECOWAS countries
| Country year | BEN | CPV | CIV | GHA | GIN | MLI | NER | NGA | SEN | SLE | TGO | ECOWAS |
|---|---|---|---|---|---|---|---|---|---|---|---|---|
| TDS/EXP | TDS/EXP | TDS/EXP | TDS/EXP | TDS/EXP | TDS/EXP | TDS/EXP | TDS/EXP | TDS/EXP | TDS/EXP | TDS/EXP | TDS/EXP | |
| 1986 | 16.2 | 12.6 | 35.4 | 28.3 | 12.6 | 22.3 | 30.6 | 38.0 | 27.8 | 39.7 | 29.3 | 26.6 |
| 1987 | 8.9 | 16.2 | 38.4 | 45.8 | 27.2 | 20.3 | 29.5 | 14.1 | 34.4 | 9.0 | 16.9 | 23.7 |
| 1988 | 9.2 | 17.0 | 32.4 | 56.9 | 22.1 | 24.3 | 34.9 | 30.4 | 33.4 | 11.8 | 23.4 | 26.9 |
| 1989 | 8.8 | 11.5 | 33.2 | 50.8 | 16.1 | 19.7 | 27.8 | 24.7 | 30.3 | 4.2 | 16.2 | 22.1 |
| 1990 | 9.9 | 9.1 | 35.4 | 38.8 | 20.1 | 15.3 | 17.8 | 22.6 | 21.1 | 10.1 | 12.3 | 19.3 |
| 1991 | 5.6 | 14.7 | 37.9 | 28.1 | 16.1 | 9.7 | 25.4 | 22.1 | 22.7 | 6.8 | 8.2 | 17.9 |
| 1992 | 5.1 | 18.9 | 32.1 | 28.4 | 12.6 | 12.4 | 12.5 | 18.6 | 14.6 | 17.0 | 6.2 | 16.2 |
| 1993 | 5.4 | 12.4 | 33.2 | 25.6 | 11.0 | 16.5 | 25.2 | 13.4 | 10.3 | 17.5 | 7.0 | 16.1 |
| 1994 | 7.1 | 14.3 | 35.2 | 26.7 | 14.4 | 21.3 | 24.2 | 18.9 | 18.1 | 73.0 | 5.6 | 23.5 |
| 1995 | 7.5 | 11.2 | 23.1 | 25.4 | 24.8 | 16.1 | 17.1 | 14.7 | 17.8 | 64.3 | 6.1 | 20.7 |
| 1996 | 6.4 | 7.7 | 26.5 | 27.6 | 14.9 | 21.1 | 14.7 | 13.1 | 20.3 | 59.5 | 9.7 | 20.1 |
| 1997 | 9.2 | 10.5 | 22.5 | 33.2 | 21.0 | 12.8 | 20.2 | 8.7 | 18.8 | 31.9 | 10.2 | 18.1 |
| 1998 | 10.0 | 17.0 | 25.7 | 22.8 | 19.8 | 12.3 | 16.2 | 13.1 | 22.0 | 44.5 | 7.4 | 19.1 |
| 1999 | 11.0 | 16.3 | 26.8 | 21.1 | 17.4 | 15.0 | 9.5 | 7.6 | 15.8 | 87.8 | 8.5 | 21.5 |
| 2000 | 13.6 | 11.1 | 22.7 | 19.0 | 20.7 | 14.1 | 8.0 | 8.8 | 16.2 | 76.4 | 6.6 | 19.7 |
| 2001 | 8.7 | 8.2 | 13.3 | 12.9 | 12.9 | 8.9 | 8.5 | 12.7 | 14.5 | 112.8 | 7.5 | 20.1 |
| 2002 | 9.0 | 11.9 | 13.8 | 8.6 | 13.0 | 7.6 | 7.7 | 8.1 | 13.9 | 13.5 | 2.7 | 10.0 |
| 2003 | 5.2 | 7.3 | 8.6 | 15.6 | 14.3 | 6.6 | 8.7 | 5.9 | 12.6 | 10.6 | 2.7 | 8.9 |
| 2004 | 5.0 | 7.9 | 5.0 | 8.0 | 20.8 | 8.0 | 7.2 | 4.5 | 14.6 | 10.5 | 2.8 | 8.6 |
| 2005 | 6.0 | 9.6 | 3.5 | 8.6 | 18.8 | 6.9 | 6.7 | 15.4 | 7.9 | 6.9 | 2.5 | 8.4 |
| 2006 | 4.2 | 6.4 | 2.8 | 5.6 | 15.9 | 4.4 | 26.6 | 11.0 | 7.2 | 7.8 | 3.0 | 8.6 |
| 2007 | 2.6 | 5.0 | 4.4 | 3.9 | 13.2 | 3.2 | 4.0 | 1.4 | 6.2 | 2.9 | 1.6 | 4.4 |
| 2008 | 3.7 | 4.3 | 9.0 | 4.1 | 10.7 | 2.6 | 2.4 | 0.8 | 4.8 | 1.7 | 16.0 | 5.5 |
| 2009 | 3.6 | 5.7 | 9.0 | 3.8 | 12.3 | 3.1 | 3.2 | 1.3 | 6.0 | 2.1 | 4.3 | 4.9 |
| 2010 | 3.3 | 5.6 | 5.9 | 4.0 | 6.3 | 2.5 | 1.8 | 1.5 | 8.9 | 2.7 | 2.6 | 4.1 |
| 2011 | 4.0 | 4.9 | 5.3 | 2.4 | 12.8 | 2.4 | 2.4 | 0.5 | 8.9 | 3.4 | 0.7 | 4.3 |
| 2012 | 4.3 | 4.6 | 5.4 | 3.2 | 8.0 | 1.8 | 2.6 | 1.3 | 7.6 | 1.7 | 1.1 | 3.8 |
| 2013 | 3.1 | 4.6 | 8.0 | 6.0 | 4.2 | 3.0 | 6.2 | 0.5 | 8.9 | 1.5 | 2.3 | 4.4 |
| 2014 | 2.5 | 4.8 | 7.2 | 5.5 | 3.6 | 3.0 | 10.7 | 5.3 | 7.8 | 2.3 | 2.8 | 5.0 |
| 2015 | 3.6 | 6.3 | 6.4 | 6.3 | 5.3 | 3.3 | 8.7 | 2.9 | 8.9 | 6.6 | 3.2 | 5.6 |
| 2016 | 4.2 | 5.9 | 13.0 | 10.7 | 2.5 | 3.5 | 13.1 | 6.3 | 9.5 | 3.8 | 4.8 | 7.0 |
| 2017 | 4.2 | 5.9 | 17.6 | 10.4 | 1.4 | 4.5 | 15.6 | 6.8 | 14.2 | NA | 5.8 | NA |
Notes:
In 2011, as the start of oil production drove a surge in Ghana's per capita income, the country graduated from a low-income to lower-middle-income status. Consequently, in 2012, macroeconomic conditions started deteriorating, giving rise to substantial domestic and external imbalances. To stabilize the economy and shore up the public finances, the government adopted a multiyear fiscal stabilization plan in mid-2015, with support from the International Monetary Fund (IMF), the World Bank and Ghana’s other development partners. After achieving a substantial degree of fiscal consolidation in 2015, Ghana missed its 2016 fiscal target by a large margin. To check a further fiscal slippage due to revenue fall, the Ghanaian Government decided to undertake a consolidation program from 2017, which continued through 2018, with additional fiscal adjustments focused on public revenue and expenditures. (see The World Bank, 2017, Fiscal Consolidation to Accelerate Growth and Support Inclusive Development: Ghana Public Expenditure Review, for further details)
As reported in Tables 5 and 6, the debt burden thresholds measured as external debt to export ratio implied that Cote d'Ivoire and Niger could still moderately handle additional external debt accumulation. Ghana stands in a weak position in a further build-up of debt, as additional loans may make the country slide into a debt trap. For ECOWAS generally and other countries reported in Table 6, the external debt to export ratio indicates they may already be turning at the corner of insolvency, and debt overhang as the Community may be paying more than it receives. The above gives credence to why the debt sustainability of ECOWAS member countries should be discussed.
5. Solvency and sustainability of external debt
Since the implementation of the HIPC initiative and the MDRI, concepts such as Present Value (PV) of external debt and Solvency Ratio of External Debt (SRED), among others, in determining sustainable thresholds have gained currency. They have also become part of the debt sustainability analysis literature. The theoretical foundations (economic fundamentals and the PV of interest paid on the debt) used in assessing sovereign debt present value, and their sustainability indicators have also been applied elsewhere (Debrun et al., 2019, for Japan; Mahmood and Rauf, 2012, for Pakistan; Gupta, 1992, for Asia, USA and Canada; Hamilton and Flavin, 1986).
5.1 Present value approach
Following the IMF explanation of the PV approach, “An entity's liability position is sustainable if it satisfies the present value budget constraint without a major correction in the balance of income and expenditure, given the costs of financing it faces in the market” (IMF, 2002, p. 5). When applied to a sovereign entity, “[…] the ratio of the present value of debt to fiscal revenue is defined as the ratio of future projected debt-service payments discounted by market-based interest rates to annual fiscal revenue” (IMF, 2003, p. 175).
In interpreting the ratios, a high and rising present value of the debt-to-exports ratio signifies that the entity or country is on an unsustainable debt path. And as this indicator increases over time, it suggests that the entity or country may have budgetary problems in servicing its debt (See Appendix 1 for 2017 present value of external debt, as percent of Export, and present value of external debt, as percent of GNI). As suggested elsewhere (OIC Outlook Series, 2012), debt stress depends not only on a level of debt as the PV approach would indicate but also on other macroeconomic fundamentals such as institutions' quality. Institutional factors affect the debt sustainability path through policy credibility and policy consistency (Manasse et al., 2003). The quality of institutions is proxied by using the Country Policy and Institutional Assessment (CPIA) policy rating.
5.1.1 Debt policy rating of country policy and institutional assessment.
The CPIA debt policy rating assesses whether a country's debt management strategy is conducive to minimizing budgetary risks and ensuring long-term debt sustainability (World Bank Group, 2013). The CPIA score categorizes countries into three groups: Strong, Medium and Weak. Table 7 reports the thresholds of the indicators based on the CPIA debt score (see Appendix 2 for CPIA score of ECOWAS countries).
CPIA policy and assessment threshold
| Threshold | PV of Debt/Export | PV Debt/GNI | Debt Service/Export |
|---|---|---|---|
| Weak policy (CPIA ≤ 3) | 100 | 30 | 15 |
| Medium policy (3 < CPIA < 3.9) | 200 | 45 | 25 |
| Strong policy (CPIA ≥ 3.9) | 300 | 60 | 35 |
In this paper, we applied the latest classifications according to CPIA rankings in 2017 to examine two debt sustainability indicators: Present Value of External Debt to Export and Present Value of External Debt to GNI using averages of the study period. The results reported in Table 8 classifies ECOWAS countries assessed under the policy thresholds as Strong, Medium and Weak.
Ratios based on the present value of external debt to export and GNI
| Weak policy (CPIA ≤ 3) | Medium policy (3 < CPIA ;< 3.9) | ||||||
|---|---|---|---|---|---|---|---|
| PV of Debt/Export | PV of Debt/GNI | PV of Debt/Export | PV of Debt/GNI | ||||
| Cabo Verde | 158.3 | Gambia, The | 34.11 | Threshold | 100 | Ghana | 36.37 |
| Gambia, The | 128.16 | Cabo Verde | 80.81 | Cote d'Ivoire | 69.04 | Threshold | 30.00 |
| Threshold | 100 | Threshold | 30.00 | Ghana | 80.23 | Guinea | 7.61 |
| Guinea-Bissau | 57.63 | Togo | 15.34 | Guinea | 16.92 | Cote d'Ivoire | 22.49 |
| Togo | 49.59 | Guinea-Bissau | 15.96 | Liberia | 88.33 | Liberia | 21.41 |
| ECOWAS | 82.52 | Sierra Leone | 21.59 | ||||
| Strong policy (CPIA ≥ 3.9) | ECOWAS | 24.62 | |||||
| PV of Debt/Export | PV of Debt/GNI | ||||||
| Niger | 174.69 | Senegal | 33.51 | ||||
| Senegal | 126.71 | Threshold | 30.00 | ||||
| Threshold | 100 | Benin | 17.12 | ||||
| Nigeria | 17.99 | Burkina Faso | 14.85 | ||||
| Benin | 62.68 | Mali | 16.98 | ||||
| Burkina Faso | 51.09 | Niger | 28.56 | ||||
| Mali | 73.97 | Nigeria | 2.58 | ||||
Among the weak debt policy countries of the ECOWAS countries using 2017 ranking, Capo Verde and The Gambia have ratios of Present Value of External Debt to Export and Present Value of External Debt-GNI that are above the thresholds. Guinea Bissau and Togo ratios of Present Value of External Debt to Export and Present Value of External Debt to GNI fell below the threshold. The implication is that Capo Verde and The Gambia are moving along the unsustainable debt trajectory, and they require better and effective policies to manage their debts and partly by promoting value-added exports. These countries may have budgetary problems in servicing their debts if they relapse in strengthening their institutions.
ECOWAS countries classified as having medium debt policy (3 < CPIA < 3.9) are Cote d'Ivoire, Ghana, Guinea and Liberia, whose ratios below the threshold using the two indicators (present value of external debt to export and present value of external debt to GNI). As for Ghana, the present value of the external debt to GNI ratio is marginally above the threshold of 30 points. The above bolsters the stance that further accumulating debts may make these countries slide into the debt trap.
The ECOWAS countries assessed to have a strong debt policy (CPIA ≥ 3.9) are Benin, Burkina Faso, Mali, Niger, Nigeria and Senegal. The present value of external debt to export and present value of external debt to GNI of Benin, Burkina Faso, Mali, Niger and Nigeria have ratios that fell below thresholds. In the case of Senegal and Niger, however, their present value of external debt to export ratios are above the threshold. ECOWAS countries are advised to establish debt management agencies such as Nigeria's Debt Management Office (DMO) to manage their debts. There is a need for deliberate policy intervention to promote value-added exports instead of exporting primary goods to revving their export earnings. Such will put them on a better trajectory of earning foreign exchange that may be needed debt servicing and principal payments as they fall due.
One general lesson learned from the range of relevant thresholds estimates is that ECOWAS countries are not necessarily homogenous in terms of institutional strength. Therefore, each country needs to upscale its institutional framework appropriately, and for the regional body as a whole, a regulatory framework that ensures debt sustainability safeguards and compliance are necessary.
5.2 Solvency and liquidity
The Solvency Ratio of External Debt (SRED), according to Ulca and Oksay (2011), is the ratio of the sums of current and capital account to the debt service (amount of principal and interest payments). The SRED, like its counterpart- Solvency Ratio (SR) of a firm, measures a company’s solvency in terms of its ability to pay long-term debts by comparing the company's after-tax income, free of non-cash depreciation expenses, to its total liabilities, can be used to predict the sovereign financial crisis.
The SRED formulation has been applied elsewhere before. Ucal and Oksay (2011) using Turkey data set, computed SRED from the country's balance of payments' “current account” and “capital account”. The purpose of Ucal and Oksay (2011) paper is to measure Turkey's capacity to meet its external debt obligations. This paper follows the lead by Ucal and Oksay (2011) by applying the SRED formulation calculated as:
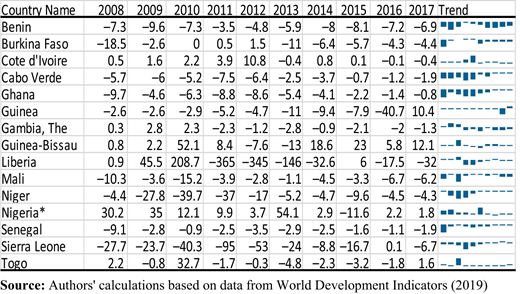
SRED is calculated for the repayments of interest and principal payment per year. A SRED ratio close to 1 or greater than 1 signifies increasing debt servicing ability. In contrast, a value of less than 1 indicates foreign currency shortage is imminent and the possibility of a future financial crisis. A negative ratio denotes a severe liquidity problem that may result in insolvency (OIC Outlook Series, 2012). In such a situation, through its appropriate institution, the country would need to approach the international capital markets for new loans if the reserve account is not sufficient to cover the deficit (Ucal and Oksay, 2011).
Due to data inadequacy and inconsistency, Figure 5 reports the solvency ratio of external debt (SRED) for the period 2008–2018 only, but for all ECOWAS member countries. Except for Guinea Bissau and, to some extent Nigeria, other ECOWAS countries fall into high-risk groups. These countries' solvency ratios of external debt (SRED) were negative for most of the years reported. As established in the literature, when a country records a persistent negative quotient over time, foreign investors could lose confidence, exacerbates capital flight risk and cause a drift towards a financial crisis. It is also an indication that foreign exchange inflows into these countries may worsen over time, and the risk of default in honoring their external debt commitments becomes obvious.
5.3 Concessional loans and debt sustainability
The inexorable rise in the region's member countries' external indebtedness has raised some disquiets, given that most of the new loans were accessed through the non-concessional window of multilateral, bilateral and commercial creditors, besides international bond markets. The challenge in obtaining non-concessional loans is that they are provided at a market-based interest rate with a short moratorium. Like China's Belt and Road Initiative (BRI), such as associated loans, which often entails lending to sovereign borrowers to fund infrastructural development, have less stringent conditions to access. They are also more associated with high risk and laced with complicated repayment terms. A significant challenge is that the debt relief program provided under the HIPC initiative, and the MDRI may have incongruously opened borrowing space for beneficiaries. Hence, the obsession for non-concessional loans at all costs by most of them. Accordingly, lenders and borrowers need to ensure that debt sustainability conditions and other required considerations in the Debt Sustainability Framework (DSF) of concessional loans are incorporated into such new lending decisions to avoid mismanagement concerns.
Although non-concessional loans such as BRI (Chinese investments) of most ECOWAS countries are regarded to be relatively small, the IMF has nevertheless warned on the region's rising debt profile. Most affected countries are Cabo Verde, The Gambia, Ghana, Mauritania and Togo, whose debt burden is already relatively huge. The warning further heightened the criticism of China's aggressive push into Africa and its “debt-trap” strategy, just as members of the US Senate bipartisan committee referred to China's economic incursion in the guise of giving out “cheap loans”, as predatory practices. In some cases, the Chinese loans have resulted in some countries applying for bailout loans from the International Monetary Fund (IMF) to repay loan arrears to China.
For instance, in 2016, the IMF agreed to extend a US$1.5bn bailout loan to Sri Lanka as a result of the country's indebtedness to China. This approval was after Sri Lanka granted a 99-year lease of the Hambantota Port to China arising from the country's inability to pay over US$1bn owed to China. Early in 2018, Bangladesh, citing an incidence of alleged corruption against the state-backed Chinese Harbor Engineering Company (CHEC), terminated a plan to have CHEC (Chinese state-run firm) construct a 214-kilometer highway from Dhaka (Capital city) to its northeast (Lindberg and Lahiri, 2018). Malaysia has equally rescinded some high-profile projects like the 688 km East Coast Railway Link (ECRL) estimated to cost US$13.4bn and a US$2.5bn agreement for an arm of a Chinese energy giant to construct gas pipelines. These projects, which the Malaysians cited as bad deals, were mostly financed by the Chinese government-owned bank- Export and Import Bank of China (Erickson, 2018).
Examples of other countries that have regrettably received cash from China's Belt and Road Initiative are Djibouti, Myanmar and Montenegro. They are only to find out that the Chinese investments fell short of being supportive, just as the closed bidding processes resulted in inflated contracts and an influx of Chinese drudges at the expense of local workers (New Straits Times, 2018). These lessons are food for thought for ECOWAS member countries.
6. Concluding remarks
For SSA countries to address the challenges of poverty, infrastructure (hard and soft) deficits and jobless economic growth, the hindrance constituted by financial resource constraints requires attention. One such way is sourcing external financing in the form of external borrowing through bilateral, multilateral and concessional loans.
From the modest debt analysis, external debt ratios indicate that most Economic Community of West African States (ECOWAS) member countries' debts are not sustainable. The region may already be turning at the corner of insolvency and debt overhang. It further suggests that the debt relief strategy has not been successful. The countries are already sliding back into another round of debt trap, thus creating a vicious cycle of external borrowing that could lead to capital flight.
A further observation from the analyses is that management of external debt and its associated risks among the ECOWAS member countries are heterogeneous. Moreover, the economic growth patterns of these countries are not also homogenous. Thus, there is the likelihood that their policy and institutional frameworks such as trade and border policies, macroeconomic fundamentals and shock absorption levels will also not be homogeneous. However, to complementarily overcome the related risks, broader macroeconomic stability and institutional reforms would be required to stem another round of capital flight through a cyclical series of external borrowing.
The Solvency Ratio of External Debt (SRED), on the other hand, reveals that ECOWAS member countries except for Guinea Bissau and probably Nigeria belong to the high risks group. This precarious position suggests a movement towards financial crisis and an indication that if conditions in the community worsen further, the verge of default in honouring external debt commitments will become apparent.
The deficit in domestic resource mobilization is a copious reason why ECOWAS member countries resulted in foreign borrowing. For these countries to ramp-up their revenue base, they can leverage on four critical resources. The vital sources are:
expanding the tax base to raise tax revenues;
capitalizing on natural resource wealth by adding to the value chain;
curbing illicit financial outflows; and
enhancing the return of illicit funds lodged in foreign banks.
Other policy interventions require that the region undertake some structural reforms, build public sector institutions, better general management and macroeconomic stabilization, as the results have shown.
Moreover, the paper further recommends that more non-Paris Club creditors (including bilateral, small multilateral and commercial creditors), such as the Chinese State and quasi-commercial lending institutions, should be included in the HIPC debt relief platform. Besides, loans should be ring-fenced and granted to borrowers to enhance their economic and structural diversification and promote the export of processed primary commodities with significant value addition. Moreover, the paper further suggests mainstreaming debt sustainability analysis into the national planning of ECOWAS member economies. Such fusion requires scaling up work on debt transparency and debt-related fiscal risk management that could strengthen results.
One of the limitations of the study is that a number of the ratios used in measuring debt sustainability are simplistic and possibly also unduly optimistic. Consequently, further inputs and variables that reflect the diversity of different economies should be presented as requirements for assessing a country’s worthiness for additional loans. Studies on ECOWAS that apply the debt-stabilizing primary balance approach, as the established literature has highlighted, are further needed for a robust understanding of the region's debt sustainability status. The finding that the recent strident rise in the region's member countries' external indebtedness was due mostly to loans accessed through the non-concessional window of multilateral, bilateral and commercial creditors, besides international bond markets, merits further close study.
Notes
Examples of policy failures embarked on by most West African countries in the mid-1980s were the shades of different Structural Adjustment Programmes adopted by these countries, the widespread use of political power for individual gain, the abuse of human rights. Other large resource commitments to big, capital intensive farms (frequently state owned) and large irrigated schemes. These suffered from technical and management problems leading to underutilization of high-cost machinery and difficulty maintaining essential equipment (Overseas Development Institute (ODI), 1982).
See Section 4 for further elaboration on the HIPC initiative.
BEN = Benin, CPV = Cape Verde, CIV = Cote d'Ivoire, GHA = Ghana, GIN Guinea, MLI = Mali, NER = Niger, NGA = Nigeria,SEN = Senegal, SLE = Sierra Leone, TGO = TogoECOWAS = Economic Community of West African States.
The sample comprises 35 SSA countries (Benin, Botswana, Burkina Faso, Burundi, Cameroon, Central African Republic, Chad, Congo, Cote d’Ivoire, Ethiopia, Gabon, Gambia, Ghana, Kenya, Lesotho, Liberia, Madagascar, Malawi, Mali, Mauritania, ˆ Mauritius, Niger, Nigeria, Rwanda, Senegal, Sierra Leone, Somalia, Sudan, Swaziland, Tanzania, Togo, Uganda, Zaire, Zambia and Zimbabwe).
References
Further reading
Appendix 1
2017 present value of external debt (as % of export)
Present value of external debt (as % of GNI)
| Country name | PV/EXP | Country name | PV/GNI |
|---|---|---|---|
| Guinea | 16.92 | Guinea | 7.61 |
| Nigeria | 17.99 | Nigeria | 2.58 |
| Benin | 62.68 | Benin | 17.12 |
| Burkina Faso | 51.09 | Burkina Faso | 14.85 |
| Cabo Verde | 158.3 | Cabo Verde | 80.81 |
| Cote d'Ivoire | 69.04 | Cote d'Ivoire | 22.49 |
| Gambia, The | 128.16 | Gambia, The | 34.11 |
| Ghana | 80.23 | Ghana | 36.37 |
| Guinea-Bissau | 57.63 | Guinea-Bissau | 15.96 |
| Liberia | 88.33 | Liberia | 21.41 |
| Mali | 73.97 | Mali | 16.98 |
| Niger | 174.69 | Niger | 28.56 |
| Senegal | 126.71 | Senegal | 33.51 |
| Sierra Leone | NA | Sierra Leone | 21.59 |
| Togo | 49.59 | Togo | 15.34 |
| ECOWAS | 82.52 | ECOWAS | 24.62 |
Appendix 2
CPIA Debt policy rating (1 = low to 6 = high) of ECOWAS countries
| Country | 2005 | 2006 | 2007 | 2008 | 2009 | 2010 | 2011 | 2012 | 2013 | 2014 | 2015 | 2016 | 2017 |
|---|---|---|---|---|---|---|---|---|---|---|---|---|---|
| BEN | 3.5 | 3.5 | 3.5 | 3.5 | 3.5 | 3.5 | 3.5 | 4 | 4 | 4 | 4 | 4 | 4 |
| BFA | 4.5 | 4 | 4 | 4 | 4 | 4 | 4 | 4 | 4 | 4 | 4 | 4 | 4 |
| CPV | 4 | 4 | 4.5 | 4.5 | 4.5 | 4 | 3.5 | 3.5 | 3.5 | 3.5 | 3.5 | 3 | 2.5 |
| CIV | 1.5 | 1 | 1.5 | 2 | 2.5 | 2 | 2 | 2.5 | 3 | 3.5 | 3.5 | 3.5 | 3.5 |
| GMB | 2.5 | 2.5 | 2.5 | 3 | 3 | 3 | 3 | 3 | 3 | 2.5 | 2.5 | 2.5 | 2 |
| GHA | 4 | 4 | 4 | 4 | 4 | 4 | 4 | 4 | 3.5 | 3 | 3 | 3.5 | 3.5 |
| GIN | 2.5 | 2.5 | 2.5 | 2.5 | 2 | 2 | 2.5 | 3 | 3 | 3 | 3 | 3 | 3 |
| GNB | 2 | 1.5 | 1.5 | 1 | 1.5 | 2 | 2.5 | 2.5 | 2.5 | 2.5 | 2.5 | 2.5 | 2.5 |
| LBR | – | – | – | – | 2.5 | 3 | 3.5 | 3.5 | 3.5 | 3.5 | 3.5 | 3.5 | 3.5 |
| MLI | 4.5 | 4.5 | 4.5 | 4.5 | 4.5 | 4 | 4 | 3.5 | 3.5 | 3.5 | 4 | 4 | 4 |
| NER | 3.5 | 3.5 | 3.5 | 3.5 | 4 | 4 | 4 | 4 | 4 | 4 | 4 | 4 | 4 |
| NGA | 3.5 | 4 | 4.5 | 4.5 | 4.5 | 4.5 | 4 | 4 | 4.5 | 4.5 | 4.5 | 4.5 | 4 |
| SEN | 4 | 4 | 4 | 4 | 4 | 4 | 4 | 4.5 | 4.5 | 4.5 | 4.5 | 4.5 | 4.5 |
| SLE | 3.5 | 3.5 | 3.5 | 3.5 | 3.5 | 3.5 | 3.5 | 3.5 | 3.5 | 3.5 | 3.5 | 3.5 | 3.5 |
| TGO | 1.5 | 1.5 | 1.5 | 2 | 2.5 | 3 | 3 | 2.5 | 2.5 | 2.5 | 2 | 2 | 2.5 |

