The purpose of this paper is to demonstrate the impact of the welding sequence on the substrate plate distortion during the wire and arc additive manufacturing (WAAM) process. This paper also aims to show the capability of finite element simulations in the prediction of those thermally induced distortions.
An experiment was conducted in which solid aluminum blocks were manufactured using two different welding sequences. The distortion of the substrates was measured at predefined positions and converted into bending and torsion values. Subsequently, a weakly coupled thermo-mechanical finite element model was created using the Abaqus simulation software. The model was calibrated and validated with data gathered from the experiments.
The results of this paper showed that the welding sequence of a part significantly affects the formation of thermally induced distortions of the final part. The calibrated simulation model was able to capture the different distortion behavior attributed to the welding sequences.
Within this work, a simulation model was developed capable of predicting the distortion of WAAM parts in advance. The findings of this paper can be used to improve the design of WAAM welding sequences while avoiding high experimental efforts.
1. Introduction
Additive manufacturing (AM) is increasingly gaining relevance and is used in multiple applications in numerous industries (Wu et al., 2018; Vafadar et al., 2021). Compared to traditional manufacturing technologies, such as milling and casting, AM has significant benefits because of its freedom of design and short lead times. Wire and arc additive manufacturing (WAAM) is an AM technology, more specifically a directed energy deposition (DED) process, that is capable of rapidly producing large metal components in a layer-wise manner (Almeida and Williams, 2010). Parts are manufactured by controlled deposition and stacking of weld seams using gas-tungsten, gas-metal and plasma arc welding methods (Xia et al., 2020). Compared to other metal AM technologies, such as the powder bed fusion of metals, WAAM offers significant advantages, such as high deposition rates, large build volumes, high energy efficiency and low investment costs (Ding et al., 2015). The main drawbacks of WAAM are the high surface roughness and the distortion of the part. Hence, the subtractive machining of functional surfaces is an integral part of the WAAM process chain (Fuchs et al., 2019).
1.1 Motivation
During the WAAM process, local regions of the part are subjected to cycles of heating and cooling at varying intensities. The associated recurrent thermal expansion and shrinkage drive the formation of residual stresses within the part. Residual stresses that surpass the local ultimate tensile strength cause cracks, while those that only exceed the local yield strength result in plastic deformation (Mercelis and Kruth, 2006; Radaj, 1992). These shape deviations, caused by thermal warpage, pose risks to the functionality of the final part. Ultimately, distortions may lead to exceeded tolerance requirements and, in the worst case, lead to scrap parts. It is, therefore, of crucial importance to reduce thermal warpage to a minimum.
Various strategies for counteracting distortions and residual stresses during the WAAM process have been proposed in the literature. Balanced building (Ding, 2012) and inter-pass rolling (Colegrove et al., 2013) are effective techniques for reducing distortions. However, they are limited to specific geometries and involve additional process steps. A more universal approach is to optimize the welding sequence. Such studies focusing on stresses and distortions can be widely found for conventional welding applications. Biswas et al. (2011) investigated the influence of the welding sequence of stiffeners on the distortion of a plate, while Belitzki et al. (2019) used simulation and artificial intelligence to optimize the welding sequence of a frame structure. In addition, authors of other studies have confirmed that the welding sequence has a significant effect on the part distortion (Fu et al., 2016; Tsai et al., 1999). Investigation of the welding sequence used for WAAM parts has primarily focused on improving the shape accuracy of various geometric elements such as T-crossings (Venturini et al., 2016) and contours (Xiong et al., 2019; Mu et al., 2022). However, there is only scarce research on the effect of the welding sequence on part distortions in WAAM. One of the few such studies was conducted by Li et al. (2021), who demonstrated a reduction in substrate plate bending of approximately 14% when using spiral patterns as opposed to raster fill patterns.
While experimental investigations are inherently costly and time-consuming, numerical simulations offer the opportunity to predict temperatures and part distortions before the WAAM process. The proliferation of increasingly powerful computer hardware and sophisticated software has led to considerable advances in both WAAM technology and numerical simulation. The majority of simulation studies were conducted on single-seam wall geometries with a focus on heat source design (Montevecchi et al., 2016; Peyre et al., 2008) and model validation (Peyre et al., 2008; Oyama et al., 2019; Graf et al., 2018; Ding et al., 2011). Investigations on more complex and voluminous parts, in which the influence of the welding sequence is more pronounced, were conducted by Israr et al. (2018) in a purely simulative comparison study and by Baehr et al. (2021) using a temperature-based optimization approach.
While the significance of the welding sequence has been demonstrated and the groundwork for WAAM simulations has been laid, the full potential of adapting the welding sequence to reduce WAAM part distortion has yet to be explored. This work focuses on the experimental and simulative investigation of the substrate plate distortion in a block-shaped WAAM part manufactured using two different welding sequences.
1.2 Objectives
The main objectives of this work are:
to demonstrate the correlation between the welding sequence and the substrate plate distortion of WAAM parts; and
to demonstrate the ability of the WAAM simulation to predict the substrate plate distortion caused by different welding sequences.
2. Experimental methods and equipment
2.1 Materials and experimental setup
The experimental setup consisted of a welding power source (TPS 400i, Fronius, Austria) mounted on a robotic arm (MH24 robot with a DX200 controller, Yaskawa, Japan) and a welding table. The welding torch was moved perpendicularly to the substrate at all times. The substrate material consisted of AA 5083 plates (Bikar Metalle, Germany) with the dimensions 140 mm × 140 mm × 10 mm. The feed material was an AA 5183 wire with a diameter of 1.2 mm (Safra S.P.A, Italy), while the shielding gas was Argon 4.6 (Linde, Germany). The chemical compositions of the materials are given in Table 1.
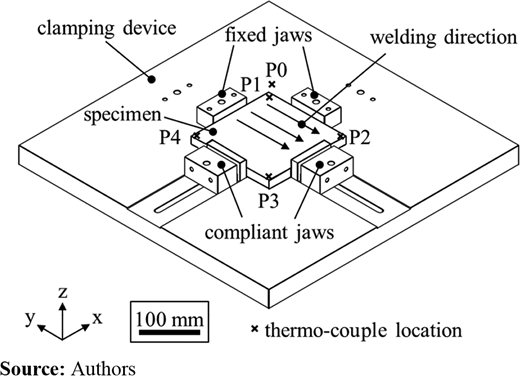
A custom clamping device was constructed for the experiment (Figure 1). The clamp was designed to hold the specimen using four jaws, of which two were fixed and two were spring-loaded and slightly compliant. The spring mechanism ensured that the substrate material could expand and deform freely over the course of the WAAM process. To calibrate the thermal simulation, one thermo-couple was placed on the clamp alongside the specimen at the calibration point P0, and four thermocouples were positioned in the corners of the specimen at the calibration points P1 to P4.
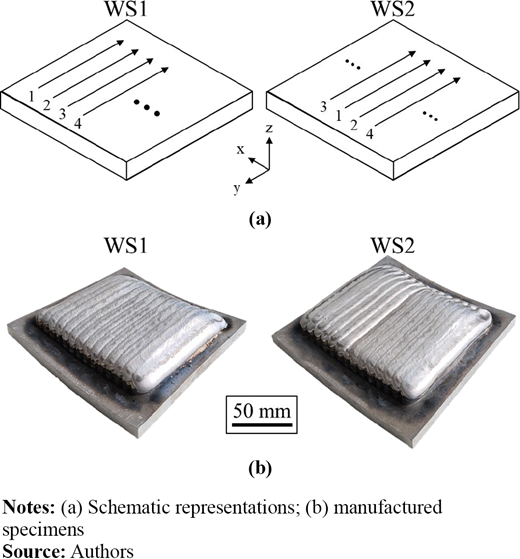
This study investigated two different welding sequences (WSs). In the asymmetric welding sequence (WS1), the seams were applied successively next to each other, while in the symmetric welding sequence (WS2), the weld seams were deposited, beginning with the inner seams and working outwards. All specimens consisted of four layers, each with 14 parallel weld seams. Figure 2 shows the welding sequences together with a corresponding specimen. The seams were applied in different orders, while the target geometry and the welding parameters remained identical. The welding processes used were Fronius cold metal transfer (CMT) and Fronius CMT Puls Mix. While the first layer of each specimen was welded using the higher-power Fronius CMT Puls Mix process to ensure a solid bond of the feed material to the base plate, the lower-power Fronius CMT process was selected for the three upper layers. The waiting time between the deposition of each seam was 11 s because of the travel time of the welding torch and the preparation times required by the power source before and after each welding process. The welding parameters are summarized in Table 2. To account for statistical outliers, a total of four specimens were manufactured with each welding sequence.
2.2 Shape analysis
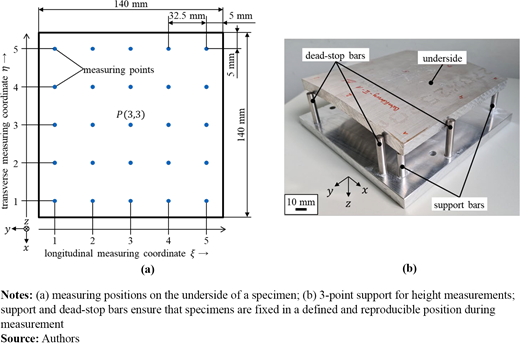
The distorted shape of a specimen was examined with regard to the following three types of distortions: longitudinal bending, transverse bending and torsion. In preparation for the distortion measurements, the underside of each specimen was marked with 25 measuring points in a regular grid pattern before the WAAM process. After the experiment, height measurements were obtained at these points. A measuring point P(ξ,η) was identified by its longitudinal (ξ) and transverse (η) measuring coordinates [Figure 3(a)]. Longitudinal coordinates were parallel to the welding direction, while transverse coordinates were perpendicular to it. After welding, the specimens were placed on a purpose-built three-point support device [Figure 3(b)] with the welded surface facing downwards and measured at the previously marked points using a vertical digital caliper. The height measurements h(ξ,η) in the z-direction were referenced to the height of the central measuring position h(3,3) of each respective specimen to ensure transferability across this experimental series. The 25 height measurements of each specimen were then converted into distortion values using the following procedure: The total longitudinal bending b1,total and the total transverse bending bt,total of a specimen were defined as the average of the longitudinal bending values b1(η) and the average of the transverse bending bt(ξ) values, respectively. In the context of this study, the longitudinal bending value b1(η) was specified as the average height difference between the outer points [h(1,η), h(5,η)] and the center point [h(3,η)] at a transverse coordinate η and was determined by the following equation:
Correspondingly, the transverse bending value bt(ξ) was specified as the average height difference between the outer points [h(ξ, 1), h(ξ, 5)] and the center point [h(ξ, 3)] at a longitudinal coordinate ξ and was determined by the following equation:
Consequently, the total longitudinal bending value b1,total and the total transverse bending value bt,total were defined as follows:
and:
The total torsion τtotal of a specimen was specified as the difference in height deviation between the measuring points at the edges:
Undesired tilt of the specimen during the height measurements was compensated by this formula.
3. Simulation methods
3.1 Numerical setup
A transient, weakly coupled, thermo-mechanical finite element simulation was used to capture the WAAM process numerically. The simulation was executed in two steps, with the thermal simulation preceding the mechanical one. This method considers the effects of the thermal field on the formation of strains and stresses while neglecting the influence of distortions affecting the thermal field. This assumption has been generally accepted and has been used widely in welding simulations (Lindgren, 2001) and WAAM simulations (Ding et al., 2011; Montevecchi et al., 2016). All finite element simulations were conducted with Abaqus software in conjunction with the AM Module, which combines several subroutines to facilitate the simulation of WAAM and other DED processes.
3.1.1 Material activation
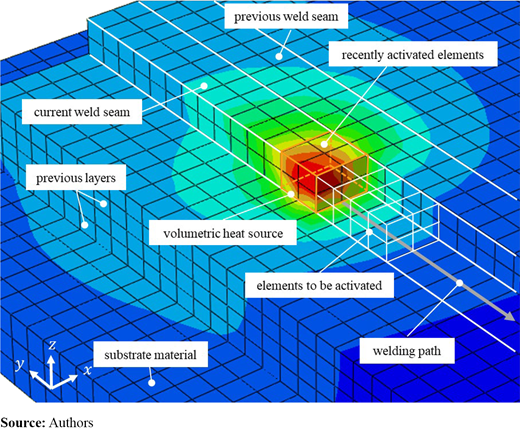
The material-adding aspect in the WAAM simulation made use of the element activation feature in Abaqus. The welding trajectory was converted into a moving heat source as the material was simultaneously activated in the process zone. Active elements had the full value of the assigned thermal and structural material properties, while the values of inactive elements were zero. Inactive elements, therefore, had no impact on the part before their activation. At the start of the simulation, the substrate consisted of active elements, while the AM part comprised inactive elements only. The inactive elements were then activated successively along the welding trajectory in the transient simulations. In the thermal simulation, the heat source and the material activation followed the path specified in a tabulated file. In the mechanical simulation, the welding trajectory was continuously adjusted in line with the part distortion. Figure 4 shows the simulation environment and the material activation procedure.
3.1.2 Thermal simulation
3.1.2.1 Governing equation.
The governing equation for thermal conduction is the heat equation, specified as follows:
in which t is the temporal variable, is the spatial coordinate, ∇ is the nabla operator and T is the temperature. The variables ρ(T), cp(T) and λ(T) are the temperature-dependent density, specific heat capacity and thermal conductivity. The variable is the time- and space-dependent internal heat source.
3.1.2.2 Heat source.
In literature, a number of dedicated heat source models have been proposed for the simulation of welding processes. Heat source shapes range from planar Gaussian power distributions (Pavelec et al., 1969) over volumetric double-ellipsoid power distributions (Goldak et al., 1984) to specifically designed power distribution geometries for DED processes (Montevecchi et al., 2016, Zapata, 2023). The aforementioned heat source models were designed to capture the melt pool shape and, thus, require a high temporal and a high spatial resolution in the simulation, entailing a high number of time steps and a fine mesh. While such a fine discretization is computationally expensive, it is unnecessary in the use-case of thermo-mechanical simulations on a part scale with a focus on thermally induced distortions (Lindgren, 2007). Hence, in this work, a simpler square-based cuboid heat source with a uniform power distribution was chosen for the simulation. It was defined as follows:
where is the time- and space-dependent power output of the welding power source, µ is the efficiency and hhs, whs and lhs are the height, width and length of the heat source, respectively. The dimensions of the cuboid corresponded to the height and width of the simulated weld seams. The height was calibrated by measuring the height of a weld seam, and the width was equal to the distance between the centers of two neighboring weld seams. The power output was calculated by matching the power output recorded in the log files of the power source and matching it to the spatial coordinates determined by the robot tool path. The efficiency of the heat source µ was determined by trial using a calibration process, in which the slope and the local temperature maxima of the simulation results were iteratively matched to the experimental measurements.
3.1.2.3 Initial and boundary conditions.
The convection boundary was defined as follows:
where k is the heat transfer coefficient, A is the surface area on which the heat transfer is active, T1 is the temperature of the solid surface and T2 is the temperature of the surrounding fluid. Thermal boundary conditions causing the examined specimens to lose heat energy consisted of the atmospheric heat convection with the heat transfer coefficient kair and the heat conduction into the clamping device, which was approximated using a second convection boundary with a higher convection coefficient kcontact, using an approach similar to that of Ding et al. (2011). As the experiment allowed for thermal warpage of the specimen, the contact area between the specimen and the clamp changed during the WAAM process. The edges of the specimen bent upwards, reducing its area of contact with the clamping device and decreasing the heat flux through the thermal boundary. This effect was accounted for in the calibration, where the convection coefficient kcontact is continuously adjusted during the simulation. Thermal radiation was neglected in the numerical model, as the emissivity of aluminum is comparatively low. At the start of the simulation, the initial condition was as follows:
where t0 is the initial time and T0 is the initial temperature field.
3.1.3 Mechanical simulation
3.1.3.1 Governing equations.
Mechanical simulation was performed to calculate the distortion of the specimen. It was quasi-static, which implies a change in distortion in time without considering inertia forces. The result obtained from the thermal simulation was imported into the structural analysis as the thermal load. The governing balance equation for the structural analysis is the stress equilibrium:
where σ is the Cauchy stress tensor and b is the body force vector. The constitutive relationship between stress and strain is as follows:
in which C is the fourth-order material stiffness tensor and εel is the elastic strain. It is given by the equation:
where ε, εpl and εth are the total, plastic and thermal strain components, respectively. Assuming isotropic hardening and no volumetric plastic strain in the metal material, the plastic strain is determined using the von Mises yield criterion:
where σy(T) is the material-specific and temperature-dependent yield strength. The von-Mises stress σv is defined as:
with : being the notation for the Frobenius inner product and S as the deviatoric stress matrix:
where I is the identity matrix.
3.1.3.2 Initial and boundary conditions.
The boundary conditions in the mechanical simulation were set to mimic the three-point support measuring device. The support position close to P(1,1) as fixed in the x-, y-, and z-directions, the one close to P(1,5) in the x- and z-directions and the one close to P(3,5) in the z-direction. Only translational but no rotational restrictions were imposed on the three fixed points. This setting allowed the simulated specimens to deform and expand freely, as under experimental conditions.
3.1.4 Temperature-dependent material properties
The temperature-dependent material properties for the substrate (AA 5083) and the wire (AA 5183) used in the thermo-mechanical simulations were obtained from the literature (Kaufman, 1999; CEN The European Union, 2007) and are given in Table 3. The density and Poisson’s ratio were assumed to be constant, at 2,660 kg/m3 and 0.33, respectively. Material properties above the melting temperature were assumed to be constant at the given value closest to the melting temperature.
3.2 Mesh convergence study
A mesh convergence study was conducted on the transient thermo-mechanical simulation based on the specimens’ geometry. All simulations in the mesh convergence study were performed using eight CPUs to ensure comparability.
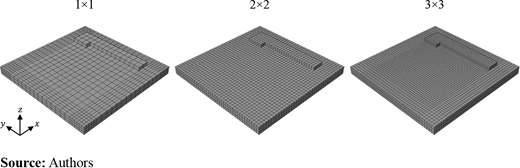
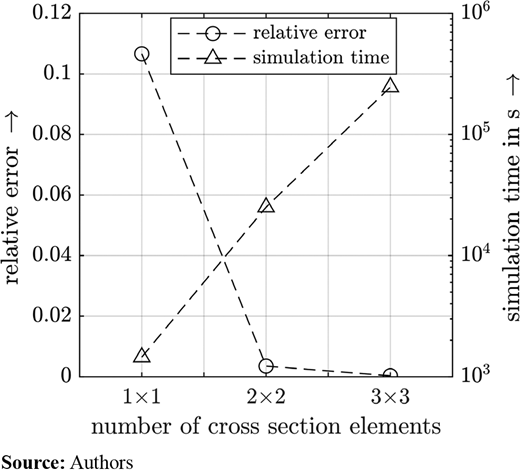
The transient thermo-mechanical simulation was performed with three different mesh sizes. These were paired with linear hexahedral elements in the thermal simulation and with quadratic hexahedral elements in the mechanical simulation. The element sizes were chosen for their ability to resolve the width and the height of each weld seam using one, two and three elements. The element sizes in the base plate were adapted to form a uniform mesh. Figure 5 shows the three investigated meshes side by side. For each mesh investigated, the height h(5,5) according to Figure 3 was determined after a simulated process time of 120 s using WS1, terminating after approximately one-fourth of the third weld seam in the first layer. The results of the study are given in Table 4. Figure 6 shows the relative errors and simulation times plotted against the mesh sizes. The relative error was referenced to the most detailed simulation with 3 × 3 elements in the cross-section (three elements in height-direction and three elements in width-direction) of the weld seam. The simulation using only one element in the cross-section (labeled 1 × 1) resulted in the highest relative error of 10.76%; however, it ran significantly faster than the other investigated options, completing in just 0.4 h. The simulations using 2 × 2 elements in the cross-section achieved a relative error of 0.49%, with a simulation time of 6.97 h. Refining the mesh even further with 3 × 3 elements increased the required simulation time significantly to 68.37 h. The relative difference in simulated deformation was marginal when comparing 2 × 2 to 3 × 3 elements, while the simulation time increased exponentially. Therefore, all subsequent simulations were performed using the 2 × 2 option.
3.3 Calibration and validation
The thermal model was calibrated and validated by comparing the simulation results with the experimental temperature measurements. The structural model was not calibrated in the same manner, as the structural simulation was solely dependent on the thermal simulation results and the given material properties.
Temperature measurements were collected using the experimental setup shown in Figure 1. One specimen from each welding sequence was prepared with four shallow drill holes at the corners to each tightly fit one thermocouple. An additional thermocouple was installed next to the fixed specimen on the clamping device to measure the rising base plate temperature during the WAAM process. To further improve the measurements, the thermocouple tips were covered with copper-based thermal paste before their installation.
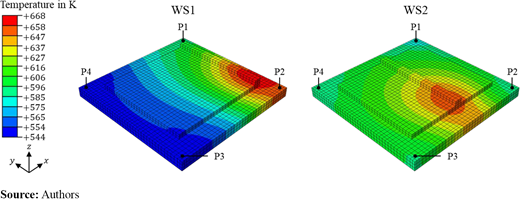
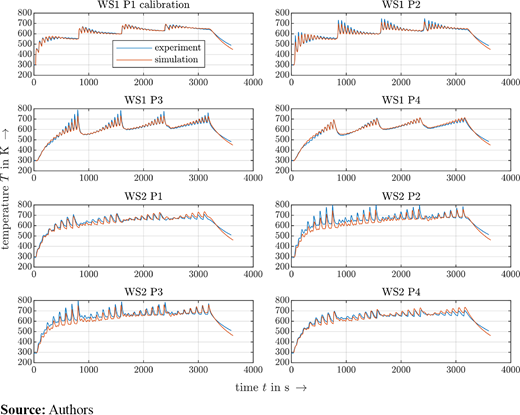
For the calibration process, the simulation was adapted to fit the thermal history at the calibration point P1 of WS1 to the results of the measurements at the same position. The primary calibration parameters were the efficiency of the Fronius CMT Puls Mix welding process in the first layer µPulsMix, the efficiency of the Fronius CMT welding process for the remaining layers µCMT, the thermal convection coefficient to air kair and the convection coefficient representing heat conduction into the clamping device kcontact. The calibrated simulation parameters are given in Table 5. The simulated temperature fields at a specific point in time are shown in Figure 7 for both welding sequences. A comparison of the temperature histories at the calibration points P1 to P4 for WS1 and WS2 is illustrated in Figure 8. The simulated thermal history was able to follow the temperature measurements in terms of both quality and quantity at all thermocouple positions. The calibrated model from the simulation of WS1 was subsequently used to calculate the thermal field of WS2. While the agreement between simulation and measurement was slightly less accurate than in the calibration data set, the simulation was well able to capture the characteristic trend and the peak temperatures of the thermal history.
4. Results and discussion
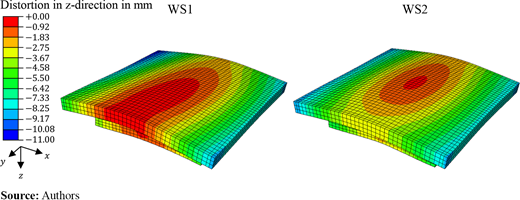
Using the calibrated model, transient thermo-mechanical simulations were performed for WS1 and WS2. The total simulation time needed for the thermal and structural simulations was 37.45 h for WS1 and 47.98 h for WS2. The calculated distortion fields at the end of the simulations are shown in Figure 9, where the difference in the qualitative distortion between WS1 and WS2 is clearly visible. WS2 led to an almost point-symmetrical distortion pattern to the center of the baseplate, whereas WS1 led to asymmetric bending in longitudinal and transverse directions.
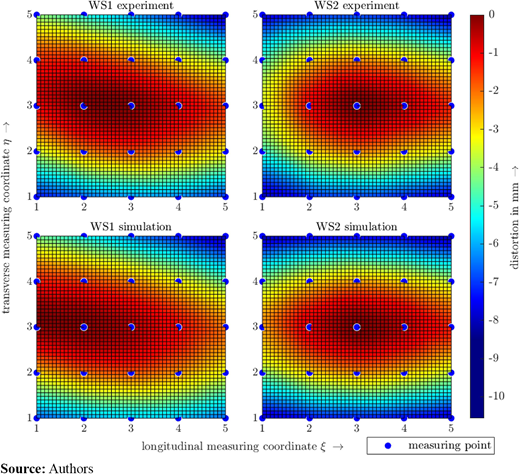
The simulated distortion patterns for WS1 and WS2 were in accordance with the experimental measurements. Figure 10 shows the simulated versus the measured average distortions of the welding sequences overlaid with the measuring positions defined in Figure 3. The values between the measuring points were fitted using quadratic interpolation. The model was able to predict the qualitative distortion pattern well for both welding sequences. Hence, the numerical setup has proven to be capable of correctly constituting the physical relations of the WAAM process.
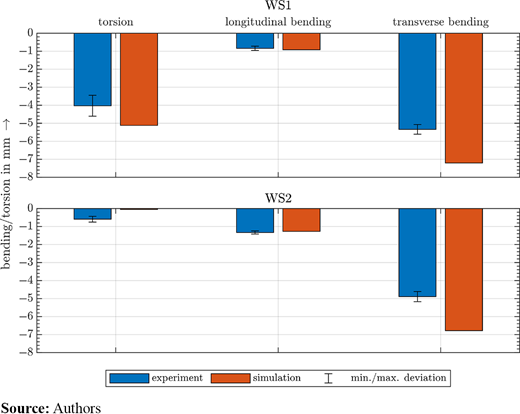
The experimental and simulative results of the investigation on longitudinal bending, transverse bending and torsion of the specimens’ substrate plate are shown in Figure 11. After examining each welding sequence individually, the transverse bending was significantly higher than the longitudinal bending in both cases. This observation was in line with the results obtained by Tian et al. (2014), where a similar distortion behavior was determined. Furthermore, small maxima and minima deviations in both welding sequences implied consistent experimental conditions as well as minor variations of the specimen material. Comparing the experimental results from WS1 and WS2, significant differences can be observed. While the average longitudinal bending for WS2 was higher than for WS1, the average transverse bending had an opposite relation. Longitudinal bending averaged −0.84 mm for WS1 and −1.33 mm for WS2, representing a 58.3% increase in distortion in the y-direction using WS2. Transverse bending averaged at −5.34 mm for WS1 and at −4.89 mm for WS2, exhibiting a decrease of 8.4% in bending when choosing WS2 over WS1. The critical disparity between WS1 and WS2 concerned torsion. While WS1 had an average torsion of −4.03 mm, that of WS2 was significantly smaller in comparison, with a mean value of just −0.59 mm. These observations can be explained in terms of the residual stress formation mechanism described by Radaj (1992) and Mercelis and Kruth (2006), which supports direct correlations between the thermal gradients in the process zone and the formation of stress. In WS1, the weld seams were successively placed next to each other in increasing η-direction (negative x-direction). This welding sequence introduced thermal energy into the specimen in a unilateral and asymmetric manner, causing a thermal gradient across the specimen. The thermal gradient is apparent in Figure 7, in which the color gradient across the part is more pronounced for WS1 than for WS2. This effect is also indicated in Figure 8, where the temperature curve for WS1 at P1 rises steeply during the first few weld seams of each layer, while the temperature curve at P4 increases more gradually. The thermal gradient across the plate translated to an asymmetric temperature distribution in the process zone during the welding of a seam, with higher average temperatures on the side adjacent to the previous seam and lower average temperatures beside the next seam. The difference in thermal gradients contributed to the asymmetric distortion in WS1. In WS2, the seams were deposited alternately from the center toward the edges of the specimens. Compared to WS1, the heat input in this welding sequence was, on average, more evenly distributed. The thermal histories at P1 and P4 of WS2 in Figure 8 are similar in shape and magnitude, signifying lower thermal gradients across the specimen and, thus, disfavoring the formation of torsion.
In addition to the heat input during welding, the material applied progressively onto the specimen gradually increases its resistance to bending. The asymmetric material deposition in WS1, which contrasts with the almost symmetric material deposition in WS2, caused temporary differences in the area moment of inertia along the x- and y-directions of a specimen during the welding of a layer. The increase in the specimen’s resistance to transverse bending began to develop at the center of the specimen in WS2, as opposed to its edge for WS1. Asymmetric shifts in the area moment of inertia favored unbalanced bending and constituted another contributing factor to the high torsion values of the WS1 specimens.
Comparing the experimental and simulative results in Figure 11, an overestimation of torsion and transverse bending can be observed in the simulation. This effect may be attributed either to the neglect of creep effects because of cyclic heating in the mechanical simulation or to the deviations in material properties between the simulated aluminum plates and those used in the experiments.
5. Conclusions and outlook
In this study, two welding sequences for a block-shaped WAAM part were investigated by experiment and simulation. Specimens manufactured using an asymmetric welding sequence (WS1) and a symmetric welding sequence (WS2) were compared both, with each other and with the calibrated simulation results. The findings satisfy the main objectives of the study, leading to the following conclusions:
Transverse bending was higher than longitudinal bending for both investigated welding sequences.
The asymmetric welding sequence resulted in significantly higher torsion than the symmetric welding sequence.
The symmetric welding sequences resulted in slightly higher longitudinal bending and slightly less transverse bending compared to the asymmetric welding sequence.
Using the developed model and the numerical setup, the simulation was able to predict the qualitative distortion for bending and torsion depending on the welding sequence.
The developed model could be used in the future to investigate and improve welding sequences for industrial WAAM parts. The process simulation can be coupled with an optimization algorithm to determine the optimal welding sequences before manufacturing. To further improve accuracy, the effects of phase transformation and material creep could be considered in the simulation.
The author thank the German Federal Ministry for Economic Affairs and Climate Action (BMWK) for funding the research project AdDEDValue with the grant number 13IK002L and we thank the VDI Technology Center (VDI TZ) for the supervision of this project. Furthermore, we thank Mergim Zulfaj for his support in the WAAM experiments.