


The purpose of this paper is to communicate a method to perform simultaneous topology optimization of component and support structures considering typical metal additive manufacturing (AM) restrictions and post-print machining requirements.
An integrated topology optimization is proposed using two density fields: one describing the design and another defining the support layout. Using a simplified AM process model, critical overhang angle restrictions are imposed on the design. Through additional load cases and constraints, sufficient stiffness against subtractive machining loads is enforced. In addition, a way to handle non-design regions in an AM setting is introduced.
The proposed approach is found to be effective in producing printable optimized geometries with adequate stiffness against machining loads. It is shown that post-machining requirements can affect optimal support structure layout.
This study uses a simplified AM process model based on geometrical characteristics. A challenge remains to integrate more detailed physical AM process models to have direct control of stress, distortion and overheating.
The presented method can accelerate and enhance the design of high performance parts for AM. The consideration of post-print aspects is expected to reduce the need for design adjustments after optimization.
The developed method is the first to combine AM printability and machining loads in a single topology optimization process. The formulation is general and can be applied to a wide range of performance and manufacturability requirements.
1. Introduction
Additive manufacturing (AM) technologies are rapidly advancing and being adopted in a wide variety of industries. Through AM, designers are no longer restricted by traditional fabrication constraints, and a clear need arises for design tools that help to fully exploit this new design freedom (Rosen, 2014; Thompson et al., 2016). Topology optimization shares the characteristic of an enormous design freedom with AM processes, and it is universally recognized as an ideal design approach for AM. However, classical topology optimization formulations do not consider specific restrictions of typical AM processes. From a design-for-manufacturing viewpoint, ideally all restrictions of the manufacturing process are already included at the design stage (Gibson et al., 2015). One important restriction common to many AM processes is the maximum overhang angle of downward-facing surfaces of a component. Surfaces that violate this restriction need to be supported by sacrificial support material. This adds costs in terms of material consumption, increases build time and adds labor costs for the support removal process. Taking these extra process-related costs into consideration in an early design phase is therefore desired (Guessasma et al., 2015).
Furthermore, support structures are also added for reasons other than overhang angle violations. In this paper, next to the overhang aspect, we focus specifically on the role of supports in post-build subtractive operations. This particularly targets powderbed-based metal AM [e.g. selective laser melting (SLM), selective laser sintering (SLS)], which are presently used for most printed metal end-use parts. The tolerances and surface quality obtained with current metal AM processes often require subsequent machining operations (e.g. drilling, threading, milling) (Gardan, 2016). Commonly, this is done before release, with the component connected to the base plate, as this conveniently avoids additional mounting or clamping considerations (Hamilton, 2016). In this setting, the support structures must provide sufficient fixation and stiffness to enable accurate machining operations. We assume that the component orientation is predefined.
Including overhang restrictions and post-print machining requirements in topology optimization for AM has not been considered before. The previous studies have focused on minimizing support-related costs for a given component geometry, by optimizing its orientation (Ahn et al., 2007; Morgan et al., 2016; Das et al., 2017) and by optimizing the support material layout itself (Vanek et al., 2014; Kuo et al., 2017). These approaches do not consider the possibility of modifying the component design to reduce its support requirements, which limits the achievable cost reduction.
To overcome this, we recently proposed a topology optimization formulation including a simplified layer-by-layer manufacturing process model (Langelaar, 2016b, 2017). This formulation generates fully self-supporting parts for a given build orientation, i.e. parts free from surfaces violating the critical angle. As a result, the optimized part can be produced without the need to add any support material to meet the overhang criterion. Using different formulations, other researchers have proposed similar procedures (Gaynor and Guest, 2016; Van de Ven et al., 2017; Guo et al., 2017).
Focusing exclusively on fully self-supporting designs however strongly restricts the design space, and this can result in decreased performance. To allow for trade-off solutions that balance performance and costs, we have developed an extended formulation that allowed introduction of a suitable amount of support material (Langelaar, 2016a). In this present contribution, building on that formulation we propose an integrated component-support design-for-AM topology optimization procedure with consideration of machining forces.
Based on the AM filter, summarized in Section 2, we computationally form the as-built structure consisting of part and supports during the optimization process and evaluate its stiffness in the defined machining load cases. By adding corresponding compliance constraints to the topology optimization problem, both component and support layout can be optimized simultaneously while meeting the demands of critical overhang angles as well as machining-related criteria. The objective of the optimization process is a weighted combination of part performance in a defined service load case and support costs. The full optimization problem and the associated solution procedure is discussed in Section 3. Numerical results on a test case and an application example are presented in Section 4, and followed by discussion and conclusion in Section 5.
2. Formulation
In this section, the three ingredients needed to define the optimization problem are described. Section 2.1 summarizes a filter-based AM process model used in this study, Section 2.2 discusses the extension to parts with support structures, and Section 2.3 introduces the applied cost model.
2.1 Simplified additive manufacturing process model
To distinguish printable regions of a part from unprintable ones, we use the critical overhang angle restriction imposed on downward-facing surfaces of a part. Typical values of critical angles for metal AM are around 45° (Wang et al., 2013; Mertens et al., 2014; Kranz et al., 2015). To implement this restriction in density-based topology optimization, we use the so-called AM filter introduced in Langelaar (2016b, 2017). It is defined on a regular finite element (FE) mesh, as commonly used in topology optimization for performance evaluation, with element layers stacked in the printing direction. Figure 1 shows a section of a mesh, with an element at position indices (i, j, k) and a support region S(i,j,k) underneath. The printability condition is simple: if sufficient printed material exists in the support region, the element on top can be printed as well. In line with the density method for topology optimization, we also allow elements to be partially printed, e.g. up to a certain density corresponding to the maximum density underneath.
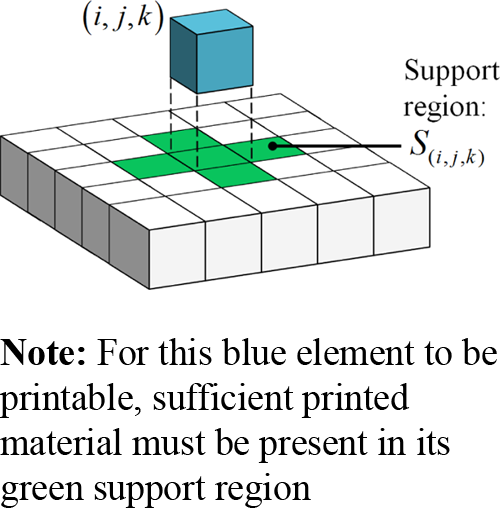
Definition of the support region S(i,j,k) underneath an element at position (i, j, k)
Definition of the support region S(i,j,k) underneath an element at position (i, j, k)
The AM filter takes a blueprint density field b as input, and by applying the printability condition in a layer wise fashion from base plate to top (k = 1…n), it creates a printed density field p. The condition can be written as follows:
The nonsmoothed minimum and maximum operators are replaced by differentiable counterparts and , for details the reader is referred to Langelaar (2016b, 2017). In combination with the regular grid, this simple process model results in self-supporting density distributions, as presented in full detail in our earlier work. Note that the method can also be extended to arbitrary unstructured meshes, as demonstrated by Hoffarth et al. (2017).
2.2 Distinguishing component and support
To distinguish the component to which the in-service load cases apply, the amount of support material, and the as-printed structure that is subjected to subtractive machining loads, the formulation given in the previous section must be extended. We introduce two design variable fields, namely, design field d and support field s, as illustrated in Figure 2(a). The union of these two fields gives blueprint field b mentioned previously. After application of the AM filter, printed field p is obtained [Figure 2(c)], which contains printed support material as well. To extract component field c, the printed part is intersected with design field d as shown in Figure 2(d). To allow sensitivity analysis, the nonsmooth union and intersection operators are implemented by differentiable elementwise max and min operators, respectively.
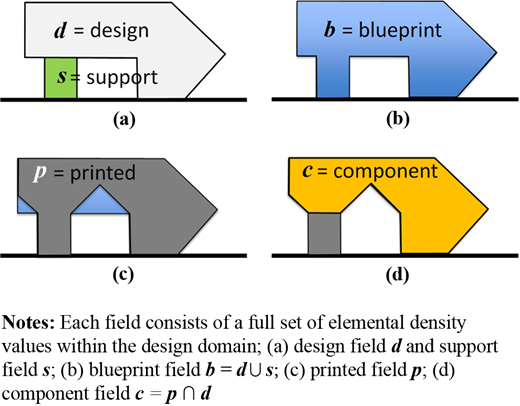
A length scale is introduced to both the design and support field, using the classical density filtering approach (Bruns and Tortorelli, 2001) and the implications of this operation are consistently included in all sensitivity calculations following the chain rule.
2.3 Support cost model
Extensive studies have been made to define accurate cost models for AM products (Atzeni and Salmi, 2012; Rickenbacher et al., 2013). For the purpose of this research, to present a formulation that allows integrated optimization of component and support layout under printability, machining and service load requirements, we opt to use a relatively simple support cost model instead. More elaborate models can be handled also, provided that design sensitivities can be derived.
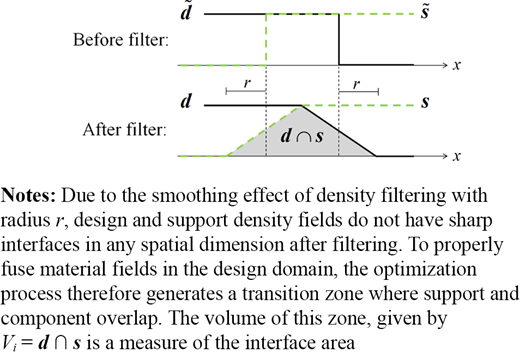
We consider two cost contributions, namely, support material costs and support removal costs. The material costs are defined to be proportional to support volume. The support removal costs are assumed to scale with the amount of interface between component and support. This final measure is evaluated by taking the (smooth) intersection between the density-filtered s and d fields, which were found to overlap slightly to ensure printability with the AM filter. This is illustrated in Figure 3. The smooth intersection is implemented as an element-wise smooth minimum (Langelaar, 2017). No provisions are included here for accessibility of component-support interfaces, this is an aspect to be considered in future research.
3. Optimization problem
3.1 Problem definition
The integrated topology optimization of component and support, considering post-print machining and service loads is given by a weighted-sum multi objective problem as follows:
Here, f denotes the component performance indicator to be optimized, cs and cr are cost factors related to the amount of support material and removal costs, respectively, and gi and gj are sets of constraints imposed on the printed part (including supports) and the component, respectively. The number of constraints, when present, is given by m and M. Vs and Vi denote the volume of support material and support-component interface regions, relative to the design domain.
By adequately setting support cost factors cs and cr relative to performance f, different trade-off designs can be generated. The high cost factors promote largely fully printable geometries with minimal to no support material, but as this may require deviations of the component geometry from its optimal shape, its performance typically reduces (Langelaar, 2016b). Moderate values of the cost factors result in rational trade-off designs with less reduction of ultimate performance due to AM restrictions. With these guidelines, practitioners can generate trade-off solutions through the choice of cost factors to include case- and technology-dependent considerations.
In the numerical examples that follow in Section 4, for simplicity in-service, compliance will be used as objective f, evaluated by linear FE analysis. A maximum compliance constraint is applied to the printed part under machining load fm as follows:
This ensures a maximum workpiece compliance Cmax (i.e. minimum stiffness), to guarantee certain desired tolerances on the finished component after machining. A single machining point load Fm yields Cmax = Fm · umax, where umax denotes the admissible workpiece displacement. In principle equation (2) can also be extended with stress constraints to ensure sufficient strength next to sufficient stiffness (Verbart et al., 2017). Furthermore, a component volume constraint g2(c) is applied, and prescribed component density values are enforced by a third constraint as follows:
where the index k runs over all elements where component densities are prescribed, and ρk denotes the imposed value (typically 0 or 1). Prescribed non-design component regions cannot be implemented directly, as the field c is not directly controlled by the optimizer. When directly imposing the ck densities during optimization their printability is not guaranteed. By adding constraint g3, this problem is resolved, as the optimization process will create designs with the appropriate printable density fields to satisfy the constraint. Compliance responses, volume constraints and the corresponding sensitivity analysis are well documented in topology optimization, for additional detail the reader is referred to Bendsøe and Sigmund (2003).
3.2 Sensitivity analysis aspects
Efficient computation of design sensitivities is essential to allow gradient-based optimization of the problem defined in equation (2). Here we focus the discussion on the novel aspects of the formulation, i.e. the implications of the multi-field setting described in Section 2.2 and the term introduced in equation (4) to enforce the non-design component density values.
As discussed in Section 2.2, the component density field c is obtained by combining design field d with printed density field p, which itself results from blueprint field b, in turn composed of design field d and support field s:
When computing sensitivities of component-based objective or constraint quantities (f(c),gi(c)), this chain of dependencies must be taken into account. Using the chain rule of differentiation it follows that:
Similarly, printed-density-based responses gi(p) related to machining loads result in the following sensitivity expressions:
The Jacobian ∂p/∂b is never formed in practice, as it not sparse (each blueprint density affects all elements in a 45°-cone above). Instead, the product ∂□/∂b∂p/∂b is evaluated as described in Appendix 1, by a layer-by-layer operation of low computational complexity. The other Jacobians in the chain rule products are diagonal matrices, resulting in fast calculations.
Regarding the enforcement of non-design component density values, constraint g3 defined in equation (4) yields the following sensitivity terms with respect to c:
with contributions from all the defined non-design elements. Sensitivities with respect to d and s subsequently follow from equations (6) and (7).
3.3 Solution procedure
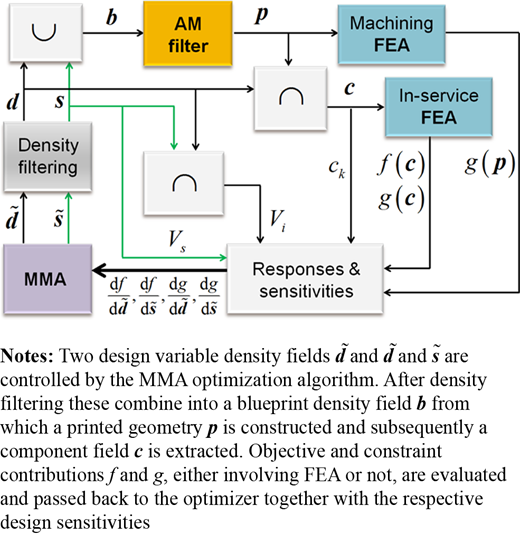
Figure 4 depicts a graphical representation of the entire topology optimization process, showing the most important components. To solve the optimization problem defined in equation (2), the method of moving asymptotes (Svanberg, 1987) is used with default settings, apart from a reduced initial asymptote range of 0.1 instead of 0.5 to start the process cautiously. To provide properly scaled inputs for MMA, the compliance objective is normalized to 10.0 at the start of the optimization process. Domains are discretized using standard eight-node hexahedral elements with equal edge lengths h, and the optimization process is initialized with design densities set to the allowed volume fraction and support densities set to 1.0 everywhere. The optimization process is terminated when relative changes in objective value have dropped below 10−6 under strict feasibility or when a certain maximum number of iterations has been reached. Values of the material and problem parameters used in the examples are listed in Appendix 2.
4. Numerical examples
4.1 Test case
The proposed method is first demonstrated using a simplified test problem to verify the influence of printability and machining accuracy requirements on the component and part geometries generated by the optimization process. Also the new constraint-based way of including non-design component features is verified.
4.1.1 Design problem.
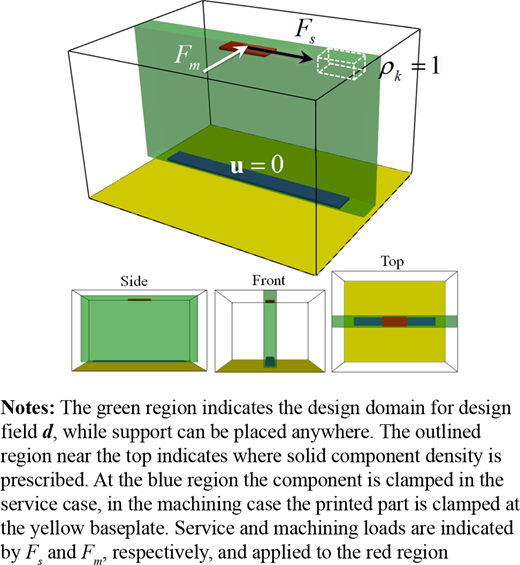
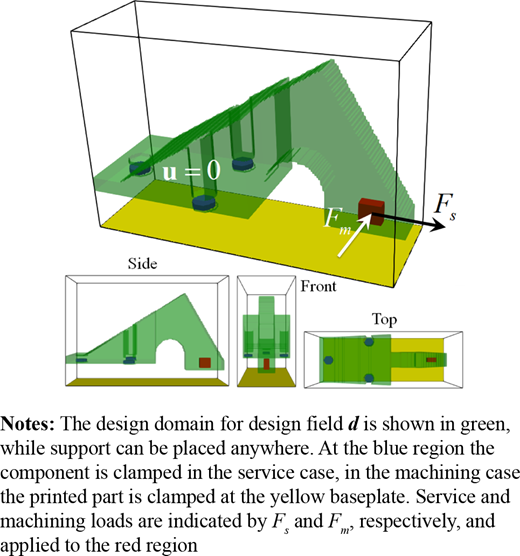
Figure 5 depicts the considered test problem layout. The component design domain is restricted to the green slab, which also is placed at an offset from the yellow baseplate to facilitate removal. The service load is defined parallel to the slab, while the machining load acts perpendicular to it. This unfavorable loading direction is chosen deliberately to create a situation where the optimization process needs to place additional support to achieve the required stiffness under machining. For the nominal machining tolerance, we have used umax = 10 µm, and also lower and higher accuracy cases are considered. A small region of non-design solid material (dashed box in Figure 5) is defined for testing purposes in a position where normally no material would be generated. Appendix Table AII provides an overview of all numerical parameters related to this problem.
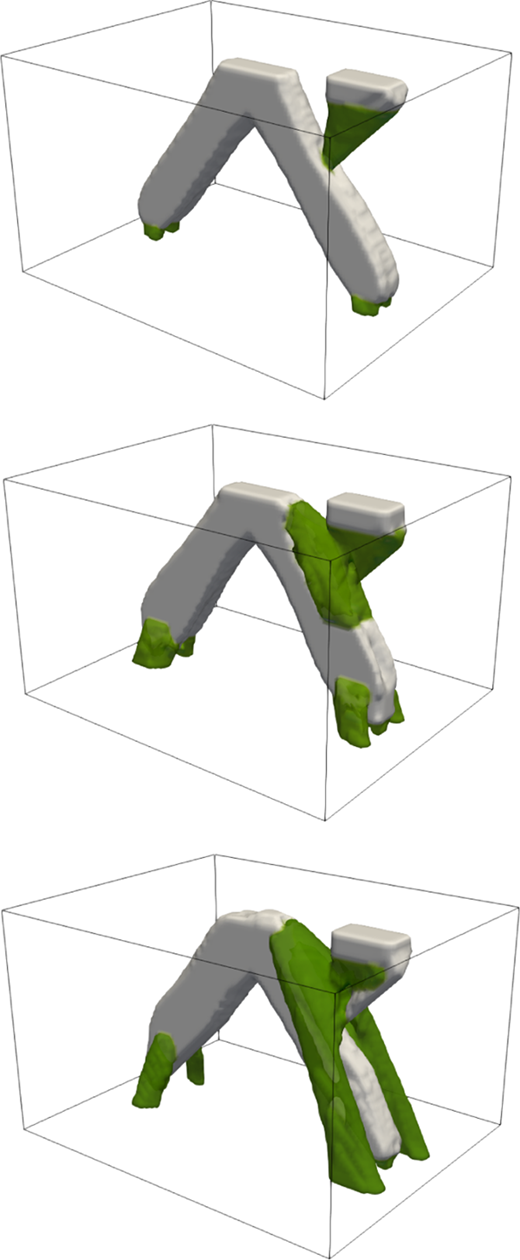
Topology optimized component (white) and support layouts (green) for the test problem, with machining accuracy umax set to 25 µm (top), 10 and 2.5 µm.
Topology optimized component (white) and support layouts (green) for the test problem, with machining accuracy umax set to 25 µm (top), 10 and 2.5 µm.
4.1.2 Optimization results.
Due to the use of density filtering, the optimized results contain a thin layer of intermediate density near the structural boundary. To visualize the obtained designs, an isosurface of density fields is constructed using Paraview software. Figure 6 shows the results for three different machining accuracy levels. The top image depicts the design for the lowest accuracy requirement (25 µm). The component geometry together with its essential supports to connect to the base plate and accommodate overhang requirements is sufficiently stiff to withstand the machining load, and no additional structures are generated. As expected and verified by the other two cases, stricter umax requirements lead to the addition of more support material to stiffen the printed part and attach it more firmly to the base plate.
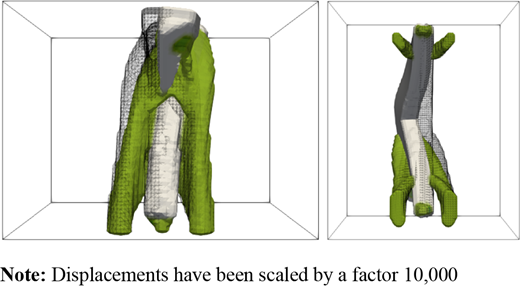
Deformation under machining load of the stiffest case, viewed from the front and below
Deformation under machining load of the stiffest case, viewed from the front and below
Note also that the prescribed block of component material is present in all results (in white). This material does not contribute to the service load objective nor to the stiffness under machining loads, and it is only present because it was specified as a non-design solid area [see Figure 5, equation (4)]. Support material has been placed by the optimization process to render this block printable, as intended.
Figure 7 illustrates the deformation occurring under the machining load for the stiffest case, where umax = 2.5 µm. Note that the load is applied symmetrically at the center of the top section. Still an asymmetric design has developed, as because of the non-design block extra support (thus stiffness) is present on one side of the part. Additional supports are generated primarily on that side of the domain.
Key numerical characteristics of the three optimizations are listed in Table I: compliance C, support material cost csV s, support removal cost crVi and the sum of these, forming the total objective as defined in equation (2). All values have been normalized with respect to the compliance found in the least stringent machining case, umax = 25 µm. As one would expect, placing stricter accuracy demands for machining results in rising support costs (both material volume and removal). This in turn leads to a shift in the trade-off between component performance and cost, as compliance shows a moderate rise (i.e. worsening) with increasing machining accuracy demands. Table I also lists the stress ratio, i.e. the maximum stress observed in the structure under machining, normalized by the allowable stress ( Appendix 2). For all cases, the maximum stress values are found in support regions, but magnitudes are insignificant. The additional support material present in higher accuracy cases leads to lower stress levels.
Breakdown of objective contributions normalized to the compliance value of the 25 µm case, and normalized maximum stresses, for the three considered machining accuracy levels
| umax | 25 µm (%) | 10 µm (%) | 2.5 µm (%) |
|---|---|---|---|
| Compliance | 100 | 109 | 116 |
| Support material cost | 36 | 131 | 265 |
| Support removal cost | 98 | 172 | 183 |
| Total objective | 235 | 411 | 564 |
| Stress ratio | 4.8 | 1.7 | 0.6 |
The results of this test problem verify that the proposed procedure is able to optimize component and support layouts simultaneously, that non-design component regions can be implemented in a manner that ensures printability, and that conditions such as stiffness under machining loads can be effectively imposed on the printed part.
4.2 Application case
The second case we consider is inspired by an air brake component used previously in the study by Hamilton (2016). Our intent is not to perform an exact engineering study but to demonstrate the feasibility of applying integrated component and support optimization including machining accuracy considerations on a problem of relevant complexity.
4.2.1 Design problem
The problem definition is visualized in Figure 8. The shape of the green component design domain includes an arch-like section that unavoidably introduces overhanging regions. Moreover, the component domain is placed at a considerable offset from the yellow baseplate, for ease of removal and moreover to provide sufficient clearance for tool access (Hamilton, 2016). Solid component densities are prescribed at the three attachment pads shown in blue in Figure 8.
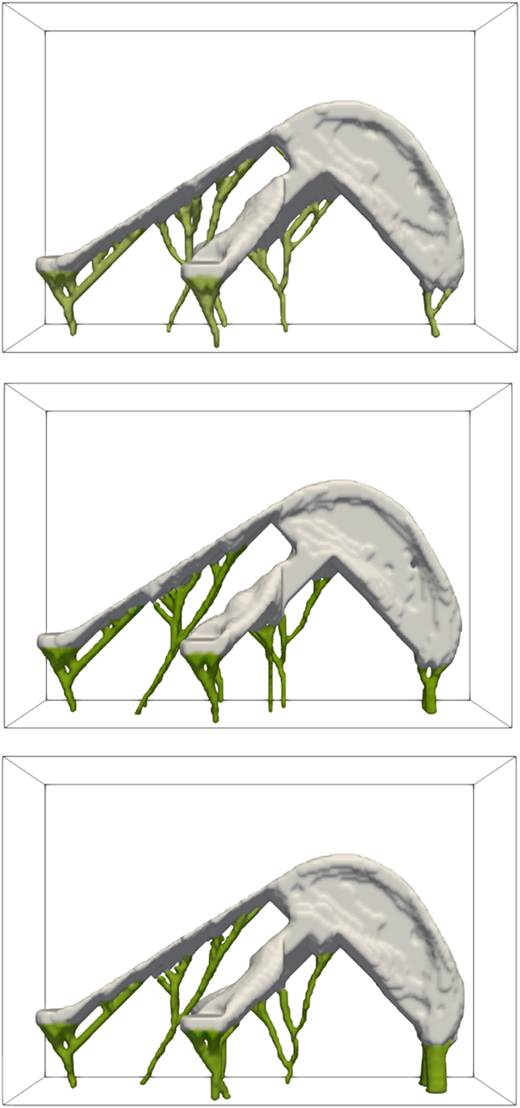
Topology optimized component (white) and support layouts (green) for the application case, with machining accuracy umax set to 100 (top), 10 and 1.0 µm
Topology optimized component (white) and support layouts (green) for the application case, with machining accuracy umax set to 100 (top), 10 and 1.0 µm
The actual part features several holes that require drilling, but regarding workpiece stiffness, the machining load indicated by Fm is the most critical. As in the previous test example, the component is going to be relatively flexible at this position because of the shape of the domain. This will trigger the optimization process to use support material not only to ensure printability of overhanging parts but also to provide the necessary stiffness under machining.
As in the test case, the nominal machining tolerance is set to umax = 10 µm, and again lower and higher accuracies are considered. Problem parameters are given in Appendix Table AIII.
4.2.2 Optimization results
The designs obtained for the three different tolerance levels considered are shown in Figure 9 and Figure 10. They show a high degree of similarity, and globally resemble the design reported by Hamilton (2016), where supports were added manually to a separately topology optimized part. Differences can be observed in the support structures generated near the front, where reinforcements are required to withstand the drilling forces. Note that all obtained combinations of component and support structures satisfy the imposed 45° overhang angle limit through the use of the AM filter, which yields full printability with e.g. an SLM process in this regard.
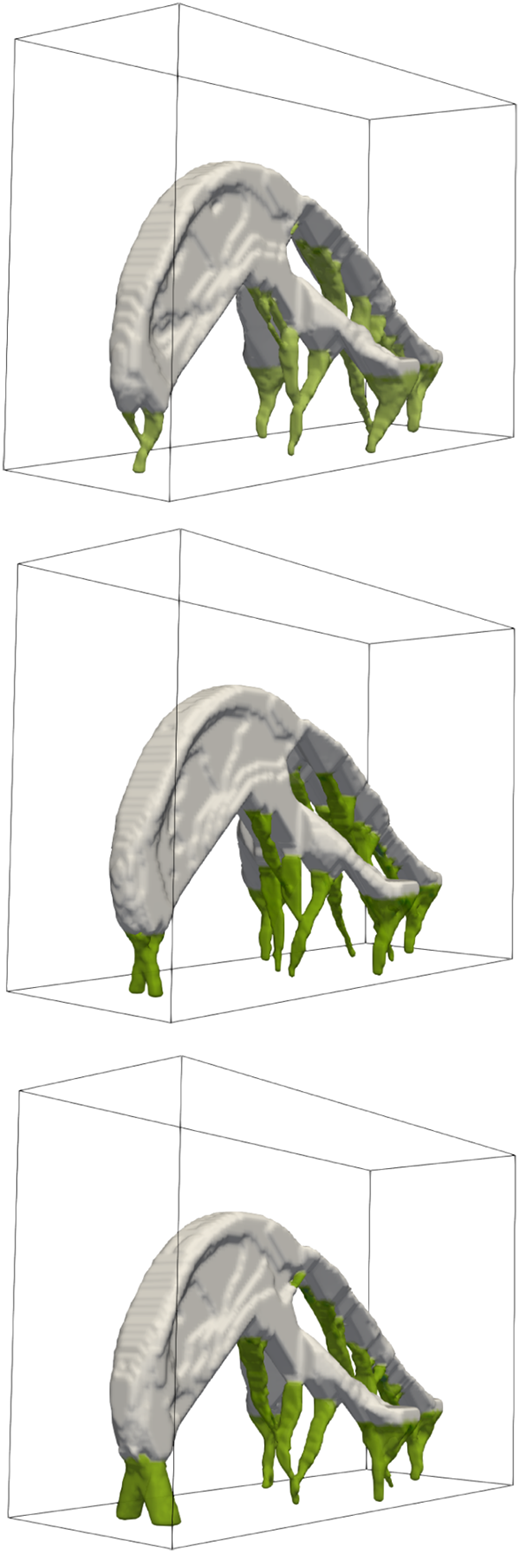
Topology optimized component (white) and support layouts (green) for the application case, with machining accuracy umax set to 100 (top), 10 and 1.0 µm
Topology optimized component (white) and support layouts (green) for the application case, with machining accuracy umax set to 100 (top), 10 and 1.0 µm
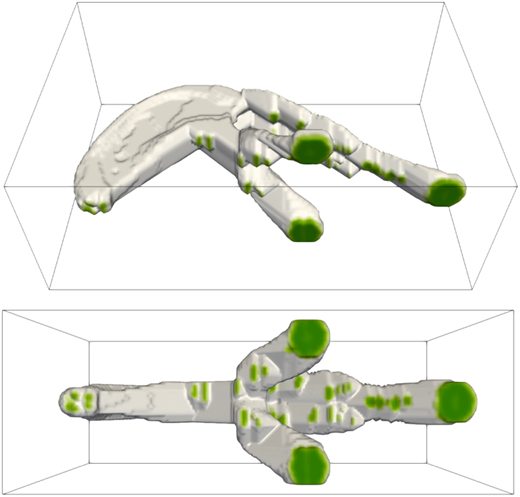
Component with supports removed, showing support attachment points (green), for umax = 10 µm
Component with supports removed, showing support attachment points (green), for umax = 10 µm
As expected, the cases with smaller machining tolerances show bulkier supports in that region. For the 10 and 1.0 µm cases, the support under the front forms an inverted V-shape (best seen in Figure 10), which resembles the result obtained in the test problem discussed above. The service load in the test problem corresponds closely to the drilling load the additional support structures help to withstand.
It is of interest to observe how the support cost optimization results in support structures that start at the baseplate as single struts and at certain points branch out in different directions to support different areas of the component. In this way, less support material is used compared to conventional vertical pillars, as used extensively in the case study of Hamilton (2016). While this illustrates that the integrated optimization of component and support topologies is effective, it is also noted that support structures may also have other functions that have not been included in this optimization. This point is elaborated in the discussion section below.
Evidence of component adaptation to minimize support-related costs can be seen in the component images in Figure 11, where the support structures have been removed but attachment points are indicated by color. To minimize removal cost, the optimization process has adapted the component shape such that only a limited number of points is critically overhanging. To these points, the support structures attach. The somewhat irregular-looking shapes near attachment points are introduced because of the 45° critical overhang angle. Note also that the three attachment pads (indicated in blue in Figure 8), which were defined as non-design regions, by definition have flat, fully overhanging bottom surfaces. Here, no design adaptation was possible, and a large support contact region is unavoidable.
The numerical optimization data collected in Table II reveals some differences to the test case (Table I). Stress levels are higher for this problem, but still well within acceptable limits. All maximum values occur in the support under the drilling location, and similar to the test case, stress levels decrease with increasing accuracy demands due to the added support material. The support costs (both material volume and removal) are comparatively constant here, which is likely caused by the larger amount of support and support-component interfaces needed to render this component printable. The additional support introduced to meet the machining requirements is all concentrated in a small area near the front and has a smaller impact on the total support contribution than in the more sensitive test problem. It is also notable that the total objective value does not increase (i.e. worsen) monotonically with increasing accuracy demands. The compliance of the 100 µm case, which was expected to be the lowest, is in fact the highest of all three cases. This also results in a relatively high total objective. From this it can be inferred that for the 100 µm case, the optimization process has found an inferior local optimum, which is not unexpected given the nonconvex and high-dimensional nature of topology optimization problems in general. By changing the starting density distribution, typically different locally optimal designs can be obtained. Remarkably, at least in this case, the more demanding machining constraints have helped the process to find better-performing designs.
Breakdown of objective contributions normalized to the compliance value of the 100 µm case, and normalized maximum stresses, for the three considered machining accuracy levels
| umax | 100 µm (%) | 10 µm (%) | 1 µm (%) |
|---|---|---|---|
| Compliance | 100 | 80 | 93 |
| Support material cost | 50 | 53 | 59 |
| Support removal cost | 132 | 131 | 132 |
| Total objective | 282 | 263 | 284 |
| Stress ratio | 63 | 9.3 | 1.7 |
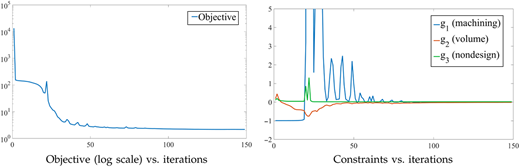
A typical convergence history is shown in Figure 12, which depicts the objective and straint evolution of the 10 m case. Runtime was 3.5 h on an 18-core server. The machining constraint shows the strongest fluctuations, due to the complex nonlinear relations between design field, support field and performance of the printed geometry. Nonetheless, after an initial stage of about 50 iterations with stronger design adaptations, the process settles and converges.
4.3 Discussion
The proposed method proves effective, but it might be argued that a similar solution could be reached in a sequential process: first perform component and support optimization without machining considerations and subsequently, add support material (possibly by a second topology optimization) to meet the machining accuracy. Indeed, especially in the application case the location and shape of the reinforcement is quite predictable, and varying the required accuracy level did not significantly affect other parts of the design. This may however not be the case in general.
Moreover, an important argument for an integrated approach is that all supports are taken into account in a single optimization-based trade-off solution. In a sequential approach, a design may emerge from the first stage that meets the printability criteria but that is highly unfavorable regarding machining considerations. Thus, the second stage would add a significant amount of support material, resulting in inferior design solutions. As the stiffness in the machining setting is directly related to the component and support layout, the optimization problem is not separable and an integrated approach is needed. We expect that this especially becomes crucial when components are very flexible, e.g. when printing compliant mechanisms.
Furthermore, the cost factors that balance component performance against support cost in equation (2) have (and should have) an influence on results. To characterize this influence is not the focus of this paper, a numerical study of their effect has been presented previously (Langelaar, 2016a). Ultimately, it is up to the designer to decide the appropriate balance between performance and cost in a given situation.
A possible extension of this work could be to use different effective material properties for support structures and component. Support structures may consist of lattices or have higher porosity and this could be accounted for in the optimization model. Also, as discussed earlier, extensions and refinements can be applied to the cost model as well as to the definition of machining loads, and the accessibility of supports could be reflected in the removal cost. Also the strength of supports, as well as their connection to the base plate, could be a relevant extension. Minimization of support material is likely to produce sparse, slender structures with relatively small contact regions at the base plate. In all presented cases, stress levels proved acceptable, but for other applications support strength could become critical. As discussed in Section 3.1, to control this, stress constraints can be included in the formulation.
Finally, support material also serves other purposes next to eliminating critical overhangs and providing sufficient stiffness for post-print machining. Examples are locally improving heat conduction or limiting part distortion. These functions of supports are not considered in this research, and this presents a clear goal for future work. Given appropriate models, they could in principle be similarly included in the topology optimization as additional constraints on the as-printed part [equation (2), gi(p)]. Realizing a practical form of such an approach however presents a considerable challenge, as the required physical process simulations are computationally demanding.
5. Concluding remarks
From the work presented in this paper, two conclusions can be drawn. First, the proposed method is capable to perform integrated component-support topology optimization including AM overhang restrictions and post-machining considerations, as demonstrated in the numerical studies. Second, generally the expectation was confirmed that demanding higher machining accuracy leads to increased support material usage. For this reason, it is important to include post-machining criteria in the optimization when considering performance versus cost trade-off solutions. A challenge for the future is to find computationally tractable ways to include even more physics-based AM process information into the design optimization.
The author thanks Krister Svanberg for providing the implementation of his method of moving asymptotes.
References
Appendix 1. AM filter sensitivity analysis
The sensitivity analysis computation of the AM filter is summarized here. For the full derivation, the reader is referred to Langelaar (2017). Consider the AM filter operation p(b). For a sensitivity field ∂f/∂p, the sensitivity with respect to blueprint densities b is obtained by:
with n the number of layers and . Derivatives of and follow directly from their definitions, see Langelaar (2017). These sensitivity equations can be evaluated by sweeping backwards through the domain, from the top layer down to the base plate and are computationally inexpensive.
Appendix 2. Parameter settings
The settings listed in Table AI were applied in all numerical examples. Settings specific to the test case (Section 4.1) and the application case (Section 4.2) are given in Table AII and Table AIII, respectively.

