


Particles bed binding by selective cement activation (SCA) method is a computer-aided manufacturing (CAM) technique used to produce cementitious elements. A computer-aided design file is sliced to generate G-codes before printing. This paper aims to study the effect of key input parameters for slicer software on the final properties of printed products.
The one factor at a time (OFAT) methodology is used to investigate the impact of selected parameters on the final properties of printed specimens, and the causes for the variations in outcomes of each variable are discussed.
Finer aggregates can generate a more compact layer, resulting in a denser product with higher strength. Fluid pressure is directly determined by voxel rate (rV); however, high pressures enable better fluid penetration control for fortified products; for extreme rVs, residual voids in the interfaces between successive layers and single-line primitives impair mechanical strength. It was understood that printhead movement along the orientation of the parts in the powder bed improved the mechanical properties.
The design of experiment (DOE) method assesses the influence of process parameters on various input printing variables at the same time. As the resources are limited, a fractional factorial plan is carried out on a subset of a full factorial design; hence, providing physical interpretation behind changes in each factor is difficult. OFAT aids in analyzing the effect of a change in one factor on output while all other parameters are kept constant. The results assist engineers in properly considering the influence of variable variations for future DOE designs.
1. Introduction
Binder jetting (BJ) is one of the most flexible powder-based three-dimensional (3D) printing technologies to digitalize the construction industry by printing pre-cast cementitious elements (Oesterreich and Teuteberg, 2016; Salet and Wolfs, 2016). Using cementitious materials, selective cement activation (SCA) and selective paste intrusion are two recognized methods in BJ (Buswell et al., 2020; Lowke et al., 2020). SCA method includes two successive steps: deposition of the feedstock powder materials onto the building chamber according to the thickness for each layer, and the selective application of binder from the printhead at desired points (Lowke et al., 2020; Mai et al., 2022; Mostafaei et al., 2020; Shakor et al., 2022). Magnesia-based cements are widespread cementitious materials used in SCA, related to their quicker setting time with respect to Portland cement and geopolymer-based materials (Cesaretti et al., 2014; Gobbin et al., 2021; Lowke et al., 2018; Nematollahi et al., 2020; Sinka et al., 2020).
BJ technologies follow computer-aided design (CAD) and computer-aided manufacturing (CAM) procedures to create 3D objects (Essien et al., 2015; Gibson et al., 2021; Wong and Hernandez, 2012). SCA is a voxel-based fabrication method where material and machine are correlated to each other in the voxel concept, corresponding to the primitive unit. Voxels in SCA process can be determined by multiplying layer thickness (Z-direction), hatch distance (Y-direction) and velocity of printhead or feed rate (FR; X-direction); therefore, the “rate of voxel” (rV) is a practical concept to be substituted for voxel term in this technology (Wagner et al., 2021). The movement of the printhead over the powder bed deposits multiple droplets, and the merging of consolidated rV result in a single-line primitive (Bredt, 1997; Wagner et al., 2021). Coalescence of single-line primitives forms the cross-section of the designed part. At last, inter-layer bonds between successive strata ends with the hardened final body (Wagner et al., 2021).
The slicer software is used to place designed 3D objects (CAD files) in the build chamber (print box) (Del Giudice and Vassiliou, 2020; Shakor et al., 2022). The total volume of the building chamber meshes in a bitwise manner and voxels that are occupied by solid parts are required to be consolidated by activation solution (Del Giudice and Vassiliou, 2020). The G-code for the numerical control machine, or 3D printer, is generated by the slicer software (Longhitano et al., 2019). A G-code contains commands for the two printing steps including the velocity of powder spread, tool path (infill pattern), printing speed (FR) and the flow rate (Alkadi et al., 2020; Bikas et al., 2019; Gibson et al., 2021). Prior to the printing job, the slicer software must determine parameters related to the printing strategies. The rate of voxel (rV) is the first parameter. Placement of parts in the powder bed is another decision to determine the raster angle and build direction. Raster angle, also referred to as printing direction (PD), is the angle between the printhead’s trajectory and the X-direction of the building platform (Shakor et al., 2021; Wu et al., 2017). The material selection is not a parameter for the slicer, but the powder bed density is required to be determined in order to calculate the flow rate (Salari et al., 2022). Eventually, based on the inputs mentioned above, the necessary commands for the 3D printer are generated.
The quality of concrete commonly is evaluated by its mechanical strength. In traditional concrete manufacturing, mechanical properties are affected by cement type, water/cement ratio, aggregate/cement ratio, curing, properties of aggregate, compaction of concrete and use of mixtures (Lowke et al., 2020; Nevile, 1998; Xia et al., 2018). There are equivalent parameters in concrete 3D printing necessary to be contemplated for developing the process and product quality.
Shakor et al. (2017, 2020a, 2020b), Xia et al. (2018, 2019) and Lowke et al. (2020) studied the effect of saturation level on the compression strength of printed parts. By increasing the saturation level, compression strength increased, but linear dimensional accuracy decreased on a Zprinter® 150 equipped with a thermal drop-on-demand printhead. An anisotropic behavior was observed for both mechanical strength and shape accuracy. A prototype particle bed printer developed by Lowke et al. (2018, 2020), Mai et al. (2022) that spread powder with a roller system and dispensed activator solution with a pressure vessel. Water jet pressure, cellulose dose and w/c ratio were examined for their effects on flexural and compression strength, and specimens with strength of 15.5 MPa could be fabricated without curing. As the w/c-ratio and aggregate particle size increased, so did the strength, but shape accuracy reduced. The pressure (from 0.3 to 0.8 bar) had no significant effect on shape accuracy or strength, but it increased porosity and decreased homogeneity. Weger et al. (2020) looked into the effect of two PDs and found that the layer orientation caused a slight anisotropy of the thermal conductivity. Shakor et al. (2019, 2020a, 2020b) used a ProJet 360 printer to study the effect of orientation angle on strength; 90° and 0° were found to be the most appropriate orientations (Shakor et al., 2019). Additionally, it was found that the best performances could be achieved by using a 200 ms delays between printing each layer (Shakor et al., 2020a, 2020b).
Changes in the machine settings or printing strategy can affect the quality of the product. The literature has so far examined the correlative effects of traditional concrete casting in the BJ technique on the quality of printed samples. The purpose of using SCA is to digitalize concrete production by integrating CAD/CAM into the process; however, the CAM/CAM perspective has not been considered in these studies. In this study, the authors determined three parameters for the slicer software: the rate of voxels, the powder bed density and the directions of printing. The effects of these parameters on the final product properties, including density, flexural strength and surface roughness, were therefore studied. The findings obtained will assist engineers in determining the interval of significant factors for future statistical studies for developing the technology, particularly using the design of experiment methodology.
2. Experimental procedures, materials and methods
2.1 Material and mixture composition
Using magnesium oxide as a dry binder, methylcellulose as a water retainer and Poraver expanded glass as a light aggregate, powder bed feedstock was prepared. Details of powder composition (Salari et al., 2022) are provided in Table 1. Methylcellulose was supplied commercially from Decotric (G20, Decotric, Münden, Germany). Filler particles used in this research were in two batches of grain size, labeled as P013 for fine (0.1–0.3 mm) and P255 for semi-fine (0.25–0.5 mm) one. The activator solution was a water solution of magnesium chloride hexahydrate (MgCl2.6H2O) (including 47.2% MgCl2, and 49.5 Wt.% H2O) mixed with rice starch (1.0 Wt.%).
2.2 Manufacturing and test methods
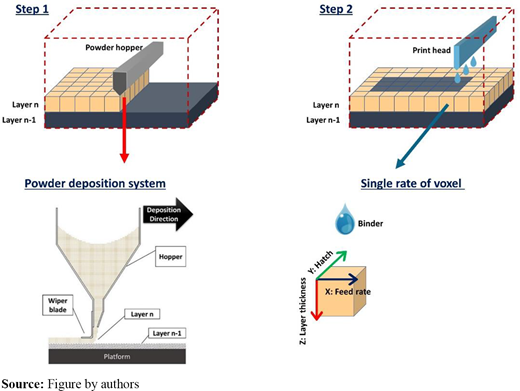
The SCA method was implemented in a custom-designed 3D printing setup, with the printing process schematically depicted in. The powder dispenser mechanism was installed on the printhead gantry. A hopper coupled with a super-elliptic edge profile blade generated a relatively dense layer. Feedstock materials were deposited and spread in the X-direction, whereas the designed layer thickness was adjusted in the Z-direction.
Raster scan is the most common scanning style in SCA to provide the activator solution (Tan, 2000). The printhead traverse in various directions in the X-Y plane and its movement velocity is defined as FR. The shift between two consecutive raster’s is called hatch distance (H).
The rate of voxel (rV – Figure 1) can describe the minimum designable feature according to the following equation:
Magnesium oxychloride is a type of cement that can be produced by combining magnesium oxide (MgO) with a solution of magnesium chloride (MgCl2 and H2O) (Góchez et al., 2017; Sglavo et al., 2011; Walling and Provis, 2016). “phase-5” (5 Mg(OH)2.MgCl2.8H2O) and “phase-3” (3 Mg(OH)2.MgCl2.8H2O) are two stable phases at room temperature with high mechanical strength, appropriate for construction application (Jurišová et al., 2015; Sglavo et al., 2011; Walling and Provis, 2016). In this research, we aimed at printing samples containing Phase-5 according to the reaction:
The total volume of the building chamber was meshed with rV elements, as shown in Step 1, and those correlated to the solid part will be consolidated by the activator solution; the rest will remain free. The stoichiometry of cement reactants and the ratio of sand aggregate to cement can be used to calculate the flow rate. Each rV is made up of aggregate and a portion of cement reactant (a mixture of Poraver aggregates and MgO). The measurement of the powder bed density is a prerequisite step for determining the mass of MgO in a rV and the details of the measurement technique are described in (Salari et al., 2022).
Due to the fact that a portion of the cement reactants (MgO) is in the rV and another portion in the activator solution liquid (MgCl2), the corresponding quantity of fluid for each rV can be calculated as:
where:
β = fluid mass flow rate;
rV = rate of voxel;
ρpb = powder density;
α = weigh ratio of MgO to the powder blend – it is equal to 0.32 as experimentally determined; and
s = 0.60 is the stoichiometric ratio of MgCl2 and water to MgO (binder/MgO) in the 5MOC chemical reaction.
A precise pressure regulator adjusts the calculated fluid flow rate and the values are read by a digital pressure sensor.
Prior to printing, slicer software generates the G-codes as commands for the CAM. In this study, Cura software (UltiMaker Cura, 2023) was primarily used to slice the CAD file and produce geometrical commands (G-codes). The needed M-codes, including the open/close commands for the solenoid valve and hopper lid, were manually entered to generate the complete set of printing commands.
Printing strategies are engineering decisions that define the input settings for slicer software. Layer thickness, hatch distance, and printing speed must all be identified, and these factors are merged in the concept of “rate of voxel.” Engineers/software operators select the material and the velocity of powder spread in the CAD step.
Figure 2 shows a classification of SCA preprocess printing strategies in CAD step for the slicer software. Scanning style, rate of voxel (rV), powder bed density, PD and build direction are printing strategies that affect the final properties of the printed parts (Dudescu and Racz, 2017; Mostafaei et al., 2020; Shrestha and Manogharan, 2017; Utela et al., 2008).
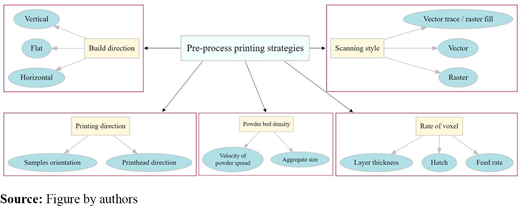
To print the specimens analyzed in this study, the raster scanning style and flat build direction were used. The first decision is the material, which includes the type of cement and aggregate particle size. As the authors have previously developed selective magnesium oxychloride cement activation, this type of cement was used to examine the impact of other parameters. As said in Section 2.1 (Material and mixture composition), the aggregate with two sizes were used, P013 (fine) and P255 (semi-fine). The density of the powder bed is a key input parameter in the CAD step that controls the flow rate. Different powder bed densities are obtained depending on the aggregate particle size and the velocity of powder spreading. Another important input data in slicer software is rV, which is determined by layer thickness, hatch and FR. Putting rV and ρpb into equation (3), the fluid flow rate is calculated. In this research, each parameter is chosen in two levels and a summary of variables with the chosen range is shown in Table 2. In addition, for each combination of printing parameters, the computed flow rate and fluid pressure are reported.
Designed experiment to evaluate effect of printing strategies on printed products
| Aggregate particle size | Velocity of powder spread [mm/min] | Rate of voxel [mm3/min] | Label | Flow rate [g/min] | Pressure [bar] |
|---|---|---|---|---|---|
| P013 | 1,000 | rV_low | A | 5.47 | 0.65 |
| 2,000 | rV_low | B | 5.83 | 0.7 | |
| 1,000 | rV_high | C | 15.37 | 1.95 | |
| 2,000 | rV_high | D | 16.38 | 2 | |
| P255 | 1,000 | rV_low | E | 4.85 | 0.6 |
| 2,000 | rV_low | F | 5.2 | 0.65 | |
| 1,000 | rV_high | G | 13.61 | 1.8 | |
| 2,000 | rV_high | H | 14.61 | 1.9 |
To disperse the powder feedstock, a wedge-shaped hopper system with a 10 mm opening width was used. Consequently, aggregate particle sizes were chosen so that they have acceptable flowability and can form a homogeneous layer. Also, powder mass flow was controlled by a lid connected to a pneumatic cylinder which controlled the state of spreading (open/close), so the minimum particle size had to be greater than the sealing of the lid to prevent powder leakage. Due to the constant width of the hopper, the speed at which the powder was spread was chosen based on the fact that the maximum level had to be within a certain range in order for the powder to spread evenly; and the minimum level had to make a noticeable difference in powder bed qualities (e.g. powder bed density).
To design rVs, it was necessary to have a pressure that could be adjusted in order to provide correlated flow rates for each rV. Fluid jettability established a minimum level while tube and joint sealing determined a maximum level.
2.3 Printing direction
The modulus of rupture (MOR) of rectangular prisms (40 × 40 × 160 mm3) printed in five different raster orientations (as shown in Figure 3) was measured to investigate the infill pattern’s effect on the mechanical properties of cementitious products. rV were designed with L = 2.5 mm, H = 1.5 and FR = 7200 mm/min, for all experiments; printing process completed at 100% of saturation level. Following ASTM C293 standard (ASTM, 2017), printed blocks were subjected to flexural strength test with five repeats.
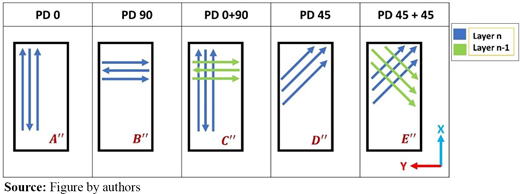
The printhead traveled in the X-direction to distribute the binder layer by layer when the PD was 0. Printhead moved in 45° or 90° relative to the system’s X-direction for specimens with PD = 45 or 90, and the process was repeated for all layers. For PD = 0 + 90, layers one in-between were printed with PD = 0 and PD = 90. A similar strategy was used for PD = 45 + 45, with odd and even layers printed interchangeably in 45 and −45° relative to the X-direction.
The specimens were removed from powder bed 24 h after the 3D printing was completed. Samples were cleaned by pressurized air and stored for five days at ambient temperature. No finishing or curing step, including polishing the surfaces, was carried out before the flexural tests.
The final density was determined by printing three cubic samples (20 × 20 × 20 mm3) for each printing condition. In accordance with the ASTM C830 – 00 norm (ASTM, 2017), volume displacement in isopropyl alcohol medium was measured, and the Archimedes’ density were calculated for each. Rectangular prisms (160 × 40 × 40 mm3) were printed for a three-point bending test according to ASTM C293 (ASTM, 2002). The modulus of rapture was measured by bending using a universal mechanical testing machine. Each testing condition for both density and flexural tests was repeated three times. The arithmetic mean deviation (Ra), defined as deviation of a surface from a mean height (Gadelmawla et al., 2002; “Surface Roughness Measurement – Evaluating Parameters | Olympus,” 2023), was measured by an Olympus Confocal Microscope to report the surface roughness as a yield of printing parameters for samples designed in Table 1. Micro CT tests were carried out using a BAM 225 kV-microCT device that is an in-house constructed setup. It had a micro-focus x-ray tube with 225 kV acceleration voltage, a focal spot size of approximately 7 μm, and a flat panel detector with 2048 × 2048 pixels at a pitch of 0.2 mm. Scanning electron microscopy was performed on broken samples using a JEOL IXRF SYSTEMS 500 with Iridium Ultra software (JSM-5500, Jeol Inc., Tokyo, Japan).
The Tukey test (also known as the “honest significant difference” [HSD] test) is a statistical test that uses a single-step multiple comparison procedure (Haynes, 2013). As a post-hoc analysis, it is used in conjunction with an ANOVA to determine whether there is a statistically significant relationship between two sets of data (Heckert et al., 2012). An ANOVA test can determine whether or not outcomes are significant, but it cannot define where those differences exist. ANOVA is followed by Tukey’s HSD to determine which groups' means differ from each other (Heckert et al., 2012).
A one-way ANOVA and post-hoc Tukey’s test (α = 5%) was conducted to test for statistical differences among printing parameters. Statistical analyses were performed using RStudio software (RStudio Team, 2020). Among the groups tested, the output displays the results of all pairwise comparisons.
3. Results and discussion
Prior to delving into the effects of printing strategies on the final qualities of the product, a survey on cement distribution in a solid component while altering the liquid pressure is beneficial. The rate of voxel is constrained to the available operating pressure of the dispensing system. The minimum pressure is defined by the fluid jettability from the printer nozzle and the droplet penetration into the powder bed. The maximum pressure limit can be defined as the pressure that the tube seals are able to endure during performance.
Cubes were designed to be printed at low and high pressures; for low rV (H:1mm, L:2mm, FR:7200 mm/s), a printing job pressure of 0.5 bar was demanded. Strategies for a second cube with a high rV (H:1.7 mm, L:3.3 mm, FR:7200 mm/s) required 2 bars of pressure.
Depending on the physical properties and kinetic energy of the jetted liquid, the physical properties and powder bed density (ρpb) of the spread powder “crater” or “spreading” granule formation process may occur to solidify the target rVs (Bai et al., 2019; Emady et al., 2013a, 2013b; Miyanaji, 2018; Mostafaei et al., 2020). In SCA with inorganic binders, the pressure is a function of rV (according to equation (3); pressure can alter the velocity of the fluid being jetted and, consequently, the kinetic energy of the droplets.
A visual inspection on printed cube with high pressure (Figure 4 – lower images) indicates a “carter creation” process. Although high-pressure jet flow allows the control of activator solution penetration for greater mechanical strength (Lowke et al., 2020), this phenomenon leads to the formation of residual voids in the solid body at exceptionally high rV. Immediately upon contact, the jet stream rearranges aggregates, producing vertical and horizontal channels (Emady et al., 2013a, 2013b; Mostafaei et al., 2020). The blue arrows in Figure 4(e) show the grooves formed by the jet stream as droplets impact the surface of the powder bed.
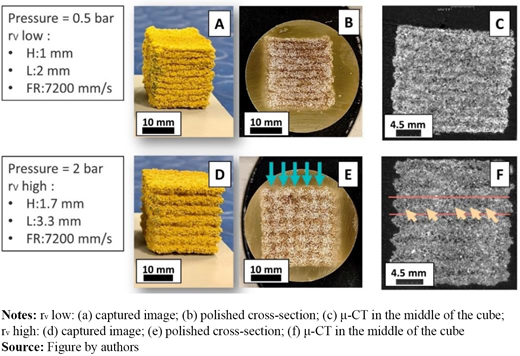
On the other hand, the cube designed to be printed with low rV needed low pressure. According to Figure 4 (upper image), the primitive single-lines are formed by “spreading mechanism” (Emady et al., 2013a, 2013b; Mostafaei et al., 2020). Each layer is deposited on top of previous layer and the layering effect between successive layers are visible (Lowke et al., 2020; Mai et al., 2022). Figure 4(b) and (c) demonstrate that layers are created smoothly and the structure is more homogeneous than at high rV.
The dispensed liquid penetrates along the Z axis and spreads over the X-Y plane. due to capillary forces associated to the fluids’ migration in empty space between aggregates and the droplet’s gravitational forces (Bai et al., 2019; Emady et al., 2013a; Miyanaji, 2018; Mostafaei et al., 2020). This phase is known as imbibition and the fluid migration continues throughout the drainage phase. In drainage, liquid migrates from the saturated region (the initial region penetrated by the droplet) to the surrounding dry aggregates and this process continues until the driving forces in both regions are equal (Bai et al., 2019; Emady et al., 2013a; Miyanaji, 2018; Mostafaei et al., 2020).
If a high rate of voxel is designed for slicer software, generated single-line primitives cannot be completely merged together by imbibition and drainage steps and voids remain as residual porosities. μCT image in Figure 4(f) also confirms the presence of residual voids in every layer.
In the following paragraphs, effect of printing strategies including aggregate particle size, velocity of powder spread and rate of voxel on three different properties of product: density, MOR and surface roughness are discussed. Table 3 shows the difference in mean values of Tukey’s HSD analysis on outcomes for designed samples in Table 2.
Tukey multiple comparisons of means for different tests, with 95% family-wise confidence level
| Pair-wise comparison | Density | Modulus of rupture (MR) | Surface roughness (Sa) | |||
|---|---|---|---|---|---|---|
| Different in mean values | p-values | Different in mean values | p-values | Different in mean values | p-values | |
| B-A | −0.019 | 0.993 | 0.09 | 1.000 | 0.93 | 1.000 |
| C-A | −0.054 | 0.431 | −0.94 | 0.020 | 50.64 | 0.000 |
| D-A | −0.049 | 0.537 | −0.71 | 0.119 | 54.12 | 0.000 |
| E-A | −0.109 | 0.009 | −0.69 | 0.139 | 36.30 | 0.000 |
| F-A | −0.123 | 0.003 | −0.71 | 0.119 | 33.22 | 0.000 |
| G-A | −0.128 | 0.002 | −1.38 | 0.001 | 69.80 | 0.000 |
| H-A | −0.144 | 0.001 | −1.15 | 0.004 | 71.60 | 0.000 |
| C-B | −0.035 | 0.852 | −1.04 | 0.009 | 49.71 | 0.000 |
| D-B | −0.030 | 0.922 | −0.81 | 0.059 | 53.19 | 0.000 |
| E-B | −0.090 | 0.041 | −0.79 | 0.070 | 35.38 | 0.000 |
| F-B | −0.104 | 0.013 | −0.81 | 0.059 | 32.30 | 0.000 |
| G-B | −0.109 | 0.009 | −1.47 | 0.000 | 68.87 | 0.000 |
| H-B | −0.125 | 0.003 | −1.24 | 0.002 | 70.67 | 0.000 |
| D-C | 0.005 | 1.000 | 0.23 | 0.974 | 3.48 | 0.996 |
| E-C | −0.055 | 0.405 | 0.25 | 0.959 | −14.33 | 0.135 |
| F-C | −0.069 | 0.171 | 0.23 | 0.974 | −17.42 | 0.043 |
| G-C | −0.074 | 0.126 | −0.43 | 0.622 | 19.16 | 0.022 |
| H-C | −0.090 | 0.040 | −0.20 | 0.987 | 20.96 | 0.011 |
| E-D | −0.060 | 0.314 | 0.02 | 1.000 | −17.81 | 0.037 |
| F-D | −0.074 | 0.125 | 0.00 | 1.000 | −20.89 | 0.011 |
| G-D | −0.079 | 0.091 | −0.66 | 0.171 | 15.68 | 0.083 |
| H-D | −0.094 | 0.028 | −0.43 | 0.627 | 17.48 | 0.042 |
| F-E | −0.015 | 0.999 | −0.02 | 1.000 | −3.08 | 0.998 |
| G-E | −0.019 | 0.993 | −0.68 | 0.147 | 33.50 | 0.000 |
| H-E | −0.035 | 0.849 | −0.45 | 0.574 | 35.29 | 0.000 |
| G-F | −0.005 | 1.000 | −0.66 | 0.171 | 36.58 | 0.000 |
| H-F | −0.020 | 0.990 | −0.43 | 0.627 | 38.37 | 0.000 |
| H-G | −0.016 | 0.998 | 0.23 | 0.973 | 1.80 | 1.000 |
3.1 Density of printed parts
Due to the droplets migration behavior among particles and the low density of the spread powder bed (ρpb), SCA-manufactured components have a high level of residual porosities, and this critical issue limits 3D printing of concrete with the present technique (Diener et al., 2021; Zocca et al., 2015). Printing parameters such as the velocity of powder spread and aggregate particle size determine powder bed density (ρpb), and strategies such as rate of voxel (rV) identify granule formation mechanism (Emady et al., 2013a).
MgO particles are distributed randomly among aggregates and, as soon as magnesium chloride solution is dispensed on the powder bed, gel formation commences. The viscous gel can wet adjacent aggregates and, after the cement has hardened, cementitious linkages bind them together. Assuming aggregate particles are stronger than cementitious bonds, in SCA with inorganic materials, mechanical strength is determined by the aggregate size and the relative amount of binder (Gunther and Mogele, 2016). Gunther and Mogele (2016) assumed particles are spherical and a cylindrical bridge, similar to sintering, is formed between particles, where maximum mechanical strength is required linearly dependent on the volume of printed cements. Through a particle-bond modeling, the maximum strength can be estimated as σmax ∼ Vb. As more cementitious bonds are formed among aggregates, the structure has less voids (Gunther and Mogele, 2016). Therefore, density is an appropriate indicator to evaluate the effect of printing parameters and strategies on the quantity of cementitious bonds created.
3.1.1 Effect of aggregate particle size on density
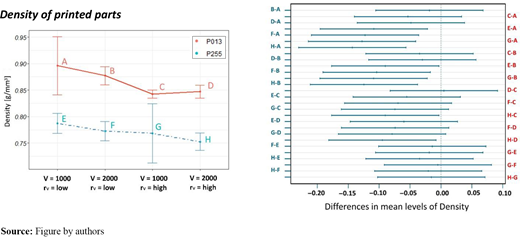
According to the results of density measurement and Tukey test analysis (Figure 5), aggregate size is a significant parameter. Comparing samples with similar printing parameters besides aggregate size, by considering a confidence level of 95%, the Tukey test revealed that the difference in mean levels between A-E (P-value = 0.009), B-F (P-value = 0.013), C-G (P-value = 0.126) and D-H (P-value = 0.028) is statistically significant.
On one hand, the aggregate particle size has a direct effect on the powder bed density (ρpb), with finer aggregates having higher compaction, as there are fewer voids between them. Figure 6(a) and 6(d) illustrates single-line primitives formed with P013 and P255 particles, respectively. Figure 6(b) and 6(e) shows the microstructure of parts of printed blocks with fine (P013) and semi-fine (P255) aggregates, and it is evident that smaller parts have better compaction. Needle-like Phase-5 crystals that are formed between particles are shown in Figure 6(c) and 6(f).
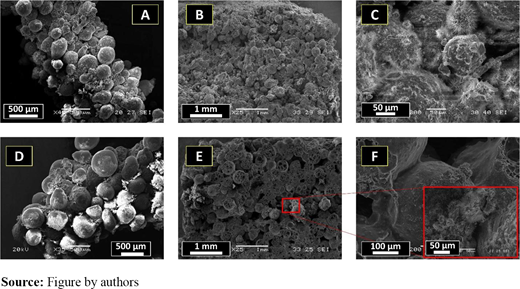
SEM micrographs of (a) single line primitive (rV); (b) section of printed block and (c) needle-like five-phase cements for P013. SEM images of (d) single line primitive; (e) section of printed block and cementitious and (f) cementitious bond between two particles with P255 aggregates
SEM micrographs of (a) single line primitive (rV); (b) section of printed block and (c) needle-like five-phase cements for P013. SEM images of (d) single line primitive; (e) section of printed block and cementitious and (f) cementitious bond between two particles with P255 aggregates
The available active surface area to create cementitious bonds might vary depending on the aggregate particle size. Finer aggregates increase the overall active surface area inside a voxel, thus allowing for the formation of more cementitious bonds.
3.1.2 Effect of velocity of powder spread on density
The effect of “velocity of powder spread” factor can be analyzed as to its impact on the “powder bed density” (ρpb) and, according to the previous studies (Salari et al., 2022) while using the current 3D printer machine, this factor increases vibration in the deposition system, where slightly better compaction was achieved for higher spreading velocities. Statistical analysis did not show significancy for this factor on density. The Tukey test results for pairwise comparisons are of similar printing strategy while varying discussed factor are A-B (P-value = 0.993) C-D(P-value = 1) E-F(P-value = 0.999) G-H (0.998) that is always below than 5% level of significancy.
3.1.3 Effect of rate of voxel on density
Tests labeled A, B, E, and F are carried out with low rV, whereas other tests are performed with high rV. rVs can be used to alter the density, although the consequences are intangible. Considering a confidence level of 95%, the difference in mean levels between A-C (P-value = 0.431), B-D (P-value = 0.922), E-G (P-value = 0.993) and F-H (P-value = 0.990) is not statistically significant.
Generated layers for cubes with identical “aggregate size” and “velocity of powder spread” have the same powder compaction, ρpb, and for any configuration of rVs, an equal volume of fluid is discharged [according to equation (3)]. As comparable amounts of materials are fed to the cement reaction, same densities were anticipated; the slight differences in rVs are due to the powder-binder interaction explained previously in this section.
For large rVs, residual voids diminish the density. The process for forming a single line primitive (rV) was reported at the beginning of this section. For samples printed at high liquid pressure, cement distribution within Z-direction is not homogeneous; macro voids were observed on top of each layer due to crater formation mechanisms and rearranging of particles, while at the bottom of each layer, more volume of cementitious bonds are created (Figure 7) (Lowke et al., 2020; Salari et al., 2022). Additionally, while increasing pressure pushed activator solution into the powder bed, non-reacted MgO was seen on top of a single layer (Figure 7).
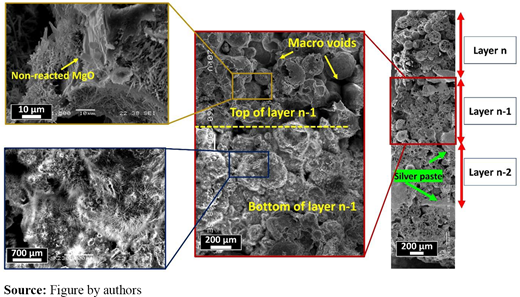
SEM micrographs of cement distribution in a single layer, with macro voids and non-reacted MgO particles in top and more cementitious bonds at the bottom of a single layer
SEM micrographs of cement distribution in a single layer, with macro voids and non-reacted MgO particles in top and more cementitious bonds at the bottom of a single layer
3.2 Flexural strength (modulus of rupture)
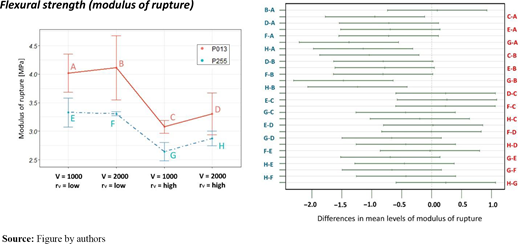
MOR is an indicator of the effect of printing strategies on unreinforced concrete beams to withstand failure in bending. Measured values for printed prisms and the Tukey test are plotted in Figure 8. The influence of studied printing techniques on the MOR will be explored in the next paragraphs.
3.2.1 Effect of aggregate size and velocity of powder spread on modulus of rupture
In the previous section, it was established that the mechanical strength is directly proportional to the volume of cementitious bonds (σmax ∼ Vb), and selecting printing strategies that result in a better compacted powder bed increases the volume of cementitious bonds; consequently, similar trends are observed in the MOR results.
The difference in mean values between A-E (P-value = 0.139), B-F (P-value = 0.059), C-G (P-value = 0.622) and D-H (P-value = 0.627) in Figure 8 demonstrates that aggregate particle size has a substantial influence on the MOR. Finer aggregates result in products with greater durability. The SCA method produces cementitious bonds between particles, unlike BJ with an organic binder [Figure 9(a)]. By simplifying and assuming particles of the same size, multiple packing patterns can be represented as fractions ranging from 60.5% to 74.1%. A cubic and orthorhombic unit cell is shown in Figure 9(b) and 9(c). Although both batches of aggregates were in a range of particle sizes, the mean diameters of P013 and P255 were 0.2 and 0.375 mm, respectively. In a rV printed with P013 because the unit cell was smaller than P255, there was more surface area to create cementitious bonds and the final part was stronger.
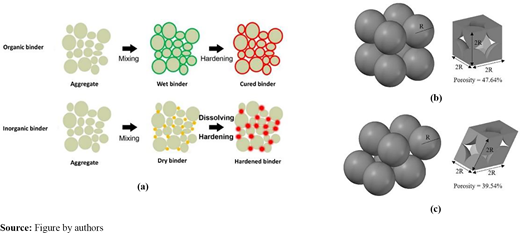
(a) Comparison of organic and inorganic binder systems during the 3D printing process [49]; illustration of a unit cell geometry for different packing models with spherical grains: (b) cubic and (c) orthorhombic (where R is the radius of spherical grain)
(a) Comparison of organic and inorganic binder systems during the 3D printing process [49]; illustration of a unit cell geometry for different packing models with spherical grains: (b) cubic and (c) orthorhombic (where R is the radius of spherical grain)
Analyzing the Tukey test for the varying the “velocity of powder spread” factor and its impact on the MOR leads us to conclude that this factor is not a determinant factor for MOR. The difference in means between A-B (1), C-D (0.974), E-F (1) and G-H (0.973) are not notable, and only for high rVs does increasing “velocity of powder distribution” enhance mechanical strength to a minor degree.
3.2.2 Effect of rV on modulus of rupture
A-C (P-value = 0.020), B-D (P-value = 0.059), E-G (P-value = 0.147) and F-H (P-value = 0.627) have statistically significant differences (Tukey’s HSD) on the mean levels of printed samples with comparable strategies other than the rate of voxel. The results of the statistical analysis, assuming a confidence level of 95%, indicate that this factor is significant, particularly for samples containing P013 aggregates. The reasons for this can be related with the powder-binder interaction mechanism.
In this study, two rVs were designed based on minimum and maximum available options for the utilized printer to evaluate the effect of extremum rVs or, in other words, the effect of extremum working pressure on the products quality. Spreading is the dominant mechanism for low pressure fluids with homogenous distribution of cementitious bonds in each printed layer; and the crater formation is the mechanism if the pressure is in a high value. As a rule of thumb, higher fluid pressure permits greater control over the vertical penetration of the activation solution, this having a positive influence on the strength of SCA-printed objects.
Based on the results of this experiment and the fact that adjusting high pressures needed a greater rate of voxel (rV), it can be inferred that residual voids in extreme rVs decrease the mechanical strength. Accordingly, an optimal rate of voxel must be chosen such that the pressure still drives the activator solution into the powder bed to create an inter-layer connection with fewer residual voids.
Comparing pair-wise A-C and B-D (made with P013) with E-G and F-H (samples made with P255), it is also beneficial to note that the effect of rV on the feedstock with finer aggregate size is more substantial. This phenomenon can be explained by the mass and area of a single aggregate particle. Particles from the fine P013 batch have a mean diameter of 0.2 mm, whereas particles from the semi-fine P255 batch have a mean diameter of 0.37 mm. When the stream of activator solution arrives at the powder bed from a nozzle with a diameter of 0.19 mm, it can rearrange more particles in the powder bed with P013 aggregates than with P255 aggregates.
3.3 Surface roughness
Surface roughness measurements are illustrated in Figure 10. Clearly, the surface roughness of printed specimens is directly proportional to the aggregate particle size, and this factor is statistically significant [A-E (P-value = 0.000), B-F (P-value = 0.000), C-G (P-value = 0.022, and D-H (P-value = 0.042)]. Surface created with finer particles is smoother while surface formed with bigger particle sizes would have more peaks and valleys, resulting in larger roughness. According to pairwise comparisons between A and B (P-value = 1), C and D (P-value = 0.996), E and F (P-value = 0.998) and G and H (1), the effect of powder spreading speed on surface roughness is negligible.
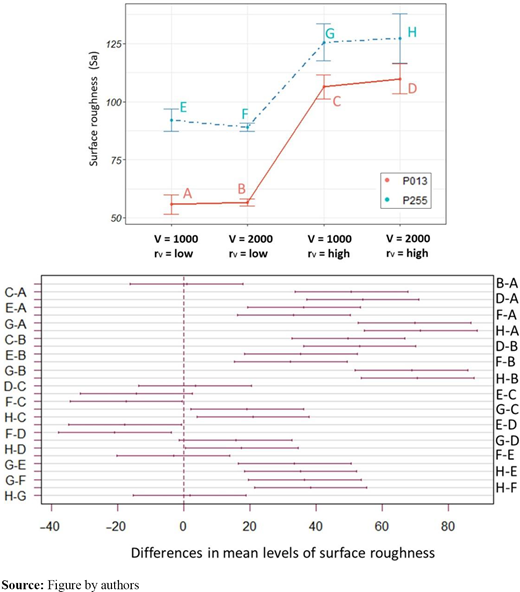
Surface roughness varies with the trace of a nozzle path during the printing process. Changing the fluid pressure alters the granule formation mechanism, and an increase in fluid pressure results in the rearrangement of aggregates, which create distinct grooves in the printing path. The sequence of steps to form a single-line primitive in the BJ process is shown in Figure 11(a).
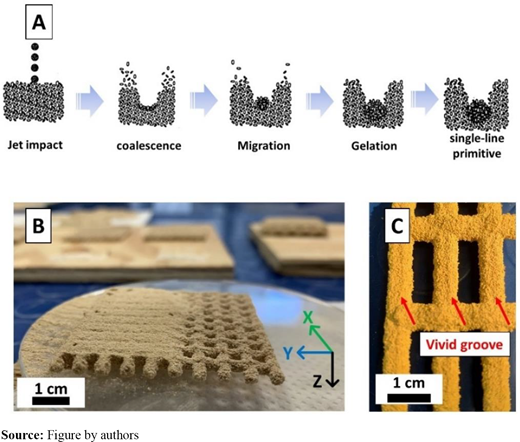
(a) Sequence of steps to form a single-line primitive, (b) mesh form sample printed in high pressure, and (c) vivid groove remained from nozzle path with high pressure of fluid
(a) Sequence of steps to form a single-line primitive, (b) mesh form sample printed in high pressure, and (c) vivid groove remained from nozzle path with high pressure of fluid
A mesh-form structure was printed to show rV in action and it was discovered that fluid pressure rearranged aggregates and moved inward prior to the migration phase. As in Figure 11(c), remaining grooves were apparent to the naked eye when the pressure was high (2 bars).
Surfaces with higher rVs and larger aggregate sizes have a coarser texture. Higher rVs necessitate greater flow rates – droplets are jetted with higher pressure – a crater form mechanism justifies powder binder interaction, but for lower rVs, a spreading mechanism generates a relatively smooth surface. The influence of fluid pressure and the footprint of the nozzle path is the most critical factor in determining the surface roughness of a printed part with identical aggregate particle size.
3.4 Printing direction
To analyze the MOR of the printed beams with five distinct PDs, three-point bending tests were carried out in two loading directions. In one set of experiments, the force was applied normal to the XY plane of printed beams, labeled as Y0, whereas in another series, the force was applied normal to the ZY plane of printed beams, denoted by Y90. The results indicated that PD influenced MOR outcomes, as shown in Figures 12 and 13.
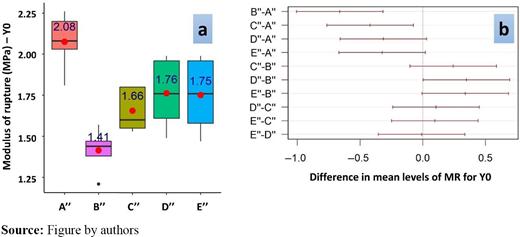
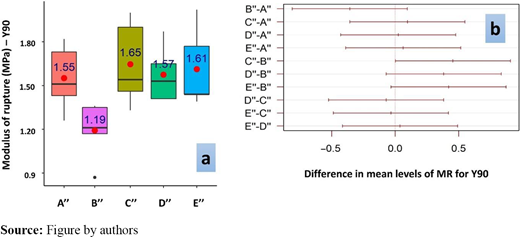
According to the obtained results, the samples created with PD = 0 has the highest MOR in both test directions. Conversely, tested beams printed with PD = 90 lead to minimum MOR. Tukey test plots reveal that for Y0 test direction, the difference between PD = 45, PD = 0 + 90, and PD = 45 + 45 is not significant. However, PDs parallel (PD = 0) and normal (PD = 90) to building directions vary considerably from other PDs (PD = 45, PD = 0 + 90, and PD = 45 + 45). The P-value for A″-B″ show that this pair differed the most. The Y90 test direction outcomes are equivalent, except for PD = 90, and the P-values for the remaining pair-wise samples are not statistically significant. Tukey HDS results for the PDs test are reported in Table 4.
Tukey multiple comparisons of means of different PDs, with 95% family-wise confidence level
| Pair-wise comparison | Y0 | Y90 | ||
|---|---|---|---|---|
| Different in mean values | p-values | Different in mean values | p-values | |
| B"-A" | −0.66 | 0.0001 | −0.36 | 0.167 |
| C"-A" | −0.42 | 0.012 | 0.10 | 0.968 |
| D"-A" | −0.31 | 0.085 | 0.02 | 1.000 |
| E"-A" | −0.32 | 0.071 | 0.06 | 0.994 |
| C"-B" | 0.24 | 0.257 | 0.45 | 0.050 |
| D"-B" | 0.35 | 0.047 | 0.38 | 0.125 |
| E"-B" | 0.34 | 0.056 | 0.42 | 0.078 |
| D"-C" | 0.11 | 0.885 | −0.07 | 0.989 |
| E"-C" | 0.10 | 0.917 | −0.03 | 0.999 |
| E"-D" | −0.01 | 0.99999 | 0.04 | 0.999 |
In conventional concrete production methods, the whole material of the sample is produced following an identical and equal system. However, in layer-by-layer manufacturing techniques, voids are formed between primitive single-lines and layers, which decreases the product’s mechanical strength (Al-Qutaifi et al., 2018; Xiao et al., 2021).
In SCA, the specimen is formed through connections between “single-line primitives” and “successive layers.” Schematic interfaces are depicted in Figure 14, where the orientation of interfaces between layers is independent of PD and always in the XY plane, whereas interfaces between single-line primitives depend on PD. The normal vector of the single-line primate interface is in the XY plane with an angle equal to PD with respect to Y-axis.
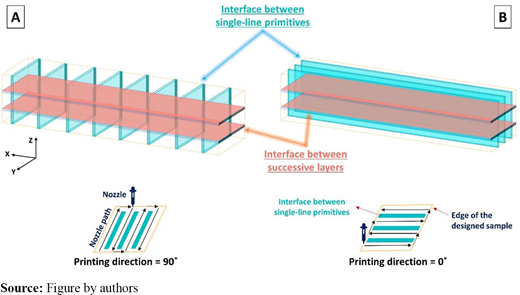
Schematic of interfaces between single-line primitives and successive layers for samples with (a) PD = 90˚ and (b) PD = 0˚
Schematic of interfaces between single-line primitives and successive layers for samples with (a) PD = 90˚ and (b) PD = 0˚
Apart from the PD, all samples are printed using the same processes to evaluate the effect of this parameter on the MOR. As the printhead travels at the same pace over the powder bed, the dispensed liquid has a similar powder binder interaction to consolidate the designed rVs; and residual porosities are considered to be the same shape and size. As a result, the distribution of residual porosities exposed to the applied force is reflected in MR. Concerning the migration of activation solution inside the powder bed substrate, residual porosities are at the mentioned interfaces.
A three-point bending test was used to examine the capacity of specimens to withstand deformation under flexural stresses, and the MOR of printed concrete beams was determined. When cracks spread, they diverge in interfaces (single-line primitives and consecutive layers). Crack propagation direction changes in each successive layer for samples when the force is normal to the XY plane (Y0 – Figure 15). When a force is applied to the ZY plane (Y90 – Figure 15), the cracks path shows a step-like profile.
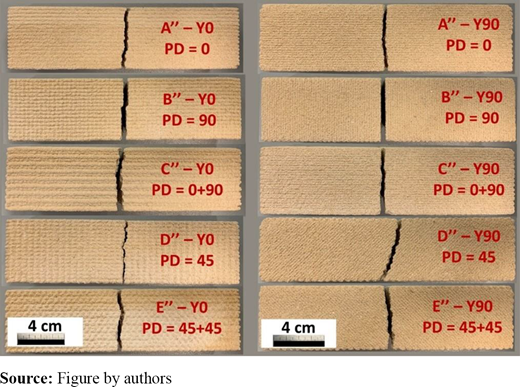
The difference in the mean values of MOR for two build directions (Y0 and Y90) indicates an anisotropic behavior of the mechanical properties of the printed parts.
4. Conclusions
SCA is a CAD/CAM technology to print cementitious elements. This study investigated the effect of rate of voxel, velocity of powder spread and aggregate particle size as inputs for the slicer software on the final properties of printed blocks. The MOR and the final density of printed parts are two indicators expressing the mechanical strength of cement-based materials explicitly and implicitly, respectively. It is also pertinent to pay attention to the surface finish of products used for decoration and facade purposes. The powder bed is bitwise meshed in slicer software using rV (rate of voxel) elements; printed samples with extreme rVs lower MOR. The fluid flow rate is proportional to rV, which is regulated by the fluid pressure. Crater and spreading mechanisms create single-line primitives at high and low rates of designed voxels, respectively. The adjustment of high fluid pressure alters the surface roughness due to nozzle trajectory effects. On the one hand, increased fluid pressure allows better control of the activator solution migration and forms strong linkages between successive layers. It does, however, rearrange aggregates with apparent grooves in the nozzle paths, which remain as macro-voids in hardened blocks. In an alternative manner, for printing procedures designed with low rV in the studied interval, aggregates are connected by a homogeneous distribution of cementitious bonds. it is recommended that the powder bed mesh with an optimal rV so that fluid pressure may force the activation solution deeper with fewer remaining voids. Because the same quantity of powder feedstock and cement reactants are used to print a sample at any rate of voxel, the final density is independent on rV. With finer aggregates and slightly faster recoater speeds, higher final densities were achieved, which is comparable to the impact of these variables on powder bed density. Finer aggregates also have more active surface areas, which can provide more volume of cementitious bonds. The surface of a consolidated component containing fine aggregate is smoother and statistical data indicates that the effect of “velocity of powder spread” on the MOR and surface roughness may be neglected. PD is a significant factor effective in the mechanical strength of products. In contrast to the traditional concrete casting and due to the layer-by-layer nature of AM techniques, interfaces between successive layers and single-line primitives produce anisotropic products. Interfaces are the primary source of voids in an SCA-printed component, and as the PD varies, so does the distribution of voids in areas where fractures tend to propagate. It is more desirable to select PD = 0 in CAD step, as it yields the highest MOR.
The authors received financial support from the Italian Ministry of University and Research (MIUR) within the project Dipartimenti di eccellenza 2018–2022 (Department of Industrial Engineering, University of Trento; project “3D PRINTING”). Authors would like to appreciate Mr Nico Kolsch assist for carrying out CT test at BAM-Berlin.

