


This study aims to enhance the limited understanding of how abrasive blasting influences surface roughness in metallic parts manufactured using atomic diffusion additive manufacturing (ADAM), a process known for producing inherently rough surfaces.
Four metal alloys − H13, A2, 17-4PH and Inconel 625 − were produced using the ADAM process and subjected to six abrasive media with varying Mohs hardness (2–9) and particle sizes (50–1000 µm). Surface roughness was evaluated using Ra, Rz, RSm and Rku, linked to performance in coatings, fatigue resistance, lubrication and finishing. Analysis of variance (ANOVA) and regression analyses were used to assess the impact of abrasive and material properties on roughness outcomes.
Abrasive selection strongly affects post-ADAM surface quality. Hard alumina (Mohs 9), glass beads (6), polymers (3) and walnut shell (2) were tested. In H13, alumina cut Ra by approximately 54%, glass by approximately 33%; in A2, glass lowered Ra by approximately 21% (top) and approximately 16% (side), walnut approximately 24% (top). In 17-4PH, alumina reduced Ra by approximately 20% (side); Inconel 625 showed approximately 28%–35% reduction with alumina, plus approximately 15% with glass (top). Effective Ra reduction may enhance finish, adhesion, fatigue resistance and lubrication potential. ANOVA confirmed abrasive type dominated (approximately 74% Rz, 70% Ra variance), while alloy type showed little effect.
This study systematically analyzes abrasive blasting in ADAM metals, linking abrasive traits to surface performance. It guides abrasive selection and parameters to enhance coating adhesion, fatigue resistance, lubrication and surface quality − offering practical strategies for postprocessing additively manufactured parts.
1. Introduction
Additive manufacturing (AM), also known as 3D printing, has transformed the manufacturing sector by enabling the production of components with complex geometries that would be impossible or economically unfeasible using conventional methods (Pereira et al., 2019). This technology that is based on the layer-by-layer deposition of material allows the advanced customization of parts reducing waste and its application has been extended to sectors such as aerospace, automotive, biomedical and industrial tooling, where design flexibility and efficient material use are essential (Rouf et al., 2022; Srivastava and Rathee, 2022).
Within metal AM technologies, atomic diffusion additive manufacturing (ADAM) has emerged as an innovative alternative (Lavecchia et al., 2023; Monzón et al., 2024; Porrang et al., 2025; Röttger et al., 2024). This technique integrates the extrusion of metal-filled filaments with a subsequent debinding and sintering process, resulting in fully dense components with mechanical properties comparable to those achieved through conventional manufacturing methods (Nurhudan et al., 2021). In this sense and in contrast to other techniques such as selective laser melting (SLM) or directed energy deposition (DED), the ADAM process offers a well-known technology with greater accessibility and enables the fabrication of metal parts with improved dimensional accuracy and reduced residual stress (Czan et al., 2024). Moreover, by dispensing with high-power laser sources and using bound filament, ADAM reduces installation and safety requirements, enables batch sintering and allows safer material handling; therefore, it is competitive when dimensional stability, entry costs and short/medium runs are prioritized − while accepting longer cycle times due to debinding and sintering and the need for surface postprocessing to achieve tight tolerances and good finishes.
Very recent work expands the ADAM knowledge base and its coupling with hybrid postprocessing. Basak et al. (2025) consolidate process–microstructure–property links for ADAM-made 17-4PH with representative mechanical data; Monzón et al. (2024) demonstrate an ADAM + CNC route using oversize factors to recover tight tolerances; in parallel, Freitas et al. (2025) survey hybrid-manufacturing architectures and the role of subtractive finishing and Porrang et al. (2025) model porosity effects in bound-metal steels, underscoring the need for CNC finishing to achieve functional performance.
A major challenge in metal additive manufacturing is achieving an optimal surface finish. Unlike conventional methods, additively manufactured parts often have high surface roughness caused by layer-by-layer deposition, material placement inconsistencies and uneven shrinkage during sintering. These imperfections can negatively impact the final component’s functionality and performance (Berglund et al., 2018; Townsend et al., 2016).
Surface finishing techniques in metal additive manufacturing are generally categorized into chemical, thermal and mechanical methods (Kumbhar and Mulay, 2018). Among chemical and electrochemical approaches, chemical etching selectively removes surface material in a controlled manner, while electropolishing dissolves surface irregularities to achieve smooth, homogeneous and reflective finishes (Tyagi et al., 2019). In superalloys, ultrasonic rolling has also been shown to refine near-surface microstructure and improve mechanical properties, offering a mechanical route for surface quality enhancement (Lin et al., 2025). Nevertheless, for the ADAM parts produced in this work, abrasive blasting offers clear advantages over electropolishing or ultrasonic systems: it quickly removes staircase effects and post-sintering residues, adjusts Ra/Rz without thermal input and allows control of RSm/Rku through the choice of media type and size. Electropolishing, although capable of achieving sub-micrometric Ra on suitable geometries, involves chemical handling and is less effective for enclosed channels or materials with internal porosity. Similarly, abrasive blasting is advantageous over mechanical polishing or CNC machining, as it facilitates access to recessed areas, minimizes edge rounding and scales well in time and cost as an initial treatment prior to localized finishing. Thermal methods include laser remelting, which reflows the surface to minimize defects, and post-sintering heat treatments, which enhance material cohesion and reduce surface unevenness while mechanical methods encompass processes such as mechanical polishing, abrasive blasting and CNC machining, among others. Beyond part-level finishing, friction-based AM routes can also induce particle refinement and dispersion in metal-matrix systems, providing a complementary pathway toward post-blasting surface homogenization (Zhang et al., 2025).
Surface roughness analysis is essential not only for assessing the finish quality of a component but also for understanding its functional performance across various industrial applications. The arithmetic average roughness (Ra) provides a basic measure of surface texture and serves as a general indicator of finish quality after abrasive blasting. However, Ra alone can be insufficient because two surfaces with the same Ra value may have very different topographical features (Dobes et al., 2017). To provide a fuller picture, the mean peak-to-valley height (Rz) measures the vertical distance between the highest peak and the deepest valley, which is important for detecting localized defects that could undermine coating adhesion or increase stress concentrations that affect fatigue resistance. The mean spacing of profile irregularities (RSm) quantifies the average spacing between peaks and valleys and is particularly relevant in tribological applications, as it influences the surface’s ability to retain lubricants and reduce friction during contact with other surfaces (Singh et al., 2005). Finally, kurtosis (Rku) describes the distribution of surface roughness; low Rku values indicate a relatively uniform surface with rounded valleys, which supports good coating adhesion, while high Rku values suggest sharp peaks that may contribute to increased fatigue wear or irregular coating coverage.
Thus, the combined analysis of these four surface roughness parameters (Ra, Rz, RSm and Rku) enables a comprehensive characterization of surface roughness and its impact on surface functionality, facilitating the selection of the most appropriate postprocessing treatment based on the final application of the component.
The present study assessed four metallic materials widely used in advanced industrial applications. These include:
H13 tool steel (UNS T20813, DIN 1.2344, EN X40CrMoV5-1), a hot-work steel commonly used in injection molds and die-casting tools due to its excellent thermal and wear resistance (Omidi et al., 2023);
A2 tool steel (UNS T30102, DIN 1.2363, EN X100CrMoV5), a cold-work steel offering high toughness and dimensional stability, typically applied in stamping dies and forming tools (Mohandas et al., 2024; Okafor, 2012);
17-4PH stainless steel (UNS S17400, DIN 1.4542, EN X5CrNiCuNb16-4), a precipitation-hardened martensitic stainless steel extensively used in aerospace and medical industries due to its favorable combination of mechanical strength and corrosion resistance (Gong et al., 2023); and
Inconel 625 superalloy (UNS N06625, DIN NiCr22Mo9Nb, EN 2.4856), well-suited for high-temperature environments such as gas turbines and heat exchangers, owing to its exceptional oxidation resistance and thermal fatigue performance (Li et al., 2015; Rosnitschek et al., 2024).
For this purpose, six types of abrasives with distinct properties were selected to evaluate their impact on surface roughness after postprocessing of metallic parts manufactured via ADAM by abrasive blasting process. These abrasives included fine brown corundum (FBC), white corundum (WC), plastic media (P), glass beads (G), walnut shell (WS) and brown corundum (BC). The selection of these materials was based on their variability in hardness, particle size distribution and particle morphology − factors that directly influence the alteration of surface texture (Anaç and Doğan, 2023; Basdeki and Apostolopoulos, 2022; Pereira et al., 2019).
In this work, we evaluate four ADAM alloys (H13, A2, 17-4PH and Inconel 625) subjected to abrasive blasting under fixed parameters (0.4 MPa, 200 mm standoff, 90° impact) using six media. Surface roughness (Ra, Rz, RSm, Rku) is measured on faces S2–S3 and normalized into functional indices (finish, coating, lubrication, fatigue). Statistical analysis (ANOVA and regression) assesses the influence of material and abrasive and supports postprocessing recommendations.
2. Materials and methods
2.1 Analyzed materials
For this study, four metallic materials that are commonly used in many industrial applications that require high mechanical, thermal and chemical stress were selected: H13 tool steel, A2 tool steel, 17-4PH stainless steel and Inconel 625. Table 1 shows some of the main characteristics of those alloys.
Main characteristics of the materials used in the study have been collected from the data sheets provided by Markforged Holding Corporation (Markforged Holding Corporation, 2025a)
| Material | Ultimate tensile strength [MPa] | Yield strength [MPa] | Rockwell hardness [HRC] | Break elongation [%] | Relative density [%] |
|---|---|---|---|---|---|
| AISI H13 steel | 1420 | 800 | 40 | 5 | 94.5 |
| AISI A2 steel | 1420 | – | 50 | – | 94.5 |
| 17-4PH Stainless steel | 1230 | 1050 | 38 | 13 | 96.4 |
| Inconel 625 | 765 | 334 | 7 | 42 | 96.5 |
The metallic alloys selected in this study AISI H13, AISI A2, 17-4PH and Inconel 625 are widely used in demanding industrial environments due to their mechanical and thermal performance. H13 is a hot-work tool steel with high thermal and wear resistance, typically used in injection molds and forging dies, and capable of reaching up to 55 HRC after quenching and tempering. A2 is a cold-work steel known for its dimensional stability, abrasion resistance and toughness, achieving 57–62HRC after heat treatment. 17-4PH stainless steel is a precipitation-hardened martensitic alloy that combines mechanical strength and corrosion resistance, commonly used in high-precision structural components and reaching up to 45HRC after aging. Inconel 625 is a nickel-based superalloy that retains structural integrity at temperatures above 980°C, making it suitable for aerospace and chemical applications; its processing via ADAM technology allows the production of complex parts with density and properties comparable to those obtained through conventional methods. Recent alloy-design work has been focused on oxidation-resistant Ni-based superalloys for AM and validating robust postprocessing routes such as blasting to support surface integrity in high-temperature service (Yu et al., 2025).
2.2 Additive manufacturing process
The manufacturing process of the specimens used in this study was carried out via additive manufacturing using the ADAM technique. The Markforged Metal X™ 3D printer is a system designed to produce metallic parts through the deposition of material composed of metallic powder encapsulated within a polymer matrix in form of filament (Markforged Holding Corporation, Waltham, Massachusetts, USA). A recent work we consulted shows the industrial potential of this system (Nikiema et al., 2024). Figure 1 depicts the ADAM printing workflow and the geometry of the cubic (hexahedral) specimens used in this study.
 The image features a progression of objects related to 3D printing technology. The first image shows a textured print surface emerging from a printer, while the second depicts a closed cube printed from a different angle, emphasizing its compact shape. The third image showcases a wooden box with an engraved design on its surface, standing slightly apart from the others. The final image presents multiple finished cubes, demonstrating differing surface textures and designs. The setup includes tools and equipment used in the 3D printing process, highlighting the practical applications of this technology.
Printing equipment and manufactured specimens (regular hexahedra, 30 × 30 × 30 mm3): start of the printing process and infill detail, process progression, “green” part after washing and finished parts after sintering
Source: Authors’ own work
The image features a progression of objects related to 3D printing technology. The first image shows a textured print surface emerging from a printer, while the second depicts a closed cube printed from a different angle, emphasizing its compact shape. The third image showcases a wooden box with an engraved design on its surface, standing slightly apart from the others. The final image presents multiple finished cubes, demonstrating differing surface textures and designs. The setup includes tools and equipment used in the 3D printing process, highlighting the practical applications of this technology.Printing equipment and manufactured specimens (regular hexahedra, 30 × 30 × 30 mm3): start of the printing process and infill detail, process progression, “green” part after washing and finished parts after sintering
Source: Authors’ own work
Like fused filament fabrication technology, composite material deposition was performed layer by layer, generating a structure that was later thermally consolidated. Upon completion of the printing process, the parts were subjected to a debinding stage in the Markforged Wash-1™ system, where the polymer binder was removed using a specialized solvent, resulting in a porous metallic matrix green-part ready for sintering. Final consolidation of the material was carried out in the Markforged Sinter-1™ furnace, ensuring densification of the components. However, the combination of layer-by-layer deposition and thermal shrinkage during sintering leads to surfaces with varying roughness characteristics. These surface texture differences justify the need for postprocessing treatments, such as machining or abrasive blasting among others, to optimize surface quality and enhance part functionality in demanding industrial applications.
The process parameters shown in Table 2 summarize the key characteristics of the printing and postprocessing stages used in the experiments.
Printing parameters used in the manufacturing process with Markforged metal X™ 3D printer
| Material | Printing time | Layer height [mm] | Debinding time | Drying time | Sintering time | Infill [%] | Infill pattern | Base/cap layers |
|---|---|---|---|---|---|---|---|---|
| AISI H13 | 5 h 13 min | 0.125 | 1 d 7 h | 4 h | 1 d 4 h 22 min | 45 | Triangle | 6 |
| AISI A2 | 9 h 32 min | 1 d 4 h 2 min | 44 | |||||
| 17-4PH | 5 h 15 min | 1 d 3 h 0 min | 44 | |||||
| Inconel 625 | 5 h 28 min | 1 d 3 h 0 min | 44 |
Since the parts experience dimensional shrinkage after sintering, the slicer software (Eiger 3D Printing software, Markforged Holding Corporation, Waltham, Massachusetts, USA) considers the appropriate oversize to obtain the final dimensions of the desired part. Additional parameters that influence the final quality included infill pattern and percentage, layer height and the number of reinforcement layers and all were adjusted in the application.
2.3 Abrasive blasting process
Abrasive blasting was used to enhance the surface quality of metallic parts produced via additive manufacturing. A CAT-990 blasting cabinet (Aslak Machines and Tools S.L., Sant Quirze del Vallès, Barcelona, Spain) was used. This equipment was operated with a pressure of 0.4 MPa and the projection nozzle was placed at 200 mm from the specimen surface, with the abrasive applied at a 90° angle with respect to the surface to be treated. These values fall within common practice in surface preparation and promote a predominantly normal impact that develops the surface profile without introducing cutting effects associated with shallow (grazing) angles. The selected pressure provides sufficient energy to modify the surface topography without causing subsurface damage in sintered ADAM parts or appreciable abrasive embedment. All blasting operations were carried out in dry (compressed air) mode and no water or liquid carrier was used.
To complete the experiment, six different abrasives with varying hardness and particle size distribution were evaluated, and the different types of abrasive materials were selected based on their influence on surface roughness parameters. Table 3 presents the main characteristics of the abrasives used.
Main characteristics of the abrasives used in the experiments
| Abrasive | Particle size [µm] | Hardness [Mohs] | Form | Specific weight [g/cm³] |
|---|---|---|---|---|
| Fine brown corundum | 106–250 | 9 | Angular | 3.95 |
| White corundum | 150–300 | 9 | Angular | 3.96 |
| Plastic particles | 500–1000 | 3 | Irregular | 1.30 |
| Glass microspheres | 50–150 | 6 | Spherical | 2.50 |
| Walnut shell | 700–1500 | 2 | Irregular | 1.20 |
| Brown corundum | 250–500 | 9 | Angular | 3.95 |
2.4 Design of experiments (DoE)
Abrasive blasting experiments were conducted on model specimens. These specimens consisted of regular hexahedrons with 30 × 30 × 30 mm. The process was repeated three times, and the surface roughness was evaluated on three characteristic faces of the hexahedrons: the support face in contact with the printer platform (S1), and the top face parallel to the printer platform (S2) and the lateral face (S3). Figure 2 illustrates a schematic representation of the spatial arrangement of the analyzed faces.
 The image features a diagram of a three-dimensional cube on the left, with each side labeled one, two, and three, illustrating its dimensions. To the right, there are three images labeled S1, S2, and S3. Each image presents a different surface texture, with S1 showing a smooth surface, S2 depicting a diagonal striped pattern, and S3 covering a horizontal linear texture. Each image includes a scale bar indicating a measurement of one millimetre for reference. The layout consists of the cube on the left followed by the three surface images arranged in a horizontal row, allowing for comparison of textures.
Regular hexahedral specimen manufactured for the experiments. The surfaces of study are base or inferior face (S1), superior face (S2) and the lateral faces (S3)
Source: Authors’ own work
The image features a diagram of a three-dimensional cube on the left, with each side labeled one, two, and three, illustrating its dimensions. To the right, there are three images labeled S1, S2, and S3. Each image presents a different surface texture, with S1 showing a smooth surface, S2 depicting a diagonal striped pattern, and S3 covering a horizontal linear texture. Each image includes a scale bar indicating a measurement of one millimetre for reference. The layout consists of the cube on the left followed by the three surface images arranged in a horizontal row, allowing for comparison of textures.Regular hexahedral specimen manufactured for the experiments. The surfaces of study are base or inferior face (S1), superior face (S2) and the lateral faces (S3)
Source: Authors’ own work
A full factorial 6 × 4 was implemented with six abrasive media (FBC, WC, P, G, WS, BC) and four materials (H13, A2, 17-4PH, Inconel 625), resulting in 24 combinations and thus 24 hexahedral specimens (one per combination). The blasting time was sufficient to produce a regular and homogeneous surface texture on the hexahedron surface. Thus, it ranged from 10 s for hard abrasives to 180 s when using walnut shell media. The values evaluated are presented in Table 4.
Design of experiments (full factorial 6 × 4) to evaluate the effect of blasting conditions on surface roughness. Materials: H13, A2, 17-4PH, Inconel 625
| Abrasive type | Time [s] | Measured faces | Iteration nr. | Evaluated parameters |
|---|---|---|---|---|
| Fine brown corundum | 10–20 | S2, S3 | 3 | Ra, Rz, RSm, Rku and % weight variation |
| White corundum | 10–20 | S2, S3 | 3 | |
| Plastic particles | 10–30 | S2, S3 | 3 | |
| Glass microspheres | 10–30 | S2, S3 | 3 | |
| Walnut shell | 60–180 | S2, S3 | 3 | |
| Brown corundum | 10–20 | S2, S3 | 3 |
2.5 Confocal microscopy
Surface characterization was performed using Leica DVM6 and DCM8 confocal microscopes (Leica Microsystems, Wetzlar, Germany). Three-dimensional surface texture images were captured to analyze both initial conditions and changes from treatments. DVM6 offers a 16:1 zoom ratio with magnification from 12x to 2350x and allows fast lens switching, improving workflow over conventional microscopes. The DCM8 combines confocal microscopy with HD interferometry, enabling high-detail imaging without sample preparation and providing accurate 2D and 3D surface analysis.
2.6 Roughness indicators for the evaluation of the performance of the treated surface
To evaluate the suitability of the different abrasives proposed in this study for potential industrial applications across various components and parts manufactured using ADAM technology, four indicators have been defined based on different measured surface roughness parameters:
coating adhesion capability indicator;
surface finish quality indicator;
lubrication capacity indicator; and
fatigue resistance capability indicator.
Based on the reviewed literature, it has been established that certain surface roughness parameters are more representative for assessing surface behavior in each of the cited applications. For coating adhesion, the most relevant parameter is Rz (mean peak-to-valley height), as it reflects the degree of mechanical interlocking that a surface can provide. Previous studies have demonstrated that maximum roughness height (Rz) has a direct impact on coating adhesion and, consequently, corrosion protection. On the contrary, excessively high Rz values can cause discontinuities in the protective layer, negatively affecting its long-term performance (Croll, 2020). Generally, Rz values in the range of 30–40 µm have been recommended to maximize this function but, preferably, Rz values between 15 and 40 µm ensure adequate adhesion without compromising coating uniformity for paint application on steel substrates (EN ISO 8503–1:2012, 2012; EN ISO 8503–2:2012, 2012). This, concretely, has been experimentally corroborated by Kumar et al., who identified an optimal Rz range of 12–40 µm for improving paint and coating adhesion on steel substrates (Kumar et al., 2023). In summary, an Rz range of 15–40µm can be considered optimal for achieving effective mechanical adhesion of coatings.
To assess surface finish quality, the most representative parameter is the arithmetic average roughness Ra, which measures the mean deviation of surface height relative to a reference line. For applications where aerodynamic performance or turbomachinery efficiency is critical, surface roughness should be Ra ≤ 0.9 µm (Goodhand et al., 2016). In applications requiring moderate roughness control, such as aerospace or biomedical components, Ra between 0.5 and 1.0 µm is considered appropriate while Ra in the range of 1.0–3.2 µm is appropriate for general manufacturing and quality control purposes as widely accepted standard across industries such as automotive and tool manufacturing (Sahay and Ghosh, 2018).
Ultimately, for the most common applications of parts produced via additive manufacturing with the ADAM technology, Ra in a range of 1–3µm can be regarded as ideal for precision finishes, as it offers a balance between surface smoothness and roughness control without compromising part functionality. In this sense, the previous work developed by Röttger et al. (Röttger et al., 2024) determined that can only be achieved Ra values between 3 and 11 µm in the top and lateral surfaces of a hexahedral specimen manufactured by ADAM technology and sintered at different temperatures between 1240°C and 1300°C, confirming the need for postprocessing if a smoother finish level is desired.
For applications where lubricant retention is critical, the most representative parameter is RSm (mean spacing of profile irregularities). This parameter quantifies the average distance between peaks in the surface texture, which directly affects the formation and stability of the lubricant film. Thus, lower RSm values (<50µm) result in a higher density of peaks and valleys, which can enhance lubricant retention but may also increase friction and wear due to greater surface contact. Intermediate RSm values (50–150µm) provide a balance between lubricant retention capacity and the reduction of solid-to-solid contact. Conversely, high RSm values (>150µm) may hinder the formation of a continuous lubricant film, as the lubricant can easily be displaced without becoming trapped in the surface microstructure (Larsson, 2009). Other studies that have been consulted recommend broader ranges, between 100 and 300µm, for hydrodynamic lubrication, noting that the optimal RSm values depend on the relationship between lubricant viscosity and the pressure between the surfaces in contact (Podgornik et al., 2012). Thus, to evaluate the performance in the alloys object of this study, an optimal RSm range of 100–200µm has been proposed.
Finally, to evaluate the influence in the fatigue resistance as a function of a surface roughness, one of the most suitable parameters is Rku (kurtosis of the height distribution). This parameter describes the sharpness of surface peaks, which influences stress concentration and crack initiation under cyclic loading. Optimal Rku values between 3.5 and 4.0 have been shown to provide a good balance between lubricant retention, minimized stress concentration and enhanced fatigue resistance in titanium alloys (Lee et al., 2021). Conversely, low Rku values (<2.5) tend to reduce load-bearing capacity, indicating a greater likelihood of fatigue crack initiation. For aluminum alloys, optimal Rku values have been reported in the range of 2.9–3.1 (Zielecki and Ozga, 2022). Table 5 presents the optimal indicator values identified across various referenced studies.
Roughness parameters and optimal values defined according to the application
| Parameter | Description | Value | References |
|---|---|---|---|
| Rz | Mean peak-to-valley height (paint/coating adhesion) | 15–40 µm | (Croll, 2020; EN ISO 8503–1:2012, 2012; Kumar et al., 2023; Soe et al., 2024) |
| Ra | Average roughness (surface finish quality) | 1–3 µm | (Goodhand et al., 2016; Sahay and Ghosh, 2018) |
| RSm | Mean spacing of profile irregularities (lubricant retention capability) | 100–200 µm | (Larsson, 2009; Podgornik et al., 2012) |
| Rku | Kurtosis of the height distribution (fatigue resistance) | 2.9–3.5 (ad) | (Lee et al., 2021; Zielecki and Ozga, 2022) |
Finally, to ensure a consistent and objective evaluation, normalized performance indices were established by defining optimal reference values for each roughness parameter assessed. These reference values were derived from previously cited studies and technical literature (Table 5). The normalization process has enabled the transformation of data into a scale ranging from 0 to 1, where a value of 1 represents optimal surface conditions, and 0 denotes surfaces unsuitable for the evaluated application.
The indices assessed have been defined in equations (1)–(4) as the coating index (CI), the fatigue index (FaI), the lubrication index (LI) and the finish index (FiI), respectively. They were determined by taking the following optimal values: Rz* = 25 µm, Rku* = 2.9, RSm* = 150 µm and Ra* = 3 µm, and dividing each by the mean values measured on the S2 and S3 surfaces of the evaluated hexahedral specimens:
2.7 Statistical analysis
The impact of abrasive blasting on the surface roughness of 3D printed/sintered specimens was assessed through two main approaches. First, roughness parameters (Ra, Rz, RSm, Rku) were used as indices to select optimal abrasive media based on application needs: low roughness and homogeneity for coating adhesion, minimal stress concentrations for fatigue resistance and favorable textures for lubricant retention. Second, ANOVA and regression modeling were applied to evaluate the statistical effects of material and abrasive type on roughness. Linear regression predicted roughness evolution, with model accuracy measured by adjusted R2 and normal probability plots. This analysis identified trends and optimal treatments by application. All statistical work was done using Minitab software (Minitab, LLC, Pennsylvania, USA). The analyses in Minitab were performed using the data from Table 4; the .MPJ/.MTB project is available on request.
3. Results
3.1 Roughness data
In Table 6, the data collected concerning the four roughness parameters considered in this study are summarized. Thus, each type of abrasive and alloy specimens are included. It must be noted that the values included in the results are those corresponding to roughness measure in specimen faces S2 (up face) and S3 (lateral faces), which are the most representative surfaces of the printed parts.
The values of the surface roughness main parameters Ra, Rz, RSm (µm) and Rku (ad.) measured on the top face (S2) and lateral faces (S3) of hexahedral specimens after abrasive blasting. Abrasive used are: FBC (fine brown corundum), WC (white corundum), P (plastic media), G (glass beads), WS (walnut shell) and BC (brown corundum), with S representing the as-supplied (untreated) material condition
| Material | Abrasive | Ra [µm] | Rz [µm] | RSm [µm] | Rku [adimensional] | ||||
|---|---|---|---|---|---|---|---|---|---|
| S2 | S3 | S2 | S3 | S2 | S3 | S2 | S3 | ||
| AISI H13 tool steel | S | 7.9 ± 0.3 | 6.2 ± 0.9 | 50.6 ± 2.6 | 41.2 ± 5.4 | 79.0 ± 9.0 | 66.0 ± 16.0 | 3.1 ± 0.2 | 3.2 ± 0.3 |
| FBC | 3.6 ± 0.5 | 5.1 ± 0.5 | 23.2 ± 3.5 | 29.6 ± 2.2 | 76.0 ± 21.0 | 80.0 ± 5.0 | 3.7 ± 1.0 | 3.6 ± 0.7 | |
| WC | 7.4 ± 0.9 | 7.4 ± 0.5 | 50.4 ± 13.2 | 53.5 ± 15.1 | 87.0 ± 13.0 | 86.0 ± 10.0 | 3.9 ± 0.6 | 4.4 ± 1.2 | |
| P | 6.9 ± 0.4 | 5.4 ± 0.5 | 43.2 ± 1.2 | 35.4 ± 2.8 | 77.0 ± 6.0 | 70.0 ± 10.0 | 2.9 ± 0.1 | 3.2 ± 0.1 | |
| G | 5.3 ± 0.2 | 6.8 ± 0.5 | 35.0 ± 3.6 | 44.9 ± 8.2 | 83.0 ± 22.0 | 80.0 ± 7.0 | 3.3 ± 0.3 | 3.8 ± 0.5 | |
| WS | 6.9 ± 0.4 | 6.5 ± 0.5 | 39.9 ± 6.5 | 40.3 ± 1.4 | 92.0 ± 4.0 | 91.0 ± 13.0 | 2.9 ± 0.6 | 3.7 ± 0.5 | |
| BC | 5.8 ± 0.2 | 5.6 ± 1.3 | 35.5 ± 4.7 | 34.7 ± 10.3 | 81.0 ± 15.0 | 86.0 ± 19.0 | 3.3 ± 0.2 | 3.6 ± 0.4 | |
| AISI A2 tool steel | S | 6.2 ± 0.2 | 6.4 ± 0.1 | 38.8 ± 2.5 | 40.1 ± 2.0 | 64.0 ± 14.0 | 67.0 ± 6.0 | 2.8 ± 0.7 | 2.9 ± 0.3 |
| FBC | 5.8 ± 0.1 | 5.5 ± 0.8 | 36.2 ± 1.8 | 34.5 ± 1.9 | 74.0 ± 9.0 | 67.0 ± 13.0 | 3.3 ± 0.8 | 3.3 ± 0.9 | |
| WC | 6.0 ± 0.2 | 8.1 ± 0.6 | 45.4 ± 7.6 | 55.9 ± 5.1 | 97.0 ± 9.0 | 86.0 ± 9.0 | 4.4 ± 1.9 | 4.7 ± 0.9 | |
| P | 6.3 ± 0.5 | 5.5 ± 0.3 | 40.3 ± 2.1 | 33.8 ± 2.3 | 77.0 ± 14.0 | 99.9 ± 10.0 | 2.9 ± 0.6 | 3.2 ± 0.1 | |
| G | 4.9 ± 0.5 | 5.4 ± 0.4 | 39.2 ± 7.1 | 37.3 ± 2.6 | 75.0 ± 22.0 | 71.0 ± 8.0 | 2.8 ± 0.3 | 4.3 ± 1.0 | |
| WS | 4.7 ± 0.5 | 6.3 ± 0.4 | 37.3 ± 1.1 | 39.7 ± 3.8 | 91.0 ± 13.0 | 90.0 ± 6.0 | 3.3 ± 0.6 | 3.9 ± 0.4 | |
| BC | 6.3 ± 0.3 | 6.3 ± 0.3 | 45.3 ± 5.8 | 55.9 ± 4.6 | 81.0 ± 8.0 | 86.0 ± 3.0 | 3.3 ± 1.3 | 3.6 ± 0.5 | |
| 17-4PH stainless steel | S | 4.7 ± 0.3 | 4.6 ± 0.4 | 31.7 ± 4.7 | 32.2 ± 3.7 | 60.0 ± 5.0 | 66.3 ± 7.0 | 3.2 ± 0.5 | 3.5 ± 0.4 |
| FBC | 4.7 ± 0.3 | 3.7 ± 0.4 | 29.6 ± 1.2 | 24.9 ± 2.1 | 85.0 ± 3.0 | 72.0 ± 7.3 | 3.1 ± 0.1 | 3.6 ± 0.2 | |
| WC | 7.3 ± 0.8 | 7.9 ± 0.9 | 49.7 ± 8.6 | 55.8 ± 7.0 | 85.0 ± 6.0 | 87.0 ± 8.0 | 3.7 ± 0.8 | 4.5 ± 0.8 | |
| P | 5.8 ± 0.3 | 4.6 ± 0.6 | 39.2 ± 0.7 | 29.6 ± 3.2 | 80.0 ± 6.0 | 75.0 ± 8.3 | 3.6 ± 0.4 | 3.7 ± 0.6 | |
| G | 6.4 ± 0.5 | 7.4 ± 0.7 | 45.7 ± 2.2 | 50.4 ± 5.6 | 77.0 ± 10.0 | 68.0 ± 7.0 | 3.9 ± 0.2 | 3.5 ± 0.4 | |
| WS | 5.6 ± 0.5 | 5.7 ± 0.6 | 35.2 ± 3.3 | 37.7 ± 3.8 | 71.0 ± 5.0 | 88.0 ± 7.3 | 3.2 ± 0.7 | 4.1 ± 0.6 | |
| BC | 7.0 ± 0.4 | 7.8 ± 0.5 | 44.7 ± 4.6 | 53.2 ± 5.5 | 77.0 ± 6.0 | 83.0 ± 7.3 | 4.0 ± 0.6 | 3.4 ± 0.7 | |
| Inconel 625 alloy | S | 6.5 ± 0.4 | 5.4 ± 0.4 | 41.5 ± 4.9 | 34.8 ± 3.6 | 75.0 ± 8.0 | 59.0 ± 6.3 | 3.0 ± 0.3 | 2.9 ± 0.2 |
| FBC | 4.7 ± 0.2 | 3.5 ± 0.3 | 31.7 ± 3.0 | 23.1 ± 2.7 | 79.0 ± 2.0 | 75.0 ± 5.0 | 3.6 ± 0.3 | 4.4 ± 0.5 | |
| WC | 7.2 ± 0.4 | 7.9 ± 0.5 | 43.2 ± 1.8 | 45.9 ± 2.6 | 79.0 ± 12.0 | 74.0 ± 8.3 | 3.1 ± 0.3 | 2.7 ± 0.4 | |
| P | 5.7 ± 0.6 | 6.4 ± 0.5 | 35.6 ± 4.3 | 42.18 ± 3.9 | 68.0 ± 11.0 | 71.7 ± 8.7 | 2.8 ± 0.4 | 3.3 ± 0.4 | |
| G | 5.5 ± 0.8 | 5.9 ± 0.4 | 34.6 ± 2.1 | 35.2 ± 3.4 | 89.0 ± 4.0 | 66.0 ± 9.0 | 3.1 ± 0.2 | 2.8 ± 0.5 | |
| WS | 5.4 ± 0.3 | 5.4 ± 0.3 | 35.3 ± 3.9 | 36.7 ± 3.7 | 78.0 ± 12.0 | 80.0 ± 10.0 | 3.7 ± 0.5 | 4.4 ± 0.4 | |
| BC | 7.3 ± 0.6 | 7.8 ± 0.5 | 45.2 ± 6.1 | 49.3 ± 3.7 | 82.0 ± 8.0 | 84.0 ± 7.0 | 3.6 ± 0.5 | 3.4 ± 0.7 | |
Confocal microscopy images revealed the roughness differences between the faces of the hexahedral specimens as shown in Figure 3(a) to 3(c). The analysis presented for A2 steel confirms that a similar phenomenon occurs across all the metallic alloys objects of the present study.
 The image features three three-dimensional graphs labeled (a), (b), and (c), illustrating the surface topographies of different materials. Each graph displays height variations in micrometers, represented by a colour scale positioned on the right side. The horizontal axes measure width in millimeters, while the vertical axis marks height up to four hundred micrometers. The graphical data is structured in a continuous format, showing varying surface features across the three graphs. Each 3D representation exhibits contours that suggest differences in texture and elevation in the materials studied. The height measurement increases from the front to back of each graph, enabling a visual comparison among the three configurations.
Images of the surfaces of an A2 tool steel hexahedron fabricated with a Markforged Metal X system in the as-supplied condition, acquired by microscope and processed with Mountains® v8 software: (a) base face, S1; (b) top face, S2; and (c) lateral face, S3
Source: Authors’ own work
The image features three three-dimensional graphs labeled (a), (b), and (c), illustrating the surface topographies of different materials. Each graph displays height variations in micrometers, represented by a colour scale positioned on the right side. The horizontal axes measure width in millimeters, while the vertical axis marks height up to four hundred micrometers. The graphical data is structured in a continuous format, showing varying surface features across the three graphs. Each 3D representation exhibits contours that suggest differences in texture and elevation in the materials studied. The height measurement increases from the front to back of each graph, enabling a visual comparison among the three configurations.Images of the surfaces of an A2 tool steel hexahedron fabricated with a Markforged Metal X system in the as-supplied condition, acquired by microscope and processed with Mountains® v8 software: (a) base face, S1; (b) top face, S2; and (c) lateral face, S3
Source: Authors’ own work
In the ADAM process, the first deposited layer of metal filament is slightly compressed against the build platform. This initial compression locally increases density and flattens the surface profile, so the S1 face is significantly denser and smoother than the upper and lateral layers. Previous research works developed by Galati, Minetolaetal. (Galati and Minetola, 2019; Minetola et al., 2020) experimentally showed that the bottom and top layers printed “with full density” exhibit much lower roughness and open porosity after sintering, confirming that the nozzle-induced flattening enhances adhesion and promotes densification of the part’s base.
As previously noted, printing orientation in ADAM makes S1 (bottom) markedly smoother due to contact with the build plate, whereas S2 (top) shows flattened skin roads and S3 (sides) retains the layer-staircase imprint (see also Figure 3). Consequently, and because S2–S3 are the most representative surfaces, roughness differences between them do not follow a monotonic pattern: in general, S3 tends to exhibit higher Rz than S2 with angular alumina media (WC/BC), whereas with shot-peening or softer media (G, P/WS) the gap narrows and Ra vary less systematically. In addition, Figure 4(a) to Figure 4(f) illustrates the characteristic S3 texture for each abrasive under constant conditions.
 The image presents six three-dimensional surface plots labeled from (a) to (f), depicting variations in surface height measured in micrometers. Each plot features a corresponding vertical colour gradient scale indicating height values, with increments from zero to four hundred micrometers. The x and y axes are marked in millimeters, extending from zero to three. The elevation patterns differ across the plots, suggesting various surface characteristics, while the scale aids in interpreting the height of structures within the plots. Each subplot showcases a unique orientation of surface features.
Surface topography of one lateral face (S3) of an A2 tool steel hexahedron manufactured using a Markforged Metal X system. Images were acquired with a Leica DCM8 optical profiler and processed using Mountains® v8 software. Surface finishing treatments applied: (a) fine brown corundum, (b) white corundum, (c) plastic media blasting, (d) glass microspheres, (e) walnut shell blasting and (f) coarse brown corundum
Source: Authors’ own work
The image presents six three-dimensional surface plots labeled from (a) to (f), depicting variations in surface height measured in micrometers. Each plot features a corresponding vertical colour gradient scale indicating height values, with increments from zero to four hundred micrometers. The x and y axes are marked in millimeters, extending from zero to three. The elevation patterns differ across the plots, suggesting various surface characteristics, while the scale aids in interpreting the height of structures within the plots. Each subplot showcases a unique orientation of surface features.Surface topography of one lateral face (S3) of an A2 tool steel hexahedron manufactured using a Markforged Metal X system. Images were acquired with a Leica DCM8 optical profiler and processed using Mountains® v8 software. Surface finishing treatments applied: (a) fine brown corundum, (b) white corundum, (c) plastic media blasting, (d) glass microspheres, (e) walnut shell blasting and (f) coarse brown corundum
Source: Authors’ own work
3.2 Weight variation
Additionally, the variation in mass Δm (‰) of the hexahedrons after abrasive blasting of all faces has been evaluated. The results are shown in Figure 5.
 The bar graph displays weight variation percentages on the vertical axis, ranging from negative one point four to positive zero point two. The horizontal axis categorizes different abrasives, including FBC, WC, P, G, WS, and BC. Each abrasion type has bars representing materials such as H13, A2, 17-4PH, and Inconel 625, distinguished by different colours: blue for H13, grey for A2, light green for 17-4PH, and light orange for Inconel 625. Each bar includes error bars indicating variability in the data. The graph is organized from left to right, allowing for direct comparison of weight variations across the specified abrasives.
Weight variation, Δm (‰) of hexahedrons fabricated from different materials via additive manufacturing after abrasive blasting on all faces with various media: (i) FBC – fine brown corundum, (ii) WC – white corundum, (iii) P – plastic shot, (iv) G – glass microspheres, (v) WS – walnut shell, (vi) BC – coarse brown corundum
Source: Authors’ own work
The bar graph displays weight variation percentages on the vertical axis, ranging from negative one point four to positive zero point two. The horizontal axis categorizes different abrasives, including FBC, WC, P, G, WS, and BC. Each abrasion type has bars representing materials such as H13, A2, 17-4PH, and Inconel 625, distinguished by different colours: blue for H13, grey for A2, light green for 17-4PH, and light orange for Inconel 625. Each bar includes error bars indicating variability in the data. The graph is organized from left to right, allowing for direct comparison of weight variations across the specified abrasives.Weight variation, Δm (‰) of hexahedrons fabricated from different materials via additive manufacturing after abrasive blasting on all faces with various media: (i) FBC – fine brown corundum, (ii) WC – white corundum, (iii) P – plastic shot, (iv) G – glass microspheres, (v) WS – walnut shell, (vi) BC – coarse brown corundum
Source: Authors’ own work
3.3 Statistical analysis
The statistical analysis conducted in this study aimed to identify the most appropriate abrasive media to obtain the surface finishing and considering their intended functional application. Thus, an optimal choice of abrasive was made according to the application: finishing, coating, fatigue and lubrication.
To ensure a consistent and objective assessment, optimal reference values were defined for each surface roughness parameter based on performance indices, drawing from established studies and relevant technical literature (summarized in Table 4). These optimal values, taken as average figures from the literature reviewed, were used to normalize the results on a 0-to-1 scale, where a score of1 denotes optimal surface quality for the target application and 0 indicates an unsuitable surface condition. Figure 6(a) and (b), shows the standardized data corresponding to A2 and H13 tool steels and Figure 7(a) and (b), shows the standardized data corresponding to 17-4PH stainless steel and Inconel.
 The image displays a bar graph divided into two sections, one for Steel A2 and another for Steel H13. Each section features five bars representing different indices: Coating Index, Fatigue Index, Lubrication Index, and Finishing Index, with values for each category shown above the bars. The bars are arranged vertically and colour-coded for each index: yellow for Coating Index, blue for Fatigue Index, green for Lubrication Index, and grey for Finishing Index. Error bars are also present, indicating variability around the values. The Steel A2 section is labeled as (a), and the Steel H13 section is labeled as (b). Both sections flow from left to right, with the categories consistently represented across both types of steel. The y-axis ranges from zero to one.
Performance indices following the surface texturing of A2 (a) and H13 steel (b) components manufactured via ADAM technology with various abrasives: (i) FBC – fine brown corundum, (ii) WC – white corundum, (iii) P – plastic shot, (iv) G – glass microspheres, (v) WS – walnut shell, (vi) BC – coarse brown corundum. The performance index (PI) is dimensionless (0 = worst, 1 = best)
Source: Authors’ own work
The image displays a bar graph divided into two sections, one for Steel A2 and another for Steel H13. Each section features five bars representing different indices: Coating Index, Fatigue Index, Lubrication Index, and Finishing Index, with values for each category shown above the bars. The bars are arranged vertically and colour-coded for each index: yellow for Coating Index, blue for Fatigue Index, green for Lubrication Index, and grey for Finishing Index. Error bars are also present, indicating variability around the values. The Steel A2 section is labeled as (a), and the Steel H13 section is labeled as (b). Both sections flow from left to right, with the categories consistently represented across both types of steel. The y-axis ranges from zero to one.Performance indices following the surface texturing of A2 (a) and H13 steel (b) components manufactured via ADAM technology with various abrasives: (i) FBC – fine brown corundum, (ii) WC – white corundum, (iii) P – plastic shot, (iv) G – glass microspheres, (v) WS – walnut shell, (vi) BC – coarse brown corundum. The performance index (PI) is dimensionless (0 = worst, 1 = best)
Source: Authors’ own work
 The image features two bar graphs, each depicting the performance of different indices for two materials: 17-4 PH stainless steel on top (marked as part a) and Inconel below (marked as part b). The graphs compare four indices: coating index (shown in yellow), fatigue index (blue), lubrication index (green), and finishing index (grey). Each bar represents the average value for each index, with numerical values displayed above them. The y-axis ranges from zero to one, indicating the index values. The x-axis labels the indices across several categories: FBC, WC, P, G, WS, and BC for both materials. Error bars are included to represent the variability of data for each index. The layout allows for side-by-side comparison of the index values between the two materials.
Performance indices following the surface texturing of 17-4PH stainless steel (a) and Inconel (b) steel components manufactured via ADAM technology with various abrasives: (i) FBC – fine brown corundum, (ii) WC – white corundum, (iii) P – plastic shot, (iv) G – glass microspheres, (v) WS – walnut shell, (vi) BC – coarse brown corundum. The performance index (PI) is dimensionless (0 = worst, 1 = best)
Source: Authors’ own work
The image features two bar graphs, each depicting the performance of different indices for two materials: 17-4 PH stainless steel on top (marked as part a) and Inconel below (marked as part b). The graphs compare four indices: coating index (shown in yellow), fatigue index (blue), lubrication index (green), and finishing index (grey). Each bar represents the average value for each index, with numerical values displayed above them. The y-axis ranges from zero to one, indicating the index values. The x-axis labels the indices across several categories: FBC, WC, P, G, WS, and BC for both materials. Error bars are included to represent the variability of data for each index. The layout allows for side-by-side comparison of the index values between the two materials.Performance indices following the surface texturing of 17-4PH stainless steel (a) and Inconel (b) steel components manufactured via ADAM technology with various abrasives: (i) FBC – fine brown corundum, (ii) WC – white corundum, (iii) P – plastic shot, (iv) G – glass microspheres, (v) WS – walnut shell, (vi) BC – coarse brown corundum. The performance index (PI) is dimensionless (0 = worst, 1 = best)
Source: Authors’ own work
Additionally, an analysis of variance (ANOVA) was performed to evaluate the influence of the abrasive type and base material on the roughness parameters Ra, Rz, RSm and Rku. In addition, regression models were developed to establish predictive equations that describe the variation of these parameters based on the applied treatment. Table 7 presents the ANOVA results, with DOF representing the degrees of freedom associated with each input variable, while Table 8 shows the adjusted regression models for each of output roughness parameters.
Analysis of variance (ANOVA) coefficients
| Roughness parameter | Source | DOF | SC adjust. | MC adjust. | F-value | p-value |
|---|---|---|---|---|---|---|
| Ra | Material | 3 | 0.0112 | 0.00375 | 0.0 | 1.0 |
| Abrasive | 5 | 27.0287 | 5.40575 | 6.91 | 0.002 | |
| Rz | Material | 3 | 65.45 | 21.82 | 0.56 | 0.65 |
| Abrasive | 5 | 1597.99 | 319.6 | 8.19 | 0.001 | |
| RSm | Material | 3 | 244.9 | 81.65 | 1.65 | 0.22 |
| Abrasive | 5 | 820.4 | 164.08 | 3.32 | 0.032 | |
| Rku | Material | 3 | 0.4046 | 0.1349 | 0.45 | 0.721 |
| Abrasive | 5 | 1.6738 | 0.3348 | 1.12 | 0.392 |
Adjusted regression models for roughness parameter outputs
| Roughness parameter | Regression equation/model | R² adjusted (%) |
|---|---|---|
| Ra | Ra [µm] = 6.163 + 0.021 Materials type_17-4PH + 0.021 Materials type_A2 − 0.029 Materials type_H13 − 0.012 Materials type_Inconel + 0.712 Abrasive type_BC − 1.712 Abrasive type_FBC + 0.213 Abrasive type_G − 0.687 Abrasive type_P + 1.662 Abrasive type_WC − 0.188 Abrasive type_WS | 69.73 |
| Rz | Rz [µm] = 40.81 + 1.12 Materials type_17-4PH + 2.04 Materials type_A2 − 1.08 Materials type_H13 − 2.08 Materials type_Inconel + 7.46 Abrasive type_BC − 12.79 Abrasive type_FBC + 1.14 Abrasive type_G − 5.57 Abrasive type_P + 11.96 Abrasive type_WC − 2.21 Abrasive type_WS | 73.97 |
| RSm | RSm [µm] = 79.86–1.03 Materials type_17-4PH + 3.46 Materials type_A2 + 2.31 Materials type_H13 − 4.74 Materials type_Inconel + 4.89 Abrasive type_BC − 6.36 Abrasive type_FBC − 8.61 Abrasive type_G − 0.71 Abrasive type_P + 3.39 Abrasive type_WC + 7.39 Abrasive type_WS | 58.94 |
| Rku | Rku[ad.] = 3.713 + 0.088 Materials type_17 4PH + 0.121 Materials type_A2 + 0.004 Materials type_H13 – 0.212 Materials type_Inconel − 0.212 Abrasive type_BC + 0.013 Abrasive type_FBC – 0.113 Abrasive type_G − 0.362 Abrasive type_P + 0.362 Abrasive type_WC + 0.312 Abrasive type_WS | 31.65 |
Finally, the main effects plots corresponding to each of the abrasives used, their Mohs hardness, the mean abrasive particle size and the type of metal used were studied to evaluate the influence of each of these abrasive properties on the values obtained for roughness parameters Ra, Rz, RSm and Rku. The main effects plots are shown in Figure 8(a), 8(b), 8(c) and 8(d).
 The image consists of four line plots, designated as (a) to (d), each depicting the main effects of different factors on surface roughness measures Ra, Rz, RSm, and Rku respectively for S3 in micrometres (µm). Each plot features the x-axis representing parameters including HRC, abrasive type, Mohs hardness, and particle size in micrometres, while the y-axis indicates mean values. Data points are connected by lines for clarity, showing fluctuations in mean values based on the varying categories for abrasive types, which include BC, FBC, G, P, WC, and WS. The plots highlight the structured relationship between the variables, with repeated elements across them, making it easy to compare effects across the different measures.
Main effects plots of (a) Ra, (b) Rz, (c) RSm and (d) Rku, considering the effect of HRC hardness of the metallic material, the type of abrasive, the Mohs hardness of the abrasive and abrasive particle size
Source: Authors’ own work
The image consists of four line plots, designated as (a) to (d), each depicting the main effects of different factors on surface roughness measures Ra, Rz, RSm, and Rku respectively for S3 in micrometres (µm). Each plot features the x-axis representing parameters including HRC, abrasive type, Mohs hardness, and particle size in micrometres, while the y-axis indicates mean values. Data points are connected by lines for clarity, showing fluctuations in mean values based on the varying categories for abrasive types, which include BC, FBC, G, P, WC, and WS. The plots highlight the structured relationship between the variables, with repeated elements across them, making it easy to compare effects across the different measures.Main effects plots of (a) Ra, (b) Rz, (c) RSm and (d) Rku, considering the effect of HRC hardness of the metallic material, the type of abrasive, the Mohs hardness of the abrasive and abrasive particle size
Source: Authors’ own work
4. Discussion of the results
4.1 Values for the observed roughness parameters Ra, Rz, RSm and Rku on the top (S2) and lateral (S3) faces of the specimens
Table 6 presents the changes in surface roughness on the top (S2) and lateral (S3) faces of hexahedrons produced via ADAM after abrasive blasting. Aggressive abrasives like white corundum (WC) and brown corundum (BC) increased Ra and Rz values, indicating more pronounced surface peaks and valleys. In contrast, plastic media (P) and glass beads (G) smoothed the surface, reducing average roughness.
For RSm, walnut shell (WS) and plastic media increased peak spacing, while WC and BC created denser irregularities. Rku rose with more aggressive abrasives, showing sharper peaks, whereas milder media produced more uniform surfaces.
Lateral faces (S3) retained higher roughness than top faces (S2), suggesting they are less affected by blasting. Surface roughness variation also depended on material: H13 and A2 tool steels showed greater changes, 17-4PH was more stable and Inconel 625 showed minimal alteration due to higher abrasion resistance. These results confirm that abrasive choice strongly affects surface topography, with variations depending on both material type and surface orientation.
These patterns are explained by media morphology and hardness: angular abrasives (alumina) promote cutting/micro-ploughing and increase Rz, whereas spherical/softer media (shot/plastic) favor flattening/peening, lowering peak sharpness (↓Rku) and moderating Ra with less impact on RSm.
4.2 Specimen weight variation
Figure 5 illustrates the weight changes in hexahedrons after abrasive blasting, showing clear differences based on abrasive type and base material. Aggressive abrasives like white corundum (WC) and brown corundum (BC) caused greater weight loss than softer abrasives such as walnut shell (WS) and plastic media (P). This trend aligns with the higher Ra and Rz values seen in Tables 5 and 6, indicating stronger erosive effects from harder abrasives.
Substrate material also influenced weight loss: H13 and A2 steels experienced more weight reduction than 17-4PH stainless steel and Inconel 625, with the latter showing the least change, consistent with its known abrasion resistance. Finer abrasives like glass beads (G) and WS produced minimal weight loss, suggesting a gentler, polishing effect rather than material removal.
Interestingly, some samples treated with walnut shell (WS) showed slight weight gain, likely due to abrasive residue adhering to porous or rough surfaces, giving the appearance of increased mass.
Overall, weight loss (Δm, ‰) reflects impact intensity, but it does not universally predict Ra/Rz: it increases with erosive mechanisms (hard abrasives) and diminishes when polishing predominates (softer media).
Mass loss arises from the balance between erosion (micro-cutting) and impact-induced plasticity; harder/angular media maximize removal, whereas spherical media transfer plastic energy with less thickness reduction.
4.3 Roughness parameters and performance indices in top face (S2) and lateral face (S3) of the hexahedral specimens
The results show that optimal abrasive selection depends on the specific material of the part, as each responds differently to blasting. The appropriate treatment varies based on the intended functionality (finishing, coating, fatigue resistance or lubrication).
The following sections examine how each material reacts to blasting and evaluate their suitability for these targeted applications.
Figure 6(a) summarizes the results about the performance indices corresponding to each surface treatment applied on the specimen printed with A2 tool steel:
For coatings: G (0.75) and FBC (0.71) are recommended, as they produce homogeneous surfaces enhancing coating adhesion.
For fatigue resistance: FBC (0.61) and P (0.56) are suggested, as they reduce surface roughness maintaining uniform distribution. However, the values are at the lower limit of acceptability, indicating suboptimal performance.
For lubrication applications: WC (0.61) and WS (0.60) are recommended, as they generate surface textures with cavities suitable for lubricant retention. Nonetheless, their values are close to the minimum acceptable threshold, implying limited efficiency.
For general surface finishing: G (0.58) and WS (0.55) are advised, as they achieve better roughness reduction without compromising surface integrity. However, all values are relatively low, indicating that none of the treatments provides an optimal finish.
Overall, G and P (glass microspheres and plastic particles) have exhibited the best performance for coating applications, while the values for lubrication and fatigue resistance are less favorable.
On the other hand, Figure 6(b) presents the performance indices consequence of the surface treatments applied to H13 tool steel. The analysis reveals the following trends according to the intended application:
For coatings: FBC (0.95) and BC (0.71) are recommended, as they produce uniform surfaces that enhance coating adhesion. Both treatments yield highly favorable results.
For fatigue resistance: P (0.67) and WS (0.62) are suitable, as they reduce surface roughness maintaining uniformity. Although acceptable, these values do not reflect optimal performance.
For lubrication: WS (0.61) and WC (0.58) are advised, as they create surface textures with cavities favorable for lubricant retention. However, their performance is near the lower acceptable limit.
For general surface finishing: FBC (0.69) and BC (0.53) are preferred, offering better roughness reduction without compromising surface integrity. Still, overall values remain relatively modest for this parameter.
In summary, FBC (fine brown corundum) and BC (brown corundum) are the most effective treatments for coating applications, while P (plastic particles) and WS (walnut shell) perform best in terms of fatigue resistance. For lubrication and finishing, performance is generally less favorable.
Besides, Figure 7(a) shows the summary of the results concerning performance indices that have been determined in the case of 17-4PH stainless steel specimens treated with abrasives:
For coating applications: FBC (0.92) and P (0.73) are recommended due to their ability to produce homogeneous surface topographies that enhance coating adhesion. Both have exhibited highly suitable performance indices.
For fatigue resistance: FBC (0.61) and WS (0.56) are suggested, as they effectively have reduced surface roughness preserving a uniform topographical distribution. However, these performance values are at the threshold of acceptability, indicating adequate but suboptimal performance.
For lubricated applications: BC (0.55) and WS (0.53) are recommended, as they generated textured surfaces with cavities conducive to lubricant retention. Nevertheless, the associated performance values have been relatively low and exhibited limited optimization.
For overall surface finish quality: FBC (0.73) and P (0.50) are advised, as they contributed to significant roughness reduction without compromising surface integrity. However, the overall performance values remain modest, suggesting that none of the treatments achieve an optimal surface finish.
For 17-4PH stainless steel, fine brown corundum (FBC) and plastic particles (P) provide best performance in coating applications, with indices above 0.7. In contrast, other functionalities − fatigue resistance, lubrication and surface finish − show values at or below the acceptability threshold, reflecting limited technical effectiveness:
Finally, Figure 7(b) includes information about the performance indices obtained with each of the different surface treatments on Inconel specimens.
For coating applications: FBC (0.91) and G (0.72) are recommended due to their ability to produce homogeneous surface morphologies that promote effective coating adhesion. Both have shown acceptable performance levels when working with Inconel.
For fatigue resistance: P (0.67) and BC (0.58) are suggested, as they effectively reduced surface roughness while maintaining a uniform texture distribution. These values have been within acceptable operational limits.
For lubricated applications: WS (0.53) and WC (0.51) are recommended, as they produce surface textures with cavities favorable for lubricant retention. However, their performance indicators have been at the lower threshold of admissibility.
For overall surface finish quality: FBC (0.73) and WS (0.56) are advised, as they contributed to obtaining reduced roughness without compromising surface integrity. Nonetheless, the overall values have shown limited optimization of the original surface, indicating that none of the treatments fully meet optimal finishing standards.
In the case of Inconel, fine brown corundum (FBC) stands out as the most effective option improving coating adhesion, alongside glass microspheres (G), both showing performance indices above 0.7. However, treatments aimed at enhancing fatigue resistance, lubricant retention and surface finish yield values close to the threshold.
In the three metals analyzed, H13, 17-4PH and Inconel, fine brown corundum (FBC) demonstrated the best performance for coating applications, with performance indices ranging from 0.95 to 0.91. In the case of A2, the values obtained were less efficient, and only moderate results were achieved with FBC. This confirms its ability to generate homogeneous and clean surfaces that promote strong coating adhesion. This behavior is consistent with the observations of Croll, who showed that surface profiles with Rz values in the 15–40µm range maximize mechanical anchoring while concurrently retarding under-coating corrosion propagation (Croll, 2020). Glass microspheres (G) also yielded good results in A2 and Inconel (0.75 and 0.72, respectively), although with slightly lower consistency. Brown corundum (BC) showed favorable results in H13 and Inconel (0.71 in both cases), but not across all substrates. Plastic particles (P) delivered acceptable coating performance only in the case of 17-4PH (0.73).
Regarding fatigue resistance, plastic particles (P) and fine brown corundum (FBC) provided the best results, with indices ranging between 0.67 and 0.61 depending on the substrate. Although within acceptable ranges, these values are close to the lower threshold of suitability, likely due to residual roughness that may still contribute to crack initiation. This limitation echoes the mechanisms identified by Romanoetal., who showed that as-built surface asperities and near-surface porosity in LB-PBF 17-4PH act as dominant crack-nucleation sites and markedly curtail high-cycle fatigue life (Romano et al., 2020). For lubricant retention, walnut shell (WS) and white corundum (WC) consistently reached the highest values, with indices between 0.51 and 0.61, suggesting low effectiveness. Brown corundum (BC) also yielded comparable values in 17-4PH (0.55).
With respect to general surface finishing, FBC showed relatively superior performance across all materials (from 0.69 to 0.73), followed by glass microspheres (G) in specific cases. However, no treatment consistently exceeded the 0.73 threshold, indicating that additional processes, such as polishing, may be required to achieve optimal surface finishing.
Figure 9 summarizes the outcomes obtained for the various performance indices in a visual format.
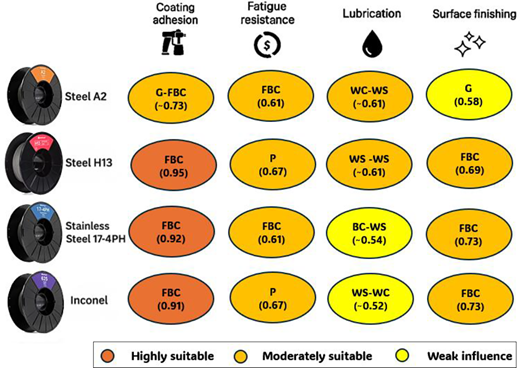
Infographic illustrating the correspondence between the materials fabricated using ADAM technology and the associated performance indices for the different abrasive treatments: (i) FBC – fine brown corundum, (ii) WC – white corundum, (iii) P – plastic shot, (iv) G – glass microspheres, (v) WS – walnut shell and (vi) BC – coarse brown corundum
Source: Authors’ own work
Infographic illustrating the correspondence between the materials fabricated using ADAM technology and the associated performance indices for the different abrasive treatments: (i) FBC – fine brown corundum, (ii) WC – white corundum, (iii) P – plastic shot, (iv) G – glass microspheres, (v) WS – walnut shell and (vi) BC – coarse brown corundum
Source: Authors’ own work
The index readout reflects established functional criteria: coating improves with Rz within a window (anchorage without over-profiling), lubrication requires sufficient RSm for retention, finish penalizes high Ra and fatigue benefits from moderate Rku (fewer sharp peaks). Differences among alloys stem from their hardness and sintered microstructure: harder substrates resist cutting (less removal, more contained Rz), whereas more ductile matrices flatten peaks and reduce Rku under spherical media.
4.4 Statistical analysis: analysis of variance, regression models and main effects
The two-factor ANOVA indicates that abrasive type is the primary determinant of roughness (Ra and Rz), with significant main effects (see p-values in Table 7), whereas alloy type was not significant at α = 0.05. Under fixed blasting parameters, this suggests that the final topography is dominated by the interaction of the abrasive medium with the surface morphology rather than by metallurgical differences among A2, H13, 17-4PH and Inconel 625. The abrasive × alloy interaction was weak/nonsignificant, so the trends across abrasives remained consistent across alloys.
The ANOVA showed that abrasive type is the primary determinant of surface roughness: it is highly significant for Ra and Rz (p < 0.05; F = 8.19 for Rz), moderate for RSm (p = 0.032) and nonsignificant for Rku (p = 0.392). By contrast, the base alloy had no statistical influence on any of the four parameters. Regression models confirm this pattern. The fit is excellent for Rz (adjustedR2 = 73.97%) and strong for Ra (69.73%); it drops for RSm (58.94%) and is weak for Rku (31.65%). Model coefficients reveal that white corundum (WC) and brown corundum (BC) raise peak-to-valley height, whereas fine brown corundum (FBC) and plastic shot (P) lower it. The lower predictive power for RSm suggests the presence of additional, unaccounted-for factors, such as intrinsic variability in the blasting process. Normal probability plots show normally distributed standardized residuals, ruling out the presence of outliers and supporting the adequacy of the models used.
Main-effects plots in Figure8(a), 8(b), 8(c) and 8(d) show that base-metal hardness (7–50HRC) scarcely affects average roughness: Ra stays near6µm and Rz between 40 and 45µm. Abrasive type, however, is critical. White and brown alumina (WC,BC) produce the roughest surfaces, whereas fine brown alumina (FBC) lowers Ra–Rz to approximately 4.5µm; the lowest values occur with approximately 3Mohs abrasives, although mid-sized particles (250µm and 800µm) raise roughness again. Mean peak spacing (RSm) rises with substrate hardness, from 74µm in Inconel (7HRC) to 85µm in A2 (50HRC). BC and walnut shell (WS) widen RSm (approximately 86µm), while FBC and glass beads (G) shrink it (approximately 71µm); maxima appear with very soft abrasives (2Mohs) and large particles (800–1000µm). Kurtosis (Rku) behaves differently: metal hardness has no clear effect, but abrasive type does. WC yields the highest Rku (approximately 3.8); glass beads and plastic shot (P) the lowest (approximately 3.1–3.2). Kurtosis peaks at approximately 3.6 with 9Mohs abrasives and dips to approximately 3.1 at 3Mohs; particle size matters as well. 250µm sharpens peaks (Rku approximately 3.7), whereas 800µm smooths the profile (Rku approximately 3.1). It must be noted that HRC hardness values have been taken from the filament manufacturer’s data sheets (Markforged Holding Corporation, 2025b).
It should be noted that the dominant influence of abrasive type on the explained variance can be attributed to impact physics, where particle shape, hardness and size govern the removal mechanism, while material and orientation act primarily as modulators of this process.
Looking ahead, there are precedents that present new artificial intelligence-based roughness prediction frameworks by fusing internal and external signals, which would complement the results obtained by regression models and thus expand generalization (Wang et al., 2025).
4.5 Limitations of the study
This study was conducted with a compact design (n = 3) and a constant blasting time. This is sufficient to capture trends, although not very fine effects. Generalization to other geometries and parameters requires confirmation. Next steps could focus on increasing n, varying blasting times and validating on more complex geometries.
5. Conclusions
This study assessed the impact of abrasive blasting on the surface roughness of metallic components manufactured via ADAM technology. Four metallic materials and six abrasive types were examined, enabling the identification of the most suitable abrasive-material combinations based on application-specific requirements. The key findings by material are:
A2 Tool Steel: This material exhibited high sensitivity to surface modification through abrasive blasting. Roughness parameters Ra and Rz have increased significantly when exposed to aggressive abrasives such as white and brown alumina. Correspondingly, mass loss has been relatively high, indicating substantial material removal.
H13 Tool Steel: While also affected, this steel has shown a less pronounced increase in roughness compared to A2. Weight variation has been evident, suggesting moderate wear posttreatment.
17-4PH Stainless Steel: This alloy has demonstrated relative stability in surface roughness following blasting, with lower variation in roughness and mass loss compared to tool steels. These results suggest improved resistance to abrasive wear.
Inconel 625: This material was the most resistant to abrasive blasting, maintaining nearly constant roughness and mass. Its high resistance to abrasion has made it the least prone to topographical alterations. Inconel 625, the material with the lowest HRC hardness, is the most resistant to surface modifications because of abrasives.
Regarding the performance indicators:
Coating adhesion: Fine brown alumina (FBC) achieved the most favorable results across all tested metals.
Fatigue resistance: Plastic media (P) and fine brown alumina (FBC) have delivered acceptable performance, though the values have remained close to the lower limit of admissibility.
Lubricant retention: White alumina (WC) and walnut shell (WS) have generated surface textures conducive to lubricant retention, albeit with limited efficiency.
Surface finish: FBC and glass beads (G) lowered peak-to-valley dispersion; nevertheless, the resulting finish is still inadequate for highly demanding applications.
Statistical analysis confirmed that abrasive type is the dominant factor, accounting for about 74% of the variance in Rz and about 70% in Ra (ANOVA). Alloy composition was not significant, although material hardness did influence RSm. Fine brown corundum and glass beads yielded the lowest peak-to-valley dispersion; nevertheless, the resulting finish was still insufficiently smooth for highly demanding applications.

