To support the operational safety and lightning protection design of high-speed maglev railways, this paper quantitatively evaluates how suspension height and operating speed influence lightning susceptibility. It characterizes trends of the critical background electric field with respect to these two variables, tracks the evolution of surface hotspot distributions and identifies dominant attachment locations and their sensitivity.
A coupled procedure of “electrostatic field–aerodynamic flow field–scaled assessment” is proposed. The electrostatic model provides surface field-enhancement factors and their spatial distribution, while turbulent-flow simulations characterize near-wall density variations induced by speed. Under a unified leader height, a critical criterion based on a density-scaled breakdown field maps these two fields to a train-wise critical background electric field. Representative regions (nose, roof and bottom or tail) are used to build statistical metrics for hotspot migration and dominance with speed.
Increasing suspension height weakens electric-field coupling to ground, raises the critical background-field threshold and reduces the relative contribution of bottom and edge regions. At the same suspension height, a rigidly grounded train has a lower critical threshold than an electrically floating one. Within 0–500 km/h, the train-wise threshold decreases slowly with speed. Region-wise, roof-tail and bottom-mid sections show a decreasing trend with speed, while the nose stagnation point increases slightly; over the entire speed range, the dominant region remains the roof-tail section.
Within a unified framework, suspension height and operating speed affect lightning attraction through two distinct channels. Suspension height mainly modifies the threshold and hotspot distribution by changing geometric polarization, whereas speed alters discharge-initiation difficulty through aerodynamically induced density variations. The framework evaluates these effects separately and in combination, explaining the slow variation of the global threshold and the subtle evolution of hotspot locations and providing a physics-based reference for lightning protection design and operational safety assessment of high-speed maglev railway systems.
1. Introduction
Maglev trains, relying on contactless levitation and linear motors, overcome the adhesion limit of wheel–rail systems. Within the speed range between conventional rail and civil aviation, they offer higher cruising speeds, low wear, and superior ride comfort, and are becoming an important option for trunk corridors and metropolitan commuting (Xiong & Deng, 2021). For a mass-transit system operating with high passenger volumes and long service times, safety requirements involve not only traction, braking, and control reliability, but also immunity to natural electromagnetic environments. Lightning is one of the external threats with relatively high occurrence frequency and potentially severe consequences. Long-span bridges, catenary systems, and the train body itself distributed along thunderstorm-prone corridors all participate in the selection and sustaining of lightning channels. Accordingly, studying the lightning-attraction characteristics of maglev trains is both necessary and urgent (NASA, 2023; Cai, Du, Peng, Zhou, & Wang, 2024).
Compared with conventional wheel–rail trains, high-speed maglev trains exhibit two prominent differences. First, the train is fully levitated relative to ground: the carbody potential is no longer rigidly clamped to ground potential through the wheel–rail system, but is mainly determined by the capacitance and stray resistance formed across the levitation gap. Second, the train operates at high speed near the ground, with a streamlined multi-curvature outer shape and significant pressure and density gradients, such that both the electrical boundary and the aerodynamic environment jointly shape the discharge initiation conditions. This combined feature is essentially different from the classical long-gap discharge assumption of a “well-grounded, stationary structure.” In contrast, a conventional wheel–rail train typically provides a low-impedance return path through the wheel–rail system, which is closer to a “well-grounded” electrical boundary. In the present framework, this wheel–rail-like limit is represented by the grounded boundary case and serves as a bounding reference for comparison with the electrically floating (levitated) maglev condition.
Existing observations and models have shown that highly curved parts of a moving conductor can trigger upward leaders and evolve into “triggered lightning,” an understanding that has been incorporated into lightning launch and flight-avoidance criteria in space launch and aviation operations (Yoshikawa & Ushio, 2019; Pavan et al., 2020). Furthermore, recent experimental and theoretical studies indicate that, compared with a well-grounded conductor, a floating or poorly grounded conductor does not maintain a fixed potential; instead, it develops a self-bias due to the coupling between the external electric field and ionic current. This modifies the surface charge distribution and local peak electric field, thereby influencing the breakdown threshold and channel selection in long air gaps. Introducing floating conductors reduces the equivalent breakdown voltage, shortens the discharge time, and shifts the connection path, mechanisms that are closely related to the coupling between induced potentials and space charge (Gao et al., 2021; Wu et al., 2022). Under conditions of “isolated electrodes plus incoming wind field,” the scaling of corona–threshold relationships also differs significantly from that of grounded systems (Guerra-Garcia, Nguyen, Mouratidis, & Martinez-Sanchez, 2020).
From an engineering perspective, the issues of touch current and electrostatic discharge in road vehicles—quasi-floating conductors—and the associated national standards further support the consensus that “floating or poorly grounded conditions will modify hotspots and thresholds” (GB/T 19951-2019, 2019). In maglev scenarios, existing experimental and numerical studies on medium-speed maglev have revealed the influence of levitation boundary conditions and carbody curvature on lightning attachment paths and hotspot distributions. However, these studies mostly focus on grounding configurations and medium-speed conditions, and lack systematic quantitative characterization of additional effects introduced by the aerodynamic density field at high speeds (Yang, Wang, Pan, & Xiong, 2024).
On the other hand, high-speed motion modifies local pressure and gas number density via aerodynamic effects. According to similarity laws for gas discharge, the critical reduced electric field can be regarded as approximately constant under fixed gas composition and temperature. Therefore, the discharge initiation threshold field is expected to decrease in low-pressure, rarefied regions and increase in stagnation high-pressure regions. This assessment is systematically supported by recent reviews on streamer and leader discharges (Nijdam, Teunissen, & Ebert, 2020; Komuro, Kitamori, & Sakai, 2025). Following the chain of “speed → pressure and density field → initiation conditions,” numerical–experimental studies on airfoils and rotating blades have coupled computational fluid dynamics (CFD)-derived surface density distributions with upward-leader initiation criteria and observed that the effective triggering height or triggering threshold is significantly reduced in low-pressure regions, with relatively small changes in high-pressure regions. Methodologically, this validates the feasibility of characterizing “motion-induced changes in lightning susceptibility” via “density-rescaled critical applied fields” (Yang, Shi, Wen, Yuan, & Zhang, 2025; Yu, Li, Zhao, & Siew, 2022; Woo et al., 2024).
In summary, the levitation boundary and high-speed aerodynamics influence the lightning behavior of moving conductors through two separate channels: “geometric polarization” and “medium scaling.” High-speed maglev trains combine both “levitation” and “high speed.” Existing literature has separately pointed out that each of these features alone can affect lightning susceptibility; however, to date there is still a lack of systematic work that, under a unified assessment framework, simultaneously quantifies the impacts of both factors for high-speed maglev trains (Yan, Wang, Sun, & Li, 2023).
Motivated by this, the present paper proposes and implements a comprehensive evaluation method tailored to maglev scenarios. The method jointly considers levitation boundary conditions, density similarity laws, and speed-dependent density distributions obtained from CFD, and couples them with leader-initiation criteria. Under both grounded and floating conditions, the critical background field is rescaled to quantify how hotspot locations and threshold levels vary with operating speed and levitation gap. Compared with existing work, the main contributions of this paper are:
Under a quasi-electrostatic approximation, it explicitly introduces the perspective of “mutual capacitance to ground–image charges,” and quantifies the influence of suspension height and grounding mode on polarization strength using unified enhancement factors and threshold scaling.
It adopts a layered electrostatics (ES)–computational fluid dynamics (CFD) coupling (ES–CFD) strategy to incorporate the speed-induced density field into an E/N-based scaling framework, establishing a quantitative relationship between operating speed and the critical background field.
Through regional statistics and hotspot-migration criteria, it analyzes the evolution of thresholds and hotspots from the three levels of “whole train–regions–hotspots,” providing reproducible baseline data and analysis procedures for subsequent high-fidelity 3D models and cross-scenario comparisons.
2. Research object and basic assumptions
This work focuses on discharge initiation and the pre-attachment stage of a high-speed maglev train subjected to a thunderstorm background electric field. The key variables studied are suspension height (train–ground gap) and operating speed (through its influence on the near-wall aerodynamic state), and their effects on the critical threshold and hotspot distribution. The emphasis is on the relative changes in lightning susceptibility rather than the absolute lightning probability or the full time-domain evolution of the discharge channel.
To maintain physical relevance while controlling complexity, the geometric model adopts a two-dimensional abstraction close to the real outer shape: a representative longitudinal cross-section is extracted, and the carbody shell is treated as a continuous, smooth, perfectly conducting boundary. Roof-mounted equipment, small appendages on the underside, and cables are neglected. This idealization is adopted to enable consistent parametric comparisons across suspension height and operating speed with affordable computational cost in the coupled ES–CFD workflow. We acknowledge that three-dimensional features (e.g. roof-mounted equipment, underbody appendages, and longitudinal curvature changes) can locally perturb both the aerodynamic field and the surface electric-field enhancement, potentially creating additional localized hotspots. Therefore, the present results should be interpreted as baseline, trend-focused findings for the idealized carbody cross-section, rather than a full representation of a specific train with detailed 3D fittings. With this simplification, within the present 2D framework, the dominant features of the surface field are determined by large-scale curvature and the coupling to ground, which highlights the roles of suspension height and operating speed. The surface is divided according to geometric and flow characteristics into representative regions: nose, roof-mid, roof-tail, bottom-mid, and tail-bottom edge. These regions are used for regional statistics and hotspot-migration identification. A hotspot is defined as the location of the extreme value of the surface normal electric field for a given operating condition. Transitions of the hotspot between regions reflect the migration of potential first attachment points.
The environment and boundary conditions are defined in a unified way. The background electric field is approximated as a uniform quasi-static vertical field established by the thundercloud–ground system. The ground is modeled as an equipotential reference plane (zero potential). The air state is characterized by the near-wall flow driven by speed; background meteorological parameters (temperature, humidity, atmospheric pressure) are taken as typical constants, and the slow evolution of thunderstorms is not considered. To ensure comparability among different conditions, the leader approach is represented in a stage-wise manner by prescribing the leader-tip height Y. Each specified Y is treated as an independent snapshot (rather than a time-marched stochastic stepped-leader process), which is consistent with the fact that negative leaders develop in discrete steps with short inter-step intervals, while the electric-field redistribution around conductors can be regarded as quasi-instantaneous at each stage. Only the suspension height and speed are varied; other geometric and environmental parameters are kept constant. Within the adopted E/N -based similarity framework, moderate atmospheric departures (e.g. pressure/temperature) can be approximately incorporated through density rescaling via the molecular number density N (to first order ), while humidity-dependent chemistry and wet-surface effects (rainfall/icing) are beyond the present scope.
The main output metric is defined as the critical background electric field, namely the minimum external background field required for at least one point on the carbody surface to just satisfy the leader-initiation condition. To resolve its internal structure and mechanisms, the analysis further includes maximum surface field-enhancement factors, maximum normal electric fields, regional thresholds, and hotspot locations. These quantities are recorded at both whole-train and regional scales to track hotspot migration with suspension height and speed, and to identify changes in the dominant region.
The research scope is limited to relative changes in thresholds and hotspot patterns and their physical interpretation. The threshold evaluation is carried out under a quasi-static electric-field approximation and is formulated as a conditional, stage-wise susceptibility threshold valuated at prescribed leader stages. Accordingly, the present results should not be interpreted as a full time-dependent attachment probability, and the stochastic time-marching of stepped-leader progression (including branching), the transient evolution of leader-channel potential, and space-charge/streamer dynamics in the final attachment are not explicitly resolved. The full time-varying evolution of the return-stroke channel and the transient response of onboard electrical systems are not considered. Complex conditions such as rainfall, icing, and pollution layers are excluded, and no probabilistic assessment of lightning incidence is performed. Within these assumptions, different suspension heights and speeds can be compared under a unified framework, providing a basis for subsequent higher-fidelity 3D models and experimental studies.
3. Influence of suspension height on lightning attraction characteristics
3.1 Mechanism and theoretical framework
Under typical thunderstorm conditions, a cumulonimbus cloud usually exhibits a vertically layered charge structure of upper positive charge, middle negative charge, and lower secondary positive charge. As a result, the cloud–ground system establishes a quasi-static vertical background electric field above the ground surface. When the field at the cloud base gradually intensifies and a downward leader forms, the leader advances toward the ground in a stepped manner, and its far field can be approximated, on the scale of the train, as a quasi-static electric-field source. For a high-speed maglev train, within the millisecond time scale of each step of leader development, the electromagnetic interaction among the carbody, the ground, and the leader can be treated using a quasi-static electric-field approximation: the carbody geometry and its coupling to ground determine the spatial distribution and peak value of the surface normal electric field, while the train suspension height (denoted by g) changes the degree to which the cloud far field “polarizes” the train through the strength of its coupling to ground, thereby affecting the lightning-attraction characteristics.
Under the superposition of the applied uniform background field and the quasi-static field of a remote leader, the train body can be regarded as a conductor located above a conducting plane. The suspension height modulates the surface charge density and the normal electric field through a “mutual capacitance to ground–image charge” mechanism: if a local part of the train body is approximated as a cylindrical conductor of radius above the ground, the per-unit-length mutual capacitance to ground can be approximated as
which increases monotonically as decreases (with logarithmic sensitivity). This implies stronger image charges and an increase in the normal electric field at the car bottom, lower edge and tail-bottom regions. The overall field-enhancement factor
and its maximum value therefore increase accordingly. The critical background field defined in electrostatic terms is
where the maximum field-enhancement factor is
Thus, under otherwise identical conditions, reducing lowers , making lightning initiation easier. Because the dependence of on has only logarithmic sensitivity, reducing from 0.4 m to 0.2 m (halving the gap) typically increases by only a few percent. The boundary condition also affects the strength of polarization: grounding pins the train-body potential at 0, allowing the applied field to more effectively drive the accumulation of induced charge and generally raising the surface and ; an electrically floating boundary, in contrast, enforces a “zero net charge” constraint so that the train-body potential adjusts self-consistently with the external field, weakening the degree of polarization to ground. The leader height Y modifies the near-field contribution of the leader to the train body, thereby adjusting the field distribution and hotspot location at different stages, but for a given Y the relationships above remain unchanged.
3.2 Numerical model and evaluation metrics
To verify the above mechanism, an electrostatic model based on COMSOL Multiphysics (COMSOL AB) is established. In the geometry, the carbody is modeled as a conducting structure above a conducting ground plane. The background field is a uniform vertical electric field , with the upper boundary applied with
(in this example = 2kV/m, = 500m).The side boundaries are set as electrically insulating/symmetric. The downward lightning leader is approximated as a remote electrostatic source, and its approaching process is represented by the leader-tip height parameter Y, denoting the instantaneous distance from the leader tip to the ground. The solution at each specified Y is obtained independently as a quasi-static snapshot, rather than by time-marching a stochastic stepped-leader process. Unless otherwise specified, parametric comparisons of different suspension heights and boundary conditions are made for a representative snapshot Y = 280m. Two types of boundary conditions are considered for the carbody: grounded (carbody potential fixed at 0) and electrically floating (net charge on the carbody constrained to zero, with its potential determined self-consistently by the external field).
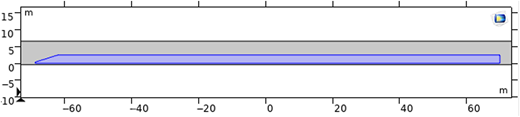
On selected surface sets of the carbody, the normal electric field, the field-enhancement factor, and the maximum field-enhancement factor are computed. To avoid numerical spurious peaks, the mesh is refined in high-curvature regions such as the nose, lower edge, and tail-bottom, and isolated abnormal points are removed by neighborhood smoothing and consistency checks of local extrema. The maglev-train model is shown in Figure 1.
In terms of metric selection, on the one hand the train-wise and the corresponding are used to describe the overall polarization strength and critical threshold; on the other hand, the maximum normal electric field and the local peak values of the enhancement factor in each region are compiled to analyze how changes in suspension height affect hotspot distribution and regional contributions, providing a baseline for subsequent coupling with speed effects.
3.3 Results and analysis
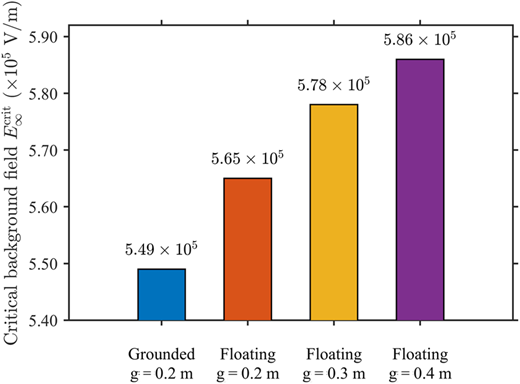
For the representative electrostatic snapshot at leader height Y = 280 m, when the train suspension height is reduced from 0.4 m to 0.3 m and 0.2 m, the corresponding maximum field-enhancement factors for the electrically floating cases are 1.3009, 1.3072, and 1.3265, respectively; for the grounded case, the value is 1.3663. The results are shown in Figure 2.
Since the critical background field approximately satisfies
Reducing g from 0.40 m to 0.20 m increases by 2.0%, corresponding to an approximately 1.9% decrease in ; under the same condition of g = 0.20 m, changing the carbody boundary from floating to grounded produces a further 3.0% increase in , with the corresponding threshold decreasing by about 2.9%. From a comparative perspective, a conventional wheel–rail train is generally closer to the “grounded” limit because the wheel–rail system provides a low-impedance electrical return path; therefore, the grounded case here can be regarded as a wheel–rail-like bounding reference under the same simplified cross-sectional geometry and leader stage. In contrast, the levitated maglev case corresponds to the electrically floating limit. This implies that, for the same geometry and leader snapshot, levitation-induced weakening of ground coupling can increase by roughly ∼3% relative to a well-grounded wheel–rail-like boundary. In absolute terms, these changes are at the “percentage-point level”, but given the large intrinsic scatter of long-gap discharges and the safety margins typically added in engineering criteria, threshold differences of this magnitude are already sufficient to alter the judgment of whether the system has entered a hazardous regime: for example, when the cloud–ground field is close to the critical value, a small reduction in may shift the train from a “non-triggering” state to one that “meets the conditions for triggering.”
By gradually reducing the height Y of the downward lightning leader from 280 m to 20 m, corresponding to the process in which the leader approaches the ground from far to near, one can observe how the effect of suspension height manifests at different stages of development. In the mid-to far-field stage ( m), the leader's contribution to the carbody is closer to a “perturbation of a uniform applied field”, and the overall field pattern is mainly determined by the background field and the mutual-capacitance-to-ground mechanism. In this regime, the trend of “smaller g, larger ” is most evident, and the sensitivity of to g remains in the range of 1.5–3.1% (with the corresponding reduction in being about 1.4–3.0%). As is further reduced to 50 m and 20 m, the leader enters the near-field stage. Its strong local distortion directly elevates the vertical electric field around the roof and nose, so the field strength in the upper regions increases significantly, while the differences introduced by coupling to ground are partially “diluted” in the global extrema, manifested as a compression of the relative differences among the various g. Overall, suspension height mainly affects the “overall susceptibility level when the leader is still relatively high,” whereas in the final stage, when the leader has already approached the ground and local field distortion becomes dominant, the influence of suspension height on the global threshold still exists but is numerically much weaker.
The hotspot-migration results provide more detailed spatial information to support the above judgment. For the same leader height, at Y = 20, 50, 150, 200 and 280 m the hotspots of all four conditions are located near the sharp tail of the roof. This indicates that, both in the initial stage of leader development and in the late stage close to breakdown, the field advantage of the upper high-curvature region remains strong enough to suppress the perturbations caused by differences in suspension height and coupling to ground. A pronounced exception occurs only at the intermediate height Y = 80 m, as summarized in Table 1.
In the grounded case, the hotspot remains at the rear of the roof, whereas in all three floating cases it shifts collectively to the nose-tip region and its axial coordinate increases approximately linearly with g. This suggests that, at this height, the near field of the leader tip and the image charges on the carbody superimpose and, in the floating cases, couple more strongly into the local “nose–lower edge–ground” system, so that the local polarization near the nose temporarily exceeds that of the rear roof section. In the grounded case, by contrast, the carbody potential is strictly pinned at 0, so the additional near-field contribution of the leader is mainly superimposed on the already most sharply curved rear roof section and fails to trigger a forward shift of the hotspot. From the perspective of the “evolution path”, this result indicates that, even when final breakdown is still typically controlled by the rear roof section, there may exist intermediate stages in which the nose first satisfies the local initiation condition but does not develop into the final channel. Moreover, suspension height and the boundary condition to ground not only adjust the overall threshold, but also change the “competitive ranking” of different regions at various stages of leader development, providing a basis for subsequent time-domain models that consider scenarios with multiple competing initiation points.
In summary, by modifying the strength of polarization to ground, suspension height influences lightning-attraction characteristics on three levels:
Whole-train level: The smaller the suspension height and the better the grounding, the larger the overall field-enhancement factor and the lower the critical background field required for lightning initiation, making lightning attachment statistically more likely.
Regional level: Suspension height alters the relative importance of regions such as the bottom and tail-bottom. As g decreases, the field strength in regions closer to the ground (bottom, tail-bottom) is elevated, and these regions evolve from “always secondary risk zones” into locations that, under certain operating conditions, may compete with the rear roof section for the hotspot.
Leader-development level: Suspension height also affects the field pattern and hotspot distribution at different stages of leader development through its coupling with the evolution of leader height Y. When the leader is at a relatively high position, polarization to ground dominates and differences in suspension height are most pronounced; as the leader approaches the ground and local field distortion becomes stronger, threshold differences among different g values are numerically compressed, but may still give rise, in intermediate stages, to local phenomena such as a temporary forward shift of the hotspot toward the nose.
4. Influence of operating speed on lightning-attraction characteristics
4.1 Mechanism and theoretical framework
Under an externally applied uniform background electric field , the local electric field on the carbody surface satisfies
Where is the surface field-enhancement factor determined by the geometry and the boundary condition to ground. The inception threshold of gas discharge scales with the reduced electric field E/N. For a given temperature, the critical reduced field can be regarded as approximately constant, so the inception field satisfies
where N is the molecular number density and is the air density (to first order, under standard conditions). This E/N-based similarity law and its applicability over varying air densities have been widely discussed in streamer/leader literature (Nijdam et al., 2020; Komuro et al., 2025).On this basis, we define, for a given surface point x, the required critical background field as
where and are the inception field and density in the reference state. The train-wise critical background field can then be written as
The dependence on speed arises from the variation of , whereas is, to first order, nearly independent of speed (the carbody geometry and electrical parameters do not change with U, and in a quasi-static electric field the conductivity of the gas is far smaller than that of the metal).
Accordingly, high-speed operation modifies through the flow-induced pressure/density distribution (which can be described by the pressure coefficient ):
Accordingly, local overpressure (stagnation) tends to increase the required critical background field, whereas local low-pressure regions reduce it, making upward-leader initiation easier.
This paper compares the differences in lightning-attraction characteristics that arise solely from changing the operating speed U under identical external and boundary conditions. Considering that lightning-leader development occurs on the order of microseconds, whereas the convective evolution of the density field (determined by ) is on the order of milliseconds, the steady-state corresponding to each speed can, during leader development, be treated as a quasi-static “frozen” snapshot and combined with to evaluate and .
4.2 Numerical model and evaluation metrics
This section adopts a layered “ES + CFD coupling” strategy for the evaluation:
ES layer: The steady-state distribution of is computed in the electrostatic model, with the carbody geometry and boundary conditions kept identical to those in Section 2.
CFD layer: For a sequence of speeds U [0.500] km/h, the three-dimensional flow field around the carbody is numerically solved, and the surface density is extracted on the carbody. To balance accuracy and computational cost, a steady-state turbulence model is used to handle the high–Reynolds number flow. The boundary conditions specify the far-field inflow velocity and static pressure, while the ground is treated as a moving wall in the same direction as the carbody, approximating the physical scenario of a “moving train with air at rest” in the ground-fixed frame.
Criterion and regionalization standard: The ES-layer and CFD-layer are coupled via
and the minimum over the whole surface is taken to obtain . At the same time, regional indicators are extracted by taking, for each region (nose, roof mid-section roof_mid, roof tail-section roof_tail, bottom mid-section bottom_mid, and tail-bottom tail_bottom), the extrema
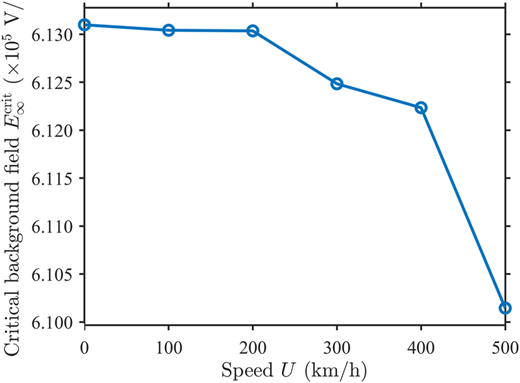
Numerical resolution and interpretation of sub-percent variations. Because the density field (CFD) and the field-enhancement factor (ES) are obtained from separate models and coupled through the MATLAB (MathWorks) post-processing, the practical numerical resolution of the coupled workflow is influenced by (1) ES discretization in high-curvature regions, (2) near-wall resolution and turbulence-model closure in CFD, and (3) post-processing procedures used to extract surface extrema for hotspot identification. To quantify the resolution relevant to the train-wise result in Figure 3, a representative mesh-sensitivity check was performed for the coupled workflow (Table 2). For the floating case at g = 0.2m, the train-wise differs by 0.17% at U = 0 km/h and 0.12% at U = 500 km/h between the medium and fine meshes. Therefore, train-wise changes at the sub-percent level are interpreted as minor, second-order trends rather than standalone engineering margins. The globally controlling region of the train at a given speed U is then defined as the region with the smallest . By comparing the slopes and intersection points of the regional curves, one can analyze whether hotspots migrate across regions and how the center of risk shifts with speed.
4.3 Results and analysis
Within the investigated speed range (0–500 km/h), the train-wise critical background field decreases monotonically with speed, as shown in Figure 3. The total reduction between 0 and 500 km/h is below 0.5%. However, in view of the practical numerical resolution of the coupled workflow (mesh-sensitivity level of about 0.12–0.17% for train-wise ; Table 2), this whole-train variation should be regarded as a minor, second-order trend and should not be over-interpreted as a standalone engineering margin. Consistent with the density-scaling mechanism, the speed effect becomes more informative when examined at the region-wise level and in terms of hotspot competition (see Figure 4).
For the present geometry and suspension height, this slight increase in lightning susceptibility is mainly driven by speed-induced changes in the air-density field , whereas the surface enhancement factor can, to first order, be regarded as independent of speed. Hence the speed sensitivity of can essentially be interpreted as a “density-scaling sensitivity”:
That is, it is controlled by those regions where the density is most sensitive to speed and where is already relatively large.
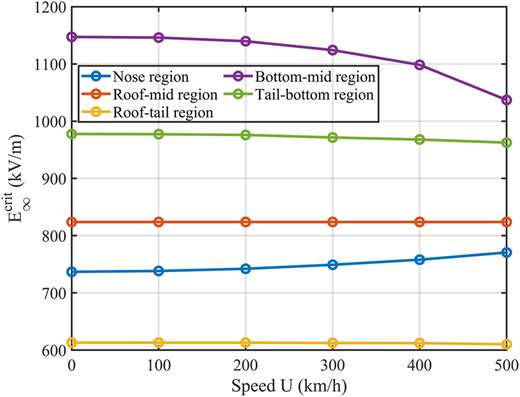
The region-wise results, as shown in Figure 4, indicate that the roof-tail section (roof_tail) remains the “controlling region” over the entire speed range: its regional critical background field decreases slightly with speed, by about 0.47%, which is essentially the same magnitude as the change in the train-wise critical background field. This implies that, for the present geometry, the roof-tail region both exhibits the highest geometric enhancement and lies in a low-pressure zone that is moderately sensitive to speed (); the combination of these two factors makes it firmly the “most easily initiated” region at both low and high speeds.
In contrast, the nose stagnation region (nose) exhibits the opposite behavior. Numerical results show that its critical background field increases by about 4.4% with speed, displaying the trend that “the higher the speed, the more difficult initiation becomes.” This is consistent with its aerodynamic nature as a typical stagnation overpressure zone: as speed rises, local dynamic pressure is converted into higher static pressure, causing to increase and, via the scaling, raising the inception threshold. In other words, from the perspective of lightning attachment, the nose becomes electrically somewhat safer at high speeds, whereas the mid–rear roof and bottom regions, where the pressure drop is stronger, bear the additional risk. This has implications for the engineering layout of lightning receptors/down conductors: if artificial lightning-attraction devices are to be installed on the carbody in the future, an arrangement that overemphasizes the nose while neglecting the roof-tail region may not be consistent with the “natural risk distribution.”
The mid-roof region lies on a relatively flat pressure plateau; its distribution varies little with U, and the corresponding and regional critical background field are almost insensitive to speed, with the curve slope close to zero. This result indirectly supports the conclusion that “speed effects are mainly concentrated in strong overpressure/low-pressure zones,” and also indicates that for geometrically smoother sections, the influence of speed can be treated as a second-order effect within the present speed range.
By contrast, the bottom-mid (bottom_mid) and tail-bottom (tail_bottom) regions exhibit the typical “high-speed low-pressure—easy initiation” behavior. In the bottom-mid region, the regional critical background field decreases significantly by about 9.5% with speed, with a steeper drop at the higher end of the speed range, demonstrating its high sensitivity to speed; in the tail-bottom region, it decreases slightly by about 1.5%, lying between the roof-tail and bottom-mid regions. Flow-field analysis shows that, at high speeds, the streamlines beneath the train become more attached and strongly accelerated, producing pronounced local negative pressure and a substantial drop in air density. Such “hidden” low-pressure zones are difficult to reveal in traditional electrostatic analyses that consider only geometric curvature, but once coupled with the E/N-based density scaling (Section 4.1), they translate into a tangible reduction of the inception threshold.
It is worth noting that although the bottom-mid region exhibits the largest threshold reduction at high speeds, its value still does not fall below that of the roof-tail region and therefore, under the operating conditions considered here, it does not become a new controlling region. This trend is consistent with the adopted E/N similarity-based scaling, under which the inception threshold varies approximately linearly with the local air density. The CFD-predicted near-wall density variation in the bottom-mid region is on the order of several percent at the high-speed end, comparable to the predicted ∼9.5% reduction in the bottom-mid regional , supporting the physical plausibility of this mapping. From a “safety margin” perspective, however, the gap between the bottom-mid and roof-tail regions shrinks as speed increases. This indicates a progressive convergence of the two regional thresholds within the investigated range. Accordingly, while a dominance switch may occur outside the current parameter space, it cannot be asserted from the present dataset and would require dedicated investigation under extended conditions (e.g. higher speeds beyond the present range, refined 3D geometries/appendages that redistribute field enhancement, and adverse surface conditions such as icing/roughness that effectively sharpen local curvature). In other words, the conclusion from the present two-dimensional computations that “the roof-tail section is always the controlling region” should be regarded more as a baseline within the current parameter space than as an exclusive “theorem.” Direct maglev-specific validation remains limited and will be pursued in future work (e.g. controlled-pressure scaled long-gap tests preserving E/N similarity and instrumented field monitoring on operational lines).
Taking the whole-train, regional, and hotspot levels together, the influence of speed on lightning-attraction characteristics can be summarized as follows:
Whole-train level. The critical background field for lightning initiation decreases slowly with speed, indicating that higher speeds statistically increase lightning susceptibility, but the magnitude of this change is limited and does not alter the order-of-magnitude judgment of whether lightning will necessarily be triggered. Thus, in engineering applications, the effect of speed should be viewed more as a fine adjustment to an existing static threshold than as a dominant factor that fundamentally changes the risk level.
Regional level. Speed redistributes the “relative safety level” across regions through aerodynamic pressure/density variations: stagnation overpressure zones tend to exhibit increased thresholds, whereas low-pressure zones exhibit reduced thresholds, consistent with the adopted E/N-based density scaling. Among the underside regions, the bottom-mid region shows the largest reduction (about 9.5% over 0–500 km/h), because the accelerated underbody flow forms a pronounced low-pressure/density-drop zone; this effect is difficult to capture by purely electrostatic (geometry-only) analysis but becomes evident once coupled with the density scaling. Meanwhile, under the present geometry, the roof-tail region remains the controlling region within the investigated speed range, although the gap to bottom-mid shrinks with speed; therefore, region-wise trends and gap evolution can serve as key indicators for potential hotspot migration.
Hotspot level. Within the 0–500 km/h range, the hotspot remains in the same local area of the roof-tail region. This indicates, on the one hand, that under the current geometry the geometric advantage of the roof-tail region is sufficient to offset the perturbations introduced by speed effects, and, on the other hand, that observing pronounced hotspot migration in numerical simulations will likely require simultaneous changes to geometric details, suspension height, or environmental conditions (e.g. rainfall, icing), or exploration of higher speed ranges. Together with the suspension-height analysis in Section 2, it can be seen that changes in suspension height primarily modify the “baseline of geometric polarization,” whereas operating speed alters the “difficulty of discharge initiation in the medium” through E/N scaling. Within the current parameter ranges, both effects appear as percentage-level corrections to the threshold, but their regions of influence and sensitivity distributions differ: suspension height is more sensitive to the bottom and tail regions, while speed is more sensitive to the rear roof and bottom. This pattern of “different channels with partially overlapping sensitive zones” provides a physical basis for subsequent integrated anti-lightning designs that simultaneously take into account the levitation system and the aerodynamic shape.
5. Conclusions
High-speed maglev trains rely on electromagnetic forces to achieve contactless levitation and guidance, and use linear motors for traction. Compared with conventional wheel–rail trains, the removal of wheel–rail electrical contact and return paths significantly weakens the electrical connection between the vehicle and the ground. The coupling of the carbody to ground is mainly determined by the capacitance formed across the levitation gap together with local discharge paths. High-speed aerodynamic effects make the nose stagnation zone and tail regions more sensitive to near-wall density and surface pressure, thereby affecting the inception conditions of gas discharges. Based on these differences, suspension height and operating speed emerge as two key independent variables that influence lightning initiation conditions and hotspot distributions, and they constitute the main focus of this study. In this sense, the grounded boundary case provides a wheel–rail-like bounding reference, while the floating boundary represents the levitated maglev limit; the comparison indicates a ∼3% shift in the train-wise critical threshold attributable purely to the electrical return-path strength under the same simplified geometry and leader stage.
In this paper, a unified evaluation framework is established that couples the electrostatic field and the flow field, using the ratio of electric-field strength to molecular number density as the scaling parameter. This choice is consistent with E/N-based similarity for streamer inception across varying air densities, and it is further supported by recent high-fidelity streamer simulations in prescribed inhomogeneous-density (density-gradient) fields (Briels, van Veldhuizen, & Ebert, 2008; Guo, Ebert, & Teunissen, 2023). A critical background electric-field threshold is defined, and regional statistics and hotspot-migration criteria are constructed. The influences of suspension height and operating speed are then systematically analyzed at three levels: whole train, regions, and hotspots. The main conclusions are as follows:
Suspension height modifies both the magnitude and spatial distribution of surface field enhancement through coupling to ground. Reducing the suspension height, or changing the carbody from electrically floating to rigidly grounded, strengthens geometric polarization, increases the maximum field-enhancement factor, and thus lowers the critical background-field threshold of the whole train, making lightning initiation easier and reducing the safety margin of the train–guideway system. Under typical conditions, reducing the suspension height from 0.40 m to 0.20 m and switching from “floating → grounded” each lead to threshold reductions on the order of about 2% and 3%, respectively. For most leader heights, the hotspot remains stably located near the sharp tail of the roof; only at intermediate leader heights combined with floating conditions is a transient shift toward the nose observed, reflecting the competing roles of image-charge coupling at different heights.
The influence of operating speed is mainly manifested through changes in the near-wall air density. Related CFD–inception coupling has been reported for airborne vehicles (airfoils under varying airspeed/angle of attack) and wind turbines (rotating blades), where aerodynamically induced pressure variations shift inception-related thresholds, providing context for mapping CFD-predicted density variations to inception criteria via E/N similarity (Yang, Jiang, Jin, Zhang, & Hou, 2023, 2025). Within the 0–500 km/h range, the train-wise threshold decreases slowly with speed, indicating that, for the present geometry and operating conditions, increasing speed slightly enhances lightning susceptibility. The stagnation region experiences a slight increase in threshold due to overpressure, whereas the roof-tail and bottom-mid regions exhibit density reduction caused by high-speed under pressure, leading to lower thresholds, with the bottom-mid region being the most sensitive to speed. In the current dataset, no cross-regional switch of the controlling region or obvious hotspot migration is observed, but the convergence of the regional threshold curves suggests that, at higher speeds, different suspension heights, or with additional structural details such as roof-mounted equipment, adjustments or even cross-region migration of local hotspots and controlling regions are physically plausible. These tendencies should be taken into account when arranging roof-mounted equipment, selecting insulation levels, and assessing the speed dependence of lightning risk along high-speed maglev lines.
Suspension height primarily modulates the strength of geometric polarization, while operating speed mainly influences the difficulty of discharge initiation in the medium; they act separately on two relatively independent channels, namely “conductor boundary conditions” and “medium density scaling.” Within the proposed framework, their individual contributions can be evaluated separately and their combined effect can be analyzed via superposition. Together, they determine the slow variation of the global threshold and the subtle adjustment of hotspot locations. From an engineering perspective, this separation provides a transparent way to translate design changes in suspension height, grounding configuration, and operating conditions into quantitative variations of the critical background field, thereby supporting safety-margin setting and scenario-based risk assessment. For realistic floating operation within the investigated ranges, the train-wise threshold reduction is on the order of ∼2% due to suspension-height variation and 0.5% over 0–500 km/h due to speed; therefore, a practical conservative train-wise margin of Δ ≈ 2.5% can be adopted relative to a chosen reference case, i.e., . The grounding-related variation is retained as a benchmark sensitivity for return-path conditions rather than a mandatory operational setting. Note that, although the train-wise speed effect is sub-percent, regional sensitivities can be much larger (e.g. ∼9.5% reduction in the bottom-mid region over 0–500 km/h); such regional metrics are therefore more relevant to receptor/down-conductor placement and local protection prioritization than to redefining the global operational threshold. In view of the uncertainties introduced by model simplifications (two-dimensional approximation and the present stage-wise quasi-static treatment), and the exclusion of complex weather/surface conditions (e.g. rainfall and icing), the results should be interpreted as conditional susceptibility thresholds evaluated at prescribed leader stages, rather than a fully transient attachment process. Specifically, the stochastic time-marching of stepped-leader progression (including branching), the transient evolution of leader-channel potential, and space-charge/streamer dynamics in the final attachment are not resolved; future work will couple the present ES–CFD scaling framework with higher-fidelity 3D and time-resolved attachment models and extend it to rainfall/icing-related conditions under different meteorological conditions and full-scale experiments. Direct maglev-specific validation remains limited; feasible routes include controlled-pressure scaled long-gap discharge tests (preserving E/N similarity) and/or instrumented field monitoring of strike locations and currents on operational lines.
The analysis framework and regional indicators developed in this study possess a certain degree of generality. While maintaining the main line of “electrostatic field–aerodynamic flow field–scaled assessment,” they can be extended to studies of lightning-attraction characteristics for different geometric scales, different levitation systems, and other high-speed transportation vehicles. In this way, they provide a basis for cross-device and cross-scenario comparison and methodological unification, and offer a physics-based quantitative tool to support lightning protection design and operational safety assessment for high-speed maglev and other railway systems.