


This paper aims to offer a novel viewpoint for improving performance and reliability by developing and optimizing suspension components in a Y25 bogie through material optimization based on wheel–rail interactions under variable load and track conditions.
The suspension system, a critical component ensuring adaptation to road and load conditions in all vehicle types, is especially vital in heavy freight and passenger trains. In this context, the suspension set of the Y25 bogie – commonly used in Türkiye and Europe – was modelled using CATIA V5, and stress analyses have been performed by way of ANSYS using the finite element analysis (FEA) method. E300-520-M cast steel was selected for the bogie frame, while two different spring steels, 61SiCr7 and 51CrV4, were considered for the suspension springs. The modeled system was subjected to numerical analysis under loading conditions. The resulting stresses and displacements were compared with the mechanical properties of the selected materials to validate the design.
The results demonstrate that the mechanical strength and deformation characteristics of the suspension components vary according to the applied external loads. The stress and displacement responses of the system were found to be within the allowable limits of the selected materials, confirming the structural integrity and reliability of the design. The suspension set is deemed suitable for the prescribed material and environmental conditions, suggesting potential for practical application in real-world rail systems.
This research contributes to the design and optimization of bogie suspension systems using advanced CAD/CAE tools. It thinks that the material selection and numerical validation approach presented here can guide future designs in heavy load rail applications and potentially improve both safety and performance.
1. Introduction
1.1 Importance of railway transport in transportation
Rail transport is a fundamental component of global transportation systems, offering an efficient, reliable and sustainable method for moving both passengers and freight. Compared to road transport, railways provide significantly greater economic and environmental benefits, making them a strategic element in modern logistics and infrastructure planning. The close relationship between safety and durability in commercial marine vehicles used in the logistics sector (Ertas, Alkan, & Yilmaz, 2014) is also valid for railway vehicles. For this, especially the bogie that gives movement to the wagon or train plays a critical role. The performance of such vehicles is improved by finite element analyses such as fatigue analyses and structural analyses (Baykara, 2023; Ertas & Yilmaz, 2014; Baykara, Teke, & Ertas, 2023). There are three primary advantages of railway transport within the transportation system and supply chain. First, it is considerably more cost-effective for both passenger and freight transportation. This is particularly evident in long-distance freight operations, where rail offers unmatched efficiency. It is also the cleanest mode of transport in terms of environmental impact and consumes the least energy per ton of goods transported (Li & He, 2010; Dito, 2015). For instance, the unit cost of fuel in rail transport is lower than that of road vehicles such as trucks. In 2019, rail transport in Europe and Türkiye alone accounted for approximately 3,1 billion ton-kilometres of freight (Hendrickson, Matthews, & Cicas, 2006). Second, the environmental footprint of rail transport is significantly lower than other modes of transportation. Rail systems emit approximately 80% less greenhouse gases and CO2 per passenger-kilometre compared to road and air transport (Jäppinen, Korpinen, & Ranta, 2014) investigated the greenhouse gas emissions associated with rail transport and found an inverse relationship between emission levels and road traffic characteristics, further reinforcing rail’s environmental advantage. Third, rail transport plays a crucial role in alleviating traffic congestion during intercity travel and is considered a safer option for transporting hazardous materials such as chemicals (Hannah, 2023; Matt, 2024). By 2024, the global railway network extended over 1.3 million kilometres, with the industry’s market value estimated at roughly $332.2 billion. Forecasts suggest this figure will rise to $460 billion by 2033, underlining the sector’s increasing economic importance (Magmaweld, 2024; IMARC Group, 2024). These data underscore the pivotal role of railway transport in achieving sustainable mobility and economic growth. However, despite its numerous advantages, the industry faces ongoing challenges, including infrastructure modernization, integration with other modes of transport and the need for technological innovations.
1.2 Y25 bogie systems
In recent years, railway transportation has gained substantial importance, driven by its cost-effectiveness, operational efficiency and environmentally sustainable nature. A key element in this system, the bogie, is essential for maintaining both safety and performance in railway vehicles (Dižo, Blatnický, Molnár, & Falendysh, 2022). During service, wagons are subjected to complex dynamic loads, making the design of bogies - particularly their suspension systems - crucial for maintaining operational safety under diverse track and loading conditions (Lai et al., 2021; Shvets, 2021; Pagaimo, Magalhaes, Costa, & Ambrosio, 2022). Operational safety is influenced by several parameters, including rail irregularities, track geometry, operating speed and load capacity (Dvorak, Leitner, & Novak, 2016; Dimitriovova, 2022; Sventekova, Leitner, & Dvorak, 2017; Klimenda, Soukup, Skocilas, & Skocilasova, 2020).
Bogies are commonly categorized according to their axle count and the design of their suspension systems. Generally, they can be grouped into two categories: carrier and traction bogies, and further subdivided into classical and advanced types from a design perspective. Classical bogies consist of a frame, wheelsets and a primary suspension system located at the junction of the axle box and the frame. In contrast, advanced bogie designs feature split frames connected by elastic elements and utilize independently rotating wheelsets, often replacing the primary suspension with a secondary suspension system.
Bogies are required to perform several essential functions to guarantee the safe and efficient operation of railway vehicles. These include supporting the vehicle body, enabling stable and balanced movement along straight and curved tracks, damping vibrations, minimizing the effects of centrifugal force during high-speed travel on curves and reducing rail wear (Okomato, 1998).
The Y25 bogie, characterized by an 1800 mm wheelbase and a wheel radius of 920 mm, is among the most commonly utilized bogie configurations across Europe for both passenger and freight rail applications (Figure 1). It is designed to operate at a maximum speed of 120 km/h under an axle load of 20 tons, or alternatively, at 100 km/h with an axle load of 25 tons. The bogie’s suspension system incorporates duplex coil springs exhibiting bilinear stiffness properties, in combination with friction dampers specifically tailored to the Y25 design, ensuring optimal ride quality and stability under varying load conditions (Jönsson, 2007).
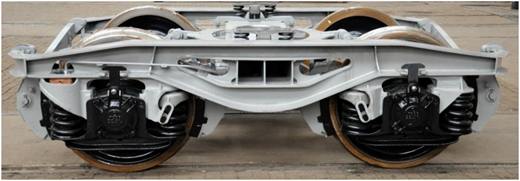
At the heart of the Y25’s suspension is the central pivot, which incorporates a specialized pad designed to provide relatively high stiffness. This configuration effectively eliminates the yaw oscillations of the bogie through the use of suspended side members (Fomin & Lovska, 2021; Fomin, Lovska, Pistek, & Kucera, 2021; Moravcik, Basista, & Tomas, 2017). The primary suspension system is defined by components such as the axle guard, friction damper and the aforementioned duplex coil springs with bilinear characteristics (Lack, Gerlici, & Šťastniak, 2018). The bogie’s structural layout typically includes two longitudinal beams, end lateral supports and a central lateral beam.
Recent modifications to the Y25 bogie design have been introduced in response to increasing demands for reduced noise levels, optimized total wagon weight, improved operational safety and other performance-related factors. A notable modification involves the elimination of the end supports, enhancing the bogie’s overall functionality. ertical coil springs bear the static load, while a Lenoir-link-based friction damper provides resistance through relative motion between the axle box and guide surfaces. The generated friction force is load-dependent, varying with the wagon’s operational state – full or partial load (Lack, Gerlici, & Manurova, 2016; Lack & Gerlici, 2018; Molatefi, Hecht, & Kadivar, 2006).
A data-driven scientific approach was used to compare the dynamic performance of a three-piece bogie and a Y25 bogie by integrating nonlinear multibody system (MBS) formulations with new geometric concepts. The analysis focused on distinguishing the geometry of actual motion trajectories (AMT) from the fixed track geometry. Frenet-based angles (bank, curvature and vertical development) were used to describe the motion-dependent characteristics of bogie trajectories. Simulation results demonstrated that the geometry of AMT curves strongly depends on the longitudinal motion of the wheelset. Therefore, tests conducted on roller rigs, which restrict this motion, are limited in accurately capturing real-world bogie Dynamics (Bettamin, Shabana, Bosso, & Zampieri, 2021). The modal simulation in the ANSYS program was utilized as a supplementary tool to evaluate the fatigue strength of a bogie frame. A long-term fatigue test was conducted to assess the frame’s performance under operational conditions. Finally, the results obtained from both the experimental test and the numerical analysis were presented and compared to draw final conclusions regarding the fatigue behaviour of the bogie frame (Zakaria, 2014). In a study proposes a novel wheel profile design method aimed at reducing wheel wear for railway vehicles operating on fixed routes. Unlike traditional approaches, the method incorporates track geometry and suspension characteristics, utilizing FaSrtip, the wheel material loss function developed by the University of Sheffield, and the Kriging surrogate model. The approach is applied to an Sgnss wagon running on the Blankenburg–Rübeland railway line in Germany. Additionally, the study investigates the relationship between vertical suspension stiffness and wheel wear, providing recommendations for the vertical primary spring stiffness of the Y25 bogie (Ye, Sun, Dongfang, Shi, & Hecht, 2021).
One of the key advantages of the Y25 bogie is its relatively low unsprung mass, primarily due to the efficient use of coil springs in the suspension system. In contrast, American bogie types typically exhibit higher unsprung mass, as they are designed without a primary suspension system and rely solely on a secondary suspension system. Meanwhile, French Y-type bogies feature a primary suspension system consisting of double coil springs placed on either side of the axle box, with one of these springs near the centre of the bogie supported by a friction damper.
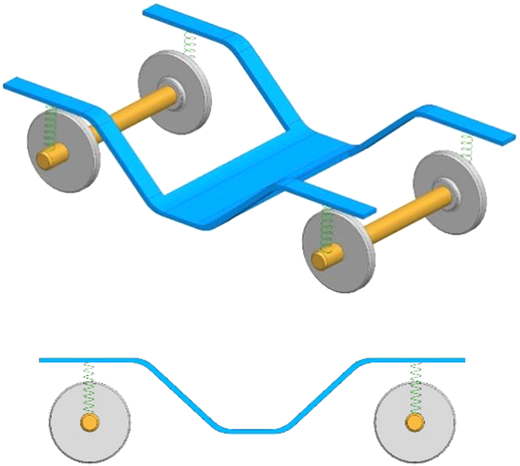
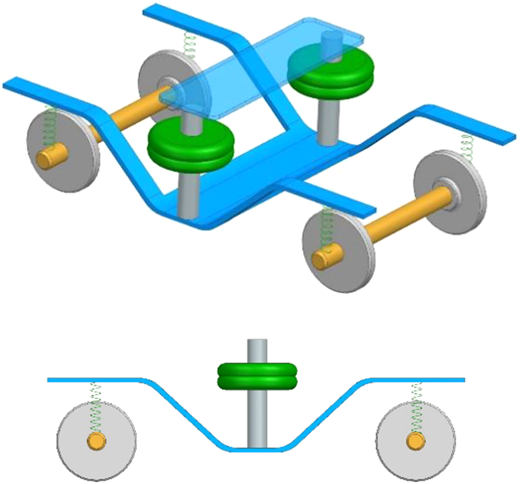
The primary suspension system absorbs vibrations and impact forces, improving ride comfort and wheel-rail interaction. It is supported by friction or hydraulic lateral dampers. While bogies used in freight trains have primary suspension (as shown in Figure 2); passenger coach and locomotive bogies additionally have secondary suspension systems (as shown in Figure 3).
1.3 Suspension systems
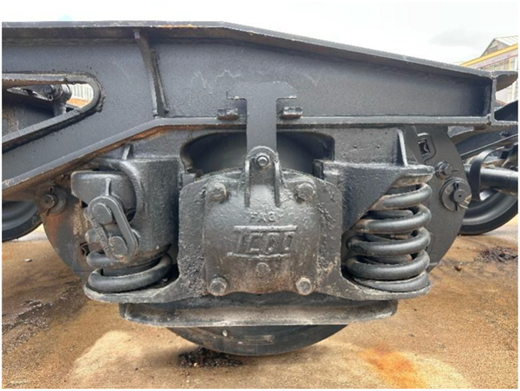
In rail systems, both passenger and freight transportation rely on the contact between the wheels of the wagon bogie and the railway track (Diţo, 2015; Sága, Bednár, & Vaško, 2011; Diţo, Blatnický, & Skočilasová, 2015). In the wheel–rail contact interface, radial and tangential forces acting on the bogie play a critical role in maintaining its dynamic stability on the track (Jakubovičová & Sága, 2014; Maňurová & Suchánek, 2016; Pecháč & Sága, 2016; Šťastniak & Harušinec, 2013; Svoboda & Soukup, 2013; Nangolo & Soukup, 2014; Skočilas, Skočilasová, & Soukup, 2013). The tensions arising from these forces create forces that can cause derailment by acting on the bogie (Lack & Gerlici, 2014; Iwnicki et al., 2013; Sapietová, Sága, Novák, Bednár, & Diţo, 2011). In order to against these forces, the bogie suspension system tries to balance the wagon by creating a resistance force (Lack, Gerlici, & Maňurová, 2014; Lack, Gerlici, & Maňurová, 2015). In this case, the material strength comes to the forefront for the suspension components to resist these forces. Adaptation of rail vehicles to the road, cornering and damping of vibration are provided by suspension systems. The optimum suspension design to be made depending on the changing road and load conditions provides higher performance and comfort. Today, suspension systems are generally categorized into two main types: passive suspension and active/semi-active suspension. Passive systems comprise only spring and damping components and operate without the need for external energy input (as shown in Figure 4). Semi-active suspension systems are suspension systems that adapt themselves to environmental conditions without applying external forces. Active suspension is a suspension system that prevents oscillations by using actuators that can both provide energy to the system and draw energy from the system. Suspension elements, bogie and vehicle connections are made with different methods by considering the boundary conditions, including lateral and longitudinal displacements of bogie components, with different design parameters.
In railway systems, the wheel–rail interface is susceptible to high-frequency and high-amplitude vibrations, particularly at elevated speeds, primarily due to irregular wear arising from continuous wheel–rail interaction (Zhang et al., 2024). Wu et al. investigated the fatigue behaviour at the wheel–rail interface in railway bogies induced by high-frequency vibrations. Their findings revealed that the excitation frequencies associated with short-pitch irregularities varied considerably depending on the rail type and the underlying formation mechanism (Wu et al., 2024; Baykara & Atik, 2025). Friction-induced vibration and brake system instability continue to be a challenge recently (Besset & Sinou, 2017; Xiang et al., 2020). The vibration caused by such problems is commonly controlled by applying the actuator to the primary and secondary suspensions.
1.4 Numerical analysis
Numerical analysis and simulation play a crucial role in accelerating the design and product development process, including the design of rail vehicles, while also contributing to cost reduction. Analysis and simulation phase occurs prior to the production process, allowing for the identification of potential design errors before actual manufacturing begins. By detecting these issues early, material waste, labour costs and time losses can be avoided, ultimately minimizing overall costs (Lunys, Daildayka, Steisunas, & Bureika, 2016; Manurova & Suchanek, 2016; Melnik & Sowinski, 2013; Manurova & Suchanek, 2016). Ján Dižo et al. conducted a comparative study of the modal characteristics of Y25 bogie frames commonly used in Central European freight wagons, employing the FEA (Dižo, Harušinec, & Blatnický, 2018).
Although the Y25 bogie is widely adopted and has demonstrated robust performance in railway operations, the increasing demands for safety, ride quality and durability necessitate a deeper understanding of its structural behaviour. In this paper, FEA is employed to analyse the mechanical performance of the Y25 bogie under various loading and boundary conditions. The objective is to evaluate stress distributions, identify potential critical regions and provide insights for structural optimization and fatigue life improvement.
2. Material and analysis methodology
2.1 Materials
The material commonly used in bogie frames and their components is cast steel, which is renowned for its high strength and toughness. In this study, E300-520 cast steel, which has suitable mechanical properties (as shown in Table 1) and chemical composition (as shown in Table 2), was used. Steel, as a versatile material, meets the demands of various industrial applications through alloying with elements such as carbon, which enhances its properties. Additionally, heat treatment plays a pivotal role in developing the desired microstructures in steel, further improving its mechanical characteristics. The casting process, which is integral to steel component fabrication, facilitates the production of parts with complex shapes and geometries, making it an efficient choice for manufacturing.
Nominal mechanical properties of E300-520-M cast steel
| Grade | Heat tempered process | Yield stress MPa | Tensile stress MPa | Elongation % | Charpy impact strength KJ | Brinell hardness |
|---|---|---|---|---|---|---|
| E300-520-M | Normalised | Approx.300 | 17 | 20 | 30 |
Source(s): Author’s own work
Nominal chemical compositions of E300-520-M (%)
| Grade | C | Si | Mn | Cr | Ni | Mo | P | S |
|---|---|---|---|---|---|---|---|---|
| E300-520-M | 0.25 | 0.5 | 1.0 |
Source(s): Author’s own work
In applications where spring materials are required, steel must exhibit both sufficient load resistance and high flexibility. It is crucial that the material retains its ductility when subjected to applied loads. To achieve these properties, alloying elements such as high carbon, silicon, manganese, chromium, molybdenum and vanadium are incorporated into the steel. Furthermore, appropriate heat treatments are necessary to optimize the material’s performance for spring mechanisms, ensuring durability and reliability under mechanical stress. In this study, 61SiCr7 and 51CrV4 spring steels with suitable mechanical properties (as shown in Table 3) and chemical composition (as shown in Table 4) were used. There are various spring materials between 1,150 and 1,650 MPa according to their yield strength. In this research paper, Europe and Turkiye were selected according to road and load conditions. In addition, the design was kept at an optimum level in terms of cost.
Nominal mechanical properties of spring steel components
| Grade | Designation number | Quenching temperature | Quenching hardening | Tempering temperature | Yield strength Rp0,2 MPa | Tensile strength Rm MPa | Elongation % | Charpy impact strength KJ |
|---|---|---|---|---|---|---|---|---|
| 61SiCr7 | 1.7108 | 860 | Oil | 450 | 1,400 | 1,550–1,860 | 5.5 | 8 |
| 51CrV4 | 1.8159 | 850 | Oil | 450 | 1,200 | 1,360–1,660 | 6.0 | 8 |
Source(s): Author’s own work
2.2 Analysis methodology
Firstly, the suspension system used in the Y25 bogie frame, which is the subject of the analysis of this research manuscript, was 3D modelled in CATIA V5 (Figure 5).
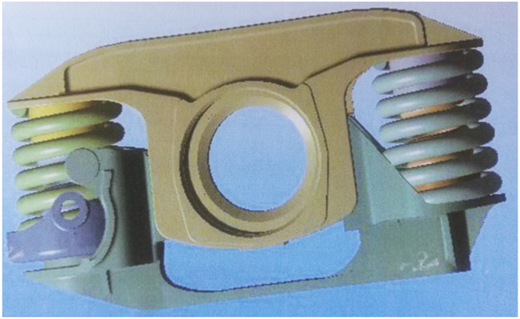
The 3D model of primary suspension system in Y25 bogie frame. Source: Author’s own work
The 3D model of primary suspension system in Y25 bogie frame. Source: Author’s own work
2.2.1 Force determination
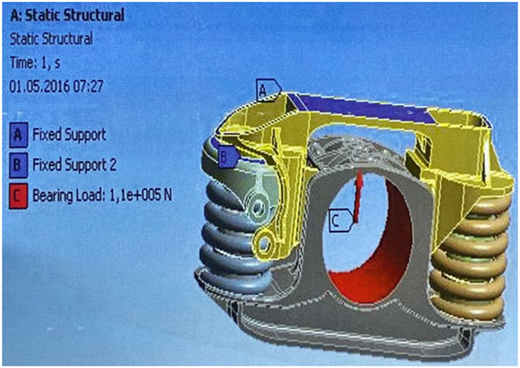
In the analysis of loading, the minimum axle pressure on the transportation route, the weight per meter and the values specified in the wagon loading table are considered. For transportations on lines with axle pressures of 22,5 tons or higher, the compliance of the freight wagon loading table with the line classes rated for 22.5 tons or above is also factored in. It is important that the weight per meter does not exceed these limits. In most railways in Turkiye, the commonly used axle pressures are 20 tons/axle (Class C) or 22,5 tons/axle (Class D). This indicates that a four-axle wagon can carry a maximum weight of up to 80 tons, including its tare weight, on Class C roads and up to 90 tons on Class D roads. The maximum permissible axle load, which is determined by the type of rail used in the railway system, can reach up to 22,5 tons per axle in both Turkiye and Europe. Based on this information, the maximum axle load pressure considered in this study is set to 22,5 tons. Consequently, each bearing of the axle is subjected to a load of 22,5 tons divided by two, resulting in 11,25 tons per bearing, which corresponds to an approximate force of 110,000 N. This value of 110,000 N was taken as the basis for the load and strength analysis.
2.2.2 Loading and boundary conditions
Under the influence of the applied load, compressive forces act upon various contact surfaces within the suspension system. Specifically, a compressive force is transmitted to Surface A from the vehicle chassis, to Surface B from the spring covers and to Surface C from the axle (as shown in Figure 6). These loading conditions are essential in accurately simulating and analysing the mechanical response of the suspension system. Proper characterization of these boundary conditions ensures the fidelity of the structural analysis and aids in predicting the system’s behaviour under operational conditions.
2.2.3 Mesh properties
In the FEA, the most precise mesh properties possible were applied(as shown Table 5).
As a network convergence check on the above data, the average number of nodes per element is approximately 2.36 (Equation (1)).
In this case, since the analysis is carried out on the bogie suspension assembly, it provides a reasonable resolution.
2.2.4 Boundary conditions
Boundary conditions define how a structure interacts with its surroundings in a simulation. They determine where the model is fixed, where loads are applied and which degrees of freedom are constrained and directly influencing the accuracy of the results(as shown Table 6).
Boundary conditions used in suspension system of Y25 bogie
| Region | Boundary condition | Explanation |
|---|---|---|
| Axle box seat | Frictionless support | Allows vertical support but permits lateral movement |
| Center spring seat | Fixed support | Represents the fixed location of a spring mount |
| Symmetry faces | Symmetry condition | Used if only half or quarter of the model is analysed |
| Load application point | Force/pressure application | Where spring or external loads are applied |
Source(s): Author’s own work
2.2.5 Formed stresses and displacement amounts
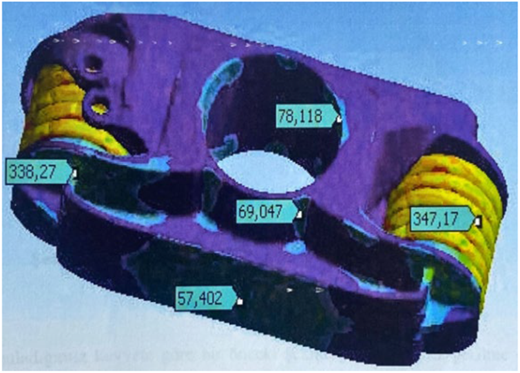
In the context of the applied load of 110,000 N, an FEA was performed to determine the highest and lowest displacements within the suspension system. The displacement data as a result of the analysis shows that the highest value is around 347 mm and the lowest values are around 57 mm. The highest displacement was found in the region where the naturally flexible spring element was located and the lowest displacement was found in the rigid steel casting region. (as shown in Figure 7).
2.2.6 Deformation amounts depending on the stress intensity
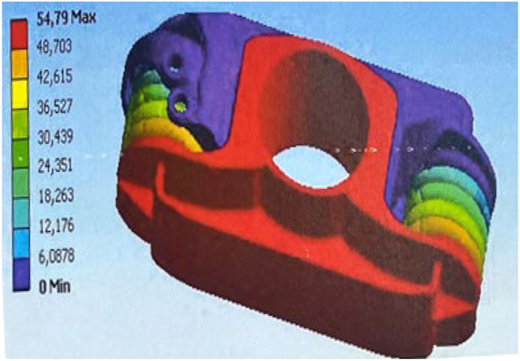
The total stress experienced by the suspension system was evaluated as a function of the stress intensity due to the applied load. In the stress distribution, the highest stress is 54.79 MPa in the red area and the lowest stress is 0 MPa in the purple area. (as shown in Figure 8). This analysis offers a detailed insight into the structural response of the system under applied loading conditions and facilitates the identification of zones with excessive deformation that may impair mechanical performance or contribute to long-term fatigue failures. Accurate prediction of stress values is critical to optimise suspension design to ensure durability, reliability and safety.
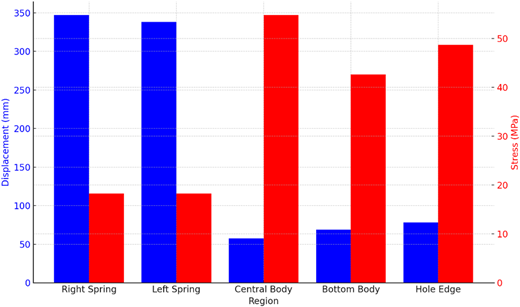
In order to establish a correlation between the displacement and stress values indicated in these figures (Figures 8 and 9), it is necessary to compare the values obtained.
Comparison of displacement and stress in different regions. Source: Author’s own work
Comparison of displacement and stress in different regions. Source: Author’s own work
The displacement and stress values observed in various regions of the analysed component are shown (Figure 9). The blue bars represent the displacement values in millimetres, indicating how much each region deforms under load. The red bars show the corresponding stress values in MPa, reflecting the internal forces resisting deformation. The x-axis labels the structural zones and the y-axes, which are left for displacement, right for stress, measure their respective magnitudes. The observed inverse relationship between displacement and stress is emphasized. Thus, flexible regions such as springs show high displacement but low stress, while rigid structural regions such as frames exhibit low displacement and high stress concentration.
In the stress analysis conducted for each component of the suspension assembly, the stress results obtained from the spring support body are observed as follows: The 121,9 MPa stress indicates that the structure experiences the most significant movement in the upper left region, suggesting it is the most heavily loaded area. The lower values of 63,678 MPa and 74,478 MPa indicate that these regions are more stable under the applied load. All values are within safe limits in terms of strength and fatigue life as they are below 300 MPa, the yield limit of the material (as shown in Figure 10). The stress level in the upper spring seat body is 77,825 MPa. This area experiences a higher stress concentration due to the load application. Since it is the contact region where the spring, which moves freely according to the applied load, interacts with the seat, the stress in this region is higher compared to the lateral edges. This suggests that the component significantly deflects or deforms under the applied load. As the spring moves vertically, the lateral region does not experience high stress concentrations, and the stress remains at a minimum level of 57,612 MPa. This indicates that the lateral side is a non-moving or more rigid zone. All values are within safe limits in terms of strength and fatigue life as they are below the yield limit of the material, 300 MPa. No permanent deformation is expected (as shown in Figure 11). In the spring housing area, the left-end region exhibits a significantly high stress of 338,27 MPa. It is a critical condition because it exceeds the yield limit of the material, which is 300 MPa. Local plastic deformation or crack initiation may occur in this area. Reinforcement should be applied to this area or the stress distribution should be re-optimised. More tolerable stress levels are observed at the upper: middle ring edge is 78,118 MPa, the central body region is 69,047 MPa and the bottom edge is 57,402 MPa (as shown in Figure 12). In the upper cylindrical part, the stress level is relatively low at 25.007 MPa, indicating that the cylinder is structurally safe. However, at the lower platform surface, a critical stress level of 95.625 MPa is observed, suggesting that the load is concentrated in this region. Safe and stable as it is well below the yield limit of the material (300 MPa) (as shown in Figure 13).
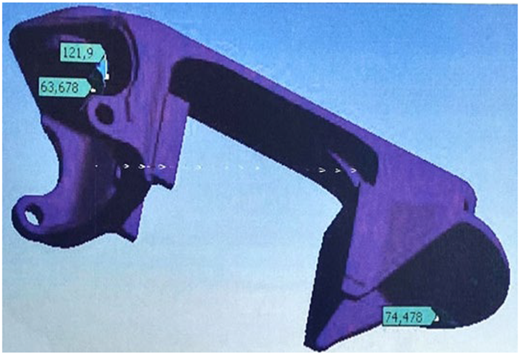
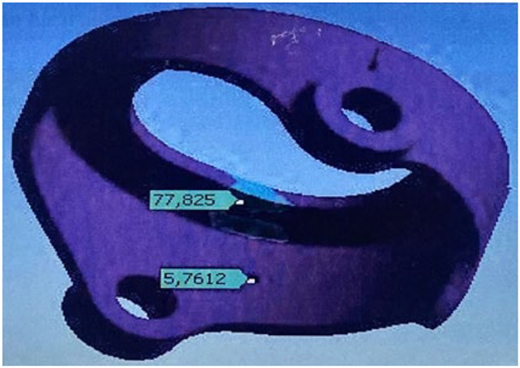
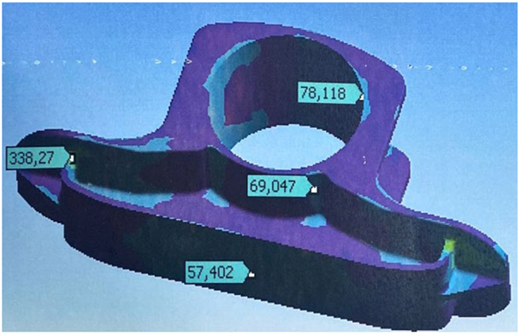
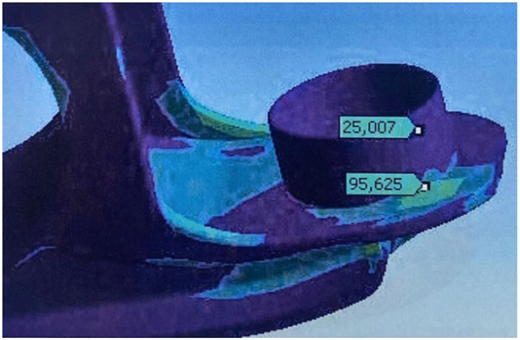
Stresses on the edge of the spring box in the bed box. Source: Author’s own work
Stresses on the edge of the spring box in the bed box. Source: Author’s own work
The total total deformation caused by the stresses obtained for the four parts as a result of the analysis is between 57,612 MPa and 338,27 MPa (Table 7 and Figure 14).
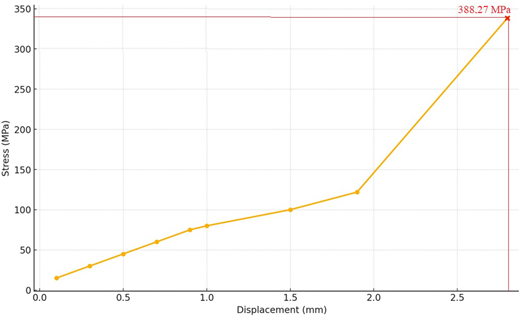
The relationship between stress and total deformation for suspension frame parts. Source: Author’s own work
The relationship between stress and total deformation for suspension frame parts. Source: Author’s own work
Stress and total deformation values
| 1 | 2 | 3 | 4 | 5 | 6 | 7 | 8 | |
|---|---|---|---|---|---|---|---|---|
| Displacement (mm) | 0.3 | 0.5 | 0.7 | 0.9 | 1.0 | 1.5 | 1.9 | 2.8 |
| Stress (MPa) | 30.0 | 45.0 | 60.0 | 75.0 | 80.0 | 100 | 121.9 | 338.27 |
Source(s): Author’s own work
The curve in the graph shows a non-linear trend. Between 0.1 and 1.0 mm, the stress increase is relatively constant and the system is in the elastic deformation region. However, the sharp increase after 1.5 mm indicates the onset of local plasticisation under load in certain parts of the structure and a decrease in stiffness. In particular, the last two data points, 1.9 mm and 2.8 mm displacement strain reach 121.9 MPa and 338.27 MPa, respectively, showing a sudden stress increase. At the extreme point of 338.27 MPa for E300-520-M steel, the material exceeded the yield strength and permanent deformation started.
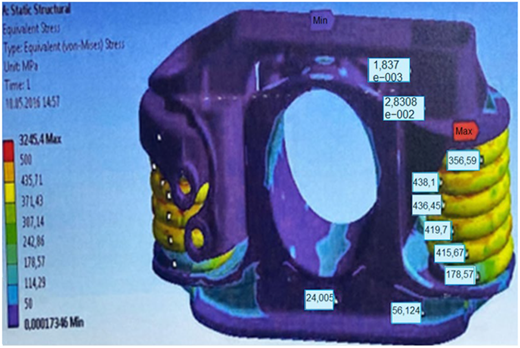
The maximum equivalent (von Mises) stress of 356.59 MPa was observed in the upper region of the structure, particularly around the spring seat areas where load transmission is most concentrated (notably in the upper-right yellow spring zone). Additional localized high stress values, such as 419.7 MPa and 438.1 MPa, were identified in intermediate zones, suggesting potential irregularities in load distribution and possible stress concentrations. In contrast, the minimum stress of 0.000173 MPa was recorded at the inner edge of the upper body. The regions surrounding the central hole and the lower base exhibited relatively low stress levels ranging from approximately 0.024 MPa to 56.1 MPa, indicating more stable zones due to reduced structural load transfer. Given the use of high-performance spring steels such as 51CrV4 or 61SiCr7, which exhibit yield strengths between 800 and 1,100 MPa, the observed maximum stress remains well within acceptable safety margins (see Figure 15).
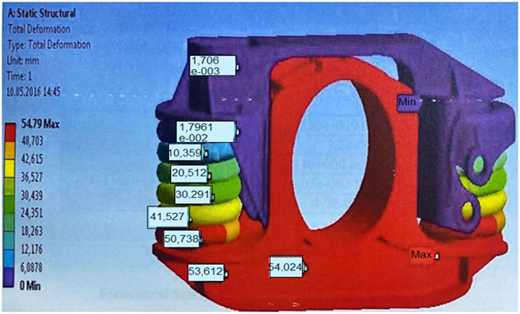
In this analysis, the maximum displacement of 54.79 mm occurred at the lower-right corner of the model, marked in red, corresponding to the primary load application zone. Other high displacement values such as 53.6 mm, 54.02 mm and 50.7 mm further indicate that this region exhibits significant structural flexibility under the applied load. Displacement values between 20 and 40 mm reflect the deformation capacity of load-bearing elements and their ability to absorb mechanical energy. In contrast, the minimum displacement, recorded as 0 mm in the upper central area (marked in purple), corresponds to the region defined as the fixed support. The upper part of the model displays minimal deformation overall, suggesting rigid behaviour.
When compared to the previous stress analysis – where the maximum von Mises stress of 356.59 MPa was observed at the upper-right spring seat – the current deformation results highlight an important distinction: maximum stress and maximum displacement do not always occur in the same region. This reveals a structural correlation between stiffness and flexibility, underscoring that different regions of the component fulfil distinct mechanical roles under complex loading conditions (i.e. while one area resists the load, another allows movement) (as shown in Figure 16). For the FEA, the material constants for E330-520-M are as follows: compressive yield strength is 300 MPa, tensile ultimate strength is 520 MPa and the reference temperature is 22°C.
Total deformation amount in suspension after force loading. Source: Author’s own work
Total deformation amount in suspension after force loading. Source: Author’s own work
The fatigue curve was developed through theoretical modelling, taking into account the specific loading conditions applied to the suspension system and the material properties of E300-520-M. It is of critical importance for components operating under repeated loading. This curve, commonly referred to as the S-N curve or Basquin curve in the literature, is plotted with the alternating stress (Table 8) on the vertical axis and the number of cycles to failure on the horizontal axis, which is presented on a logarithmic scale ranging from 1 to 1,000,000 cycles.
Alternating stress according to cycles
| Alternating stress MPa | Cycles |
|---|---|
| 3,999 | 10 |
| 2,827 | 20 |
| 1,896 | 50 |
| 1,413 | 100 |
| 1,069 | 200 |
| 441 | 2,000 |
| 262 | 10,000 |
| 214 | 20,000 |
| 138 | 1,e+005 |
| 114 | 2,e+005 |
| 86,2 | 1,e+006 |
Source(s): Author’s own work
At extremely high stress levels, such as 4,000 MPa, the component exhibits a very short fatigue life of approximately 10 cycles, whereas at a lower alternating stress of around 86 MPa, it can endure up to 1,000,000 cycles. The critical stress level is identified as 388.27 MPa, which corresponds to a very short fatigue life between 103 and 104 cycles. This indicates that if a load of this magnitude is repeatedly applied to the component, there is a high risk of fatigue damage occurring in the form of crack initiation or even fracture within tens of thousands of cycles (Figure 17).
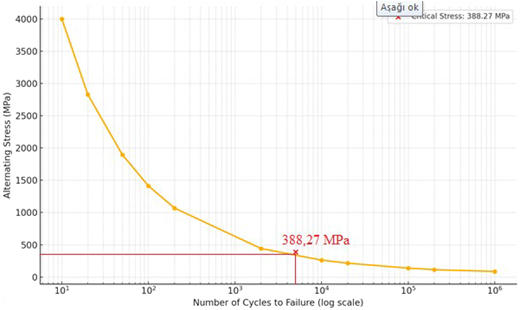
As the stress level decreases, the number of cycles increases logarithmically. Since the data follows an approximately linear line in the log-log graph, it is seen that it is in accordance with the Basquin curve (Equation (2)).
where
Alternating (equivalent) stress
Fatigue strength coefficient (material constant)
Number of cycles
b: Fatigue strength slope coefficient (negative value)
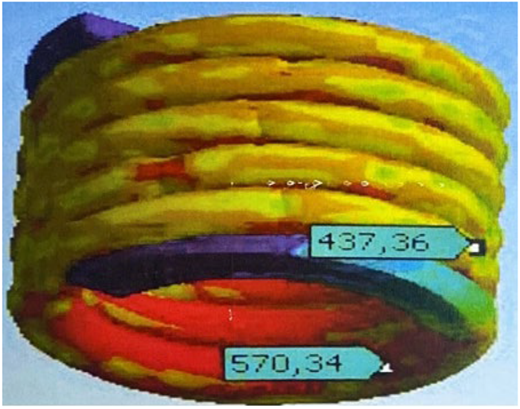
It has been determined that the component exhibiting the highest displacement under the applied load (as shown in Figure 18) coincides with the region subjected to the highest equivalent stress (as shown in Figure 19). This indicates a direct correlation between deformation and stress concentration within the structural geometry. Such a relationship is a critical parameter in evaluating the load-bearing performance of flexible components like springs. Regions with significant displacement tend to approach the material’s strength limits, indicating a higher potential for mechanical failure. Therefore, analysing both displacement and stress data together allows for a comprehensive engineering assessment in terms of design safety and structural durability.
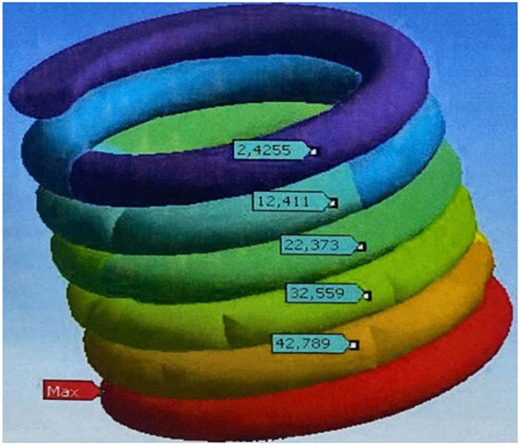
In the FEA of the helical spring structure, the total displacement values are observed to range between 24,255 mm at the top section and 42,789 mm at the bottom section of the spring. This progressive increase in deformation along the axial direction is attributed to the top-down application of the load, which is consistent with the mechanical behaviour of compression springs under axial loading. The smooth gradient observed in the colour contour plot indicates a uniform displacement distribution throughout the spring coils, suggesting that the structure experiences no abrupt stress concentrations or localized stiffness discontinuities under the given loading conditions. Such a deformation pattern is desirable in spring design, as it ensures consistent energy absorption and minimal risk of fatigue initiation due to sudden local deformations.
The equivalent stress (von Mises stress) values within the spring body are found to vary between 437,36 MPa and a maximum of 570,34 MPa, predominantly occurring in the lower coils, where displacement is also the highest. This correlation indicates a direct relationship between local strain energy and deformation amplitude, as expected in elastic spring elements. The continuous colour transitions in the stress contour map further confirm that the load transfer is well-distributed across the spring geometry, avoiding localized overstressing. Although the peak stress of 570,34 MPa may appear high, it remains within acceptable limits for high-performance spring steels such as 61SiCr7 or 51CrV4, which are specifically designed for dynamic loading conditions and possess elevated yield and fatigue strength values. Therefore, under the assumed boundary conditions and material selection, the spring design can be considered mechanically reliable and structurally safe. Although the peak stress value of 570.34 MPa may initially appear high, it remains within the acceptable limits defined by the yield, tensile and fatigue strength characteristics of high-performance spring steels such as 61SiCr7 and 51CrV4, which are specifically engineered for dynamic loading conditions. These alloyed steels are commonly selected for mechanical systems subjected to fluctuating and repetitive loads, offering yield strengths typically exceeding 1,000 MPa, tensile strengths above 1,200 MPa and excellent fatigue resistance over millions of cycles. Considering the applied boundary conditions and loading scenario used in the FEA, it was confirmed that the stress is distributed uniformly along the spring geometry, with no indication of localized stress concentrations. Furthermore, the material operates within its elastic limits under the given conditions. This indicates that the design ensures structural integrity and meets the expected fatigue life performance. Therefore, based on the material properties, analysis results and engineering design criteria, the spring can be regarded as mechanically reliable and structurally safe (Figure 20).
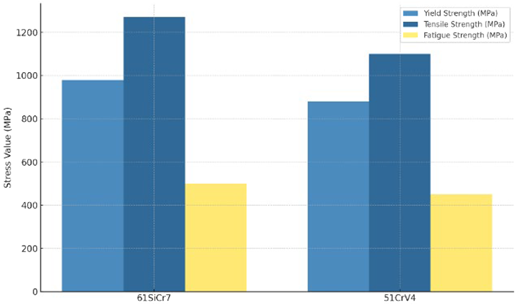
Mechanical properties of 61SiCr7 and 51CrV4 materials. Source: Author’s own work
Mechanical properties of 61SiCr7 and 51CrV4 materials. Source: Author’s own work
2.2.7 Safety of factor
The Y25 bogie design prioritises robustness and long-term reliability for load operations. It is theoretically designed for a minimum service life of 30 years. A key parameter in achieving reliability over this period is the safety factor, which defines the margin between the maximum load a component can withstand and the expected operational load. Typical safety factor values in Y25 bogie design vary as follows:
2.0 to 2.5 for static structural parts (e.g. bolsters, side frames)
Up to 3.0 or more for fatigue-sensitive or dynamically loaded components.
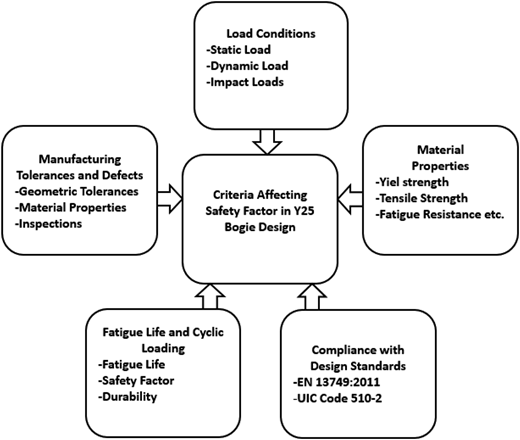
Y25 The basic criteria affecting the safety factor in bogie design must be met (as shown Figure 21).
When the stress values obtained from the analysis are compared with the material yield strength, the safety factor for each component is determined (Table 9 and Figure 22).
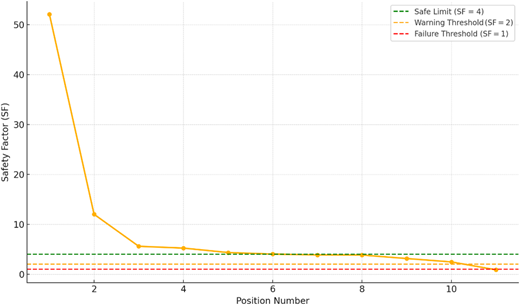
Safety factor distribution according to component positions. Source: Author’s own work
Safety factor distribution according to component positions. Source: Author’s own work
Safety factor evaluation of components based on the stress values obtained from the analysis
| 1 | 2 | 3 | 4 | 5 | 6 | 7 | 8 | 9 | 10 | 11 | |
|---|---|---|---|---|---|---|---|---|---|---|---|
| Equivalent stress (MPa) | 5.76 | 25.01 | 53.63 | 57.4 | 69.05 | 74.47 | 77.82 | 78.12 | 95.62 | 121.9 | 339.27 |
| Yield strength (MPa) | 300 | ||||||||||
| Safety of factor (SF) | 52.08 | 12.0 | 5.59 | 5.23 | 4.34 | 4.03 | 3.86 | 3.84 | 3.14 | 2.46 | 0.88 |
| Range of safety | >4 | >4 | >4 | >4 | >4 | >4 | 4–2 | 4–2 | 4–2 | 4–2 | <1.5 |
| Assessment | Safety | Safety | Safety | Safety | Safety | Safety | At the limit | At the limit | At the limit | At the limit | Risky |
Source(s): Author’s own work
According to the tabulated data, the first six components are identified as being in an excessively safe condition. Although components 7 through 10 are still classified as safe, their safety factors are close to the lower design threshold. Component 11, however, exceeds the material’s yield strength, suggesting that permanent deformation may have initiated under load (Table 9). In the graphical representation, the boundaries are defined with color-coded lines: the green line indicates the minimum acceptable safety threshold, orange line represent components that approach critical values and require attention and the red line marks the failure threshold, beyond which the risk of plastic deformation becomes significantly high (Figure 22).
3. Discussion and results
The FEA conducted on the Y25 bogie suspension system offers comprehensive insight into the structural performance of its critical components. The simulation specifically evaluates the system under a static vertical load of 110,000 N, focusing on key parameters such as von Mises stress distribution, total deformation and resultant displacement. These mechanical responses are crucial for identifying potential failure zones, ensuring load-bearing capacity and verifying the material suitability for prolonged operational use under demanding rail conditions.
The selected load magnitude represents typical service conditions for Y25 bogies, corresponding to a standard axle load of 22.5 tonnes. This value aligns with commonly adopted railway regulations in both Turkiye and the European Union, thereby reinforcing the relevance and applicability of the study outcomes. By simulating real-world loading scenarios within a controlled computational environment, the analysis contributes to validating design safety, optimizing maintenance strategies and potentially extending the service life of bogie components within freight or passenger rail vehicles.
For the stresses obtained as a result of the analysis (Figures 11–,14), in high-cycle applications such as railway suspension systems, an alternating stress level of 338.27 MPa must remain below the material’s safety threshold. In this study, modifications are recommended for the E300-520-M cast steel material used in the suspension frame, which has a yield strength of 300 MPa. As an improvement, higher-strength steels such as S420MC or S500MC (in accordance with EN 10149-2) may be employed as hybrid alternatives to E330-520-M. These materials can be selectively integrated into various sections of the design to enhance overall mechanical performance and fatigue resistance (Table 10).
Alternative steels with higher yield strength than E330-520-M steel
| Materials | Yield strength (MPa) | Tensile strength (MPa) |
|---|---|---|
| S420MC | ||
| S500MC |
Source(s): Author’s own work
Additionally, to ensure safe operation of the component under a target fatigue life of approximately 106 cycles, it is essential to either distribute the stress more uniformly over a wider area through geometric optimization or apply an appropriate fatigue safety factor (Table 11). Stress levels below this threshold – typically around 106 cycles – are considered to enable theoretically infinite fatigue life for metallic materials. In fatigue analysis, safety limits can be determined using established criteria such as Goodman, Soderberg or Gerber. Furthermore, for regions exhibiting stress peaks, localized fatigue assessments should be conducted and if necessary, evaluations of notch sensitivity may be incorporated to account for geometric discontinuities and potential stress raisers.
| Problem | Possible cause | Suggested solution |
|---|---|---|
| Excessive displacement (e.g. 338 mm) | Thin cross-section, weak material, free boundary condition | Increase thickness, add support ribs, apply fixed (encastre) boundary condition |
| High stress around hole edges | Stress concentration due to sharp geometry | Increase fillet radius, use elliptical hole shape, smooth geometric transitions |
| Deformation at connection points | Inefficient load transfer | Reinforce underneath bolt hole, use insert bushings |
| Deformation of cylindrical protrusions | Weak base connection | Increase base contact area between cylinder and platform |
Source(s): Author’s own work
For the suspension component, namely the spring, stress concentrations observed at the point of maximum displacement should be carefully considered in subsequent fatigue and deformation analyses. To achieve a more uniform stress distribution, geometric revisions – such as adjustments to coil diameter, pitch or wire thickness – can be implemented to enhance structural performance and minimize localized stress peaks.
Based on the evaluation of safety factors (Table 9), components with excessively conservative safety margins (parts 1–6) can be optimized through material or thickness reduction, lightweighting strategies, alternative geometric designs or by selecting materials with lower yield strength. For parts 7 and 10, the use of higher yield strength materials and reconsideration of the current geometry are recommended to enhance resistance against fatigue-induced cracking. In the case of part 11, both the selection of a material with significantly higher yield strength and a complete geometric redesign are strongly advised. Additionally, increasing the radius in critical stress-concentration regions and applying appropriate heat treatment processes may further improve durability and fatigue resistance.
4. Conclusion
Finite element analysis of the Y25 bogie suspension system under a static vertical load of 110,000 N revealed that stress and deformation levels across all components remain within the material yield limits. The design demonstrates high structural integrity, with the maximum stress observed in the spring region well below the failure threshold of the selected materials. The results confirm the effectiveness of the chosen materials (E300-520-M for the frame and 61SiCr7/51CrV4 for the springs) and validate the robustness of the suspension configuration under European and Turkish loading standards. The high safety margin observed indicates the system’s reliability, and the findings offer valuable insights for fatigue life improvement and structural optimization of bogie systems in heavy rail applications.
This methodology provides a systematic approach to material selection and numerical validation, offering practical guidance for future railway suspension designs in high-load applications.
The author is grateful to Musa Kulaksız and Murat Bektaş who contributed to this study.
Declaration of competing interest: The authors declare that they have no known competing financial interests or personal relationships that could have appeared to influence the work reported in this paper.

