This study analyzes whether/how managers systematically place information in different locations of presidents' letters.
The paper examines the intra-document variability (each president's letter is divided into three parts: first, middle, and final) in syntactical complexity and attributions between two extremely different periods, determined by the global financial crisis. In a supplementary analysis, pre and post COVID-19 pandemic years are also analyzed. The setting is a civil-law country, Spain.
The results show that, in line with the obfuscation hypothesis, managers are more prone to using intra-variability in attributions, rather than in syntactical complexity. Financial Services and Real Estate is the sector whose intra-variability in attributions could be most clearly interpreted in line with the obfuscation hypothesis.
Previous research has not paid much attention to the location of news in the accounting documents. However, the placement of information within disclosure(s) is (often) deliberate and can be done for misleading purposes.
1. Introduction
Financial reports in general, and presidents' letters in particular, provide a window onto the use of communication strategies by managers (Laidroo, 2019). Presidents' letters are widely used in investors' decision-making (Hadro et al., 2021; Keusch et al., 2012). Accounting narratives in the annual report are largely discretionary and unaudited. This gives managers the flexibility to select, discuss, and explain financial performance. They may therefore indulge in impression management by attempting to influence stakeholders' perceptions (Cherry et al., 2023). Corporate explanations of organizational events allow managers to provide stakeholders with cues to interpret them (Berkin et al., 2023; Gandía and Huguet, 2021). Previous research has found that syntactical complexity (Hassan et al., 2019; Li, 2008) and attributions (Aerts, 2005; Jayamohan et al., 2022) may be biased to show a self-serving view of corporate performance. These practices could be misleading and, if successful, would undermine financial reporting quality and result in capital misallocation (Brennan and Merkl-Davies, 2013).
Psychology literature shows that users usually pay more attention to information displayed earlier rather than later (Anderson, 1965) and warns about the importance of location in news releases (Zillmann et al., 2004). “Presentation order is an important determinant in shaping judgement and as such, may be used as an implicit impression management technique” (Hellmann et al., 2017, p. 463). Thus, the choice of where to locate information within documents could be made for misleading purposes (El-Sayed et al., 2021). However, previous research has not paid much attention to the location (or obfuscation) of news in the accounting documents (Boudt and Thewissen, 2019).
This paper tries to fill this gap by systematically analyzing the location of information in different parts of presidents' letters. Specifically, each president's letter is divided into three parts: first, middle, and final. This paper studies whether different patterns (intra-document variability) in syntactical complexity and attributions are found within companies between two different performance periods.
Previous research typically analyzes potential changes in textual characteristics between different companies (top versus bottom profitability according to accounting figures) in a single year or two consecutive years (Clatworthy and Jones, 2006; Oliveira et al., 2016). For that reason, it is usually based on firm-specific drivers, rather than on contextual reasons (Merkl-Davies and Brennan, 2011). By contrast, this paper analyzes the same companies in two extremely different periods. The scenario was provided by Spain, with two extremely different economic cycles, determined by the global financial crisis: first, a significant growth period, and second, a deep crisis period. This behavior was reflected on the IBEX 35, the main Spanish stock exchange index. In a complementary analysis, an additional timeframe provided by the COVID-19 pandemic is also studied.
Previous literature has compared disclosure before and during the global financial crisis (Keusch et al., 2012; Jones et al., 2020; Moreno and Jones, 2022; Scheuerlein and Chládková, 2022). Keusch et al. (2012) find that the crisis led to more extensive use of self-serving bias, with managers presenting themselves in the best possible light. Jones et al. (2020) find that companies reduced favorable graphical distortions and performance comparisons during the crisis, but still misrepresented by omission. Scheuerlein and Chládková (2022) find that the crisis led to changes in linguistic indicators in letters to shareholders. Moreno and Jones (2022) find that the crisis did not stop impression management, but companies disclosed a subtler corporate view. However, none of these papers focus on the location of narratives in the corporate documents [1]. Focused on location, but not in a crisis context, Boudt and Thewissen (2019) evidence that strategic positioning of positive and negative words within corporate documents is used as a subtle form of impression management. The current paper analyzes whether strategic location is also used during the global financial crisis in line with impression management.
Most previous studies about accounting narratives have focused on common-law countries such as the USA, the UK, and Australia (Brennan and Merkl-Davies, 2022). Aerts and Tarca (2010) compare narrative information in four different common-law countries. They show that the institutional setting in which reporting occurs may well be an important factor in comparable financial reporting. Although differences between common and civil-law countries could be expected, narratives in civil-law countries have received much less attention. Our study is based on Spain, a civil-law country.
This paper presents potential contributions to the impression management literature. First, most previous literature analyzes corporate documents as a whole (Aerts, 2005; Hassan et al., 2019; Jayamohan et al., 2022; Li, 2008). By contrast, this paper analyzes the intra-document variability of syntactical complexity and attributions. In addition, the few studies which analyze intra-variability in syntactical complexity (Bayerlein and Davidson, 2012; Clatworthy and Jones, 2001; Courtis, 1998; Pasko et al., 2020) only select a small sample of each of the three parts, which gives rise to representation concerns. By contrast, this paper analyzes all three parts in their entirety. Second, most impression management literature analyzes differences between (different) top and bottom companies in the same period (Clatworthy and Jones, 2006). However, this paper analyzes differences in the same companies between two extremely different periods. Therefore, this paper is based on market-based periods rather than a profitability criterion based on accounting. Third, the context is provided by a civil-law country, in contrast to the overwhelming common-law context in previous literature (Brennan and Merkl-Davies, 2022).
This paper is based on the database, and therefore the same scenario, used by Moreno and Jones (2022). They study multiple textual characteristics in the documents as a whole before and after the global financial crisis. They find limited evidence of impression management but find that, even in the crisis, reports were based on a systematic presentation of good news. However, they did not study intra-variability at all. Intra-variability may be considered a more careful and subtle form of impression management technique, rather than the presence/absence of some textual characteristics usually analyzed by previous literature (Cherry et al., 2023; Moreno and Jones, 2022).
2. Theoretical framework
In contrast to an incremental information approach, impression management derives from the argument that managers have incentives to show a self-serving view of corporate performance (Merkl-Davies and Brennan, 2007; Moreno et al., 2019). Impression management is rooted in social psychology. Goffman (1959) presented this framework using a performance to explore how people present an image of how they believe their audience wants to see them. Similar to individuals, companies are also concerned with their presentation of the firm's image and can use organizational impression management strategies to influence stakeholders (Zaharopoulos and Kwok, 2017). Previous business research on accounting narratives tends to show that good news is disclosed whereas bad news is withheld (Bao et al., 2019; Guillamon-Saorin et al., 2012).
Courtis (1998) developed the obfuscation hypothesis by suggesting the presence of variability in the management's tendency to disclose good/bad news. In general, and “stated simply, [it] is that management is not neutral in its presentation of accounting narratives” (p. 466). Therefore, companies can have a special interest in hiding or obfuscating poor firm performance in an attempt to avoid possible negative consequences, such as decreases in managerial compensation. Accordingly, previous research has widely studied whether companies with poor performance disclose information less clearly than companies with good performance, using for instance more syntactically complex reports (de Souza et al., 2019; Hassan et al., 2019; Li, 2008). However, these studies mainly focus on inter-variability (differences between companies) rather on intra-variability (differences within a document).
Psychology research argues that the way in which events and issues are disclosed affects readers' understanding (Price et al., 1997). Organization of information may affect evaluation judgements by varying demands on the cognitive process (Maas and Verdoorn, 2017). Readers usually pay more attention to information displayed earlier rather than later (Anderson, 1965). Related to the limitation of memory and attention capacity in human beings (Hogarth and Einhorn, 1992), psychology literature has explored not only primacy but also recency effects. This line of research on communication has addressed the importance of location in news releases (Zillmann et al., 2004). From an accounting point of view, these practices could be misleading, could result in capital misallocation (Adelberg, 1979), and could distort stakeholders (Elliott, 2006). Although the order of information has also been addressed in some accounting settings, especially in audit (Guiral and Esteo, 2006; Messier and Tubbs, 1994), no considerable attention has been paid to the location of news in corporate disclosure (Boudt and Thewissen, 2019).
In particular, Courtis (1998, p. 465) argues that “one example of how obfuscation could occur is the prediction that management would use the middle passages of this address [Chairman's Address/President's Letter] to “bury” adverse or negative news through a writing style that is more difficult to read than the introduction and conclusion passages of the narratives.” Accordingly, the middle section of low-performing companies' reports would be more syntactically complex than those of high-performing companies. This particular form of obfuscation may be called location obfuscation.
Limited research has analyzed syntactical complexity intra-variability in presidents' letters, in Hong Kong (Courtis, 1998), the UK (Clatworthy and Jones, 2001), Australia (Bayerlein and Davidson, 2012), and Nordic countries (Pasko et al., 2020). It has found different patterns of variability. Courtis (1998) and Clatworthy and Jones (2001) agree that the first part is the least syntactically complex. However, they disagree about the most complex. For Courtis (1998) it is the middle, while for Clatworthy and Jones (2001) it is the final part. Bayerlein and Davidson (2012) and Pasko et al. (2020) find that the middle section is the most syntactically complex, while the first and last do not differ significantly.
In order to test the (location) obfuscation hypothesis, Courtis (1998) and Clatworthy and Jones (2001) select the 30 top and bottom companies ranked by profitability. However, neither finds significant differences in the respective variability patterns between top- and bottom-performing companies. Their results therefore do not support the obfuscation hypothesis. Instead of identifying a report as positive (top) or negative (bottom) depending on profitability, Bayerlein and Davidson (2012) use connotation-based categories on a sentence-by-sentence basis. However, and similar to previous research, they do not find support for the obfuscation hypothesis [2]. Unlike the three previous studies, Pasko et al. (2020) do not focus on syntactical complexity intra-variability but rather analyze it marginally. Their results were not compatible with the obfuscation hypothesis. According to the obfuscation hypothesis, this paper tests whether.
The middle section of company presidents' letters during a low-performance period is more syntactically complex than during a high-performance period.
The most and least syntactically complex sections in company presidents' letters during a low-performance period are different from those during a high-performance period.
Apart from syntactical complexity, the location of attributions may also be used strategically. Attribution theory describes how people infer the causes of events (Försterling, 2001). Attributions provide reasons for past achievements or disappointments. They have also been typically studied in presidents' letters (Lehmberg and Tangpong, 2020) as well as in other documents, such as directors' reports (Aerts, 2005) or IPO prospectuses (Aerts and Cheng, 2011). Attributions are related to the factors involved in perceived causation (Baginski et al., 2000; Berkin et al., 2023). Previous research on corporate disclosures has found an overwhelming focus on positive attributions, irrespective of firm performance (Clatworthy and Jones, 2003; Hooghiemstra, 2010). Attributions are considered to be self-serving or biased when managers take credit for success and avoid blame for failures (Lehmberg and Tangpong, 2020; Suárez Fernández, 2016). For that purpose, positive performance tends to be attributed to internal causes, and negative performance tends to be attributed to external causes (Brennan and Merkl-Davies, 2022). This pattern is extensively supported by previous literature (Clatworthy and Jones, 2003; Lehmberg and Tangpong, 2020; Tsang, 2002) and is generally considered as impression management.
Staw et al. (1983) find some evidence that the location of positive and negative information in presidents' letters is different between high- and low-performing companies. According to the obfuscation hypothesis (Courtis, 1998), negative attributions would be located in the middle section. Thus, the middle section of low-performing companies' reports would contain a higher number of attributions than those of high-performing companies. Boudt and Thewissen (2019) find that CEOs manage investors' expectations by strategically positioning positive and negative words in CEO letters. They further show that readers can use the positioning of words in CEO letters to identify impression management and predict future firm performance more accurately.
Rosenkranz and Pollach (2016) argue that the location of a financial figure in the document is believed to influence readers' perceptions of corporate performance. Focused on corporate earnings releases and their corresponding news-agency releases, they find that the lead paragraph is the most popular place to introduce financial figures in both documents. Therefore, figures that present corporate performance more favorably might be placed in the headline or lead section of a text (Elliott, 2006; Henry, 2008). This would be in line with the primacy effect found by Baird and Zelin (2000) in the qualitative information of presidents' letters. However, evidence of a recency effect has also been found (El-Sayed et al., 2021; Hellmann et al., 2017; Pinsker, 2011; Tuttle et al., 1997). For instance, El-Sayed et al. (2021) find that non-professional investors are prone to a recency effect from the intentional ordering of corporate narratives, when using narratives with low readability. In any case, the information order structures the location of information and could formulate an intended reading pattern (Hellmann et al., 2017). However, there are no previous studies systematically analyzing intra-variability in attributions in different parts of presidents' letters in relation to performance. Based on the obfuscation hypothesis, this paper tests whether.
The middle section of company presidents' letters during a low-performance period contains more attributions than during a high-performance period.
The sections of company presidents' letters with the highest and lowest number of attributions during a low-performance period are different from those during a high-performance period.
3. Context
The global financial crisis of 2007–2008 “is characterized as the most serious economic downturn since the Great Depression” (Pereira and Cerqueira, 2023, p. 47). In Spain, it was the turning point from an extraordinary period of development to one of the deepest periods of impoverishment. Thus, the beginning of the twenty-first century in Spain witnessed two extremely different economic cycles. The behavior of the Spanish index, IBEX 35, reflected this situation. Among the main world stock exchange indexes, IBEX 35 was one of the best indexes in the first part of the century and one of the worst indexes during the global financial crisis. Specifically, in the highly positive period from 2002 to 2007, the average annual growth rate was 12.46%. In the highly negative period from 2008 to 2012, it was −8.96%. This involves the biggest span in rates between these two periods of all the main world stock exchange indexes, as shown in Table 1.
In the first years of the twenty-first century, Spain was one of the fastest-growing economies in Europe. This spectacular growth created more than a half of all the new jobs in the European Union. Spanish corporations expanded abroad and occupied top world positions in sectors such as banking, construction, and telecommunications. The stock market constantly rose and the economy purred (The Economist, 2006).
That prosperity changed deeply from 2008. The global financial crisis precipitated the collapse of Spain's once-buoyant housing market and pitched the economy into recession (The Wall Street Journal, 2009). With the puncturing of the credit bubble in real estate financing generated during the prosperous years, the country really suffered the consequences, not only of the global financial crisis but also of an economic and social crisis (Royo, 2009). The real estate and banking sectors were considered to play a key role in the root of the crisis (Carballo-Cruz, 2011). All European countries were weakened by the crisis, but Spain seemed to contain a continent's-worth of frailties in just one country (The Economist, 2010). It suffered one of Europe's worst recessions (The Wall Street Journal, 2009).
4. Sample
Our analysis is based on the database used by Moreno and Jones (2022). They selected the companies composing the main Spanish stock exchange index, IBEX 35, on 31 December 2013 and searched for the series of presidents' letters for those companies from 2002 to 2012. From the 35 companies composing the index, the final sample consisted of the full temporal series of presidents' letters of 24 companies (comprising the 84% of the weight of the index). It comprises 264 presidents' letters from 2002 to 2012.
In a supplementary analysis (Subsection 6.4), the sample was extended with an additional timeframe (2017 vs. 2020) in order to analyze potential differences between pre and post COVID-19 pandemic years. The average length of the presidents' letters in the sample is shown in Table 2.
5. Methodology
5.1 Division of the letters into three parts
Each president's letter was divided into three parts (first, middle, and last) and, different from previous research, all three parts in their entirety were included in the analysis. For that purpose, the 264 pdf files (plus 46 in the COVID-19 supplementary analysis) were first converted into text format, through copying from pdf and pasting the text into a text editor. Second, in order to separate 1/3 from 2/3 and 2/3 from 3/3, two cut-off points were needed in every document. The number of characters in each document was counted using spreadsheet software. This figure was divided into three, with the first third of the characters allocated to the first part, the second third to the middle part, and the last third to the last part. The sentence including the character separating two sections was removed entirely. This selection procedure is more objective and accurate than that employed in previous intra-variability studies.
These previous studies (Bayerlein and Davidson, 2012; Clatworthy and Jones, 2001; Courtis, 1998; Pasko et al., 2020) also divide the president's letter into three parts but only select a 100–150-word sample from each section. This brief selection may not be representative of the whole section. This could be especially problematic in the middle section, where the selection of the sample might be random.
5.2 Analysis of syntactical complexity
Most previous studies about reading difficulty in financial reporting have focused on syntactical complexity formulas, such as Flesch, Fog, Dale-Chall, Lix, and others. They are simple, quick, inexpensive, and passive, not requiring reader participation (Jones, 1997; Moreno and Casasola, 2016). However, they are unable to capture jargon, concept difficulty and density, coherence of arguments, or graphic design (Dalwai et al., 2021; Hassan et al., 2019).
Despite these concerns, syntactical complexity formulas, and especially the Flesch index (Flesch, 1948), are widely used by accounting research (Hassan et al., 2019; Moreno and Casasola, 2016). The Flesch index was specifically used by previous accounting studies analyzing intra-variability (Bayerlein and Davidson, 2012; Clatworthy and Jones, 2001; Courtis, 1998; Pasko et al., 2020). Therefore, for comparability reasons and because it is one of a few formulas that has been adapted and tested on Spanish texts [3], this paper assesses syntactical complexity with the Flesch formula adapted into Spanish by Fernández Huerta (Fernández Huerta, 1959) [4]. To calculate the score, INFLESZ [5] was used. This software has previously been used in accounting research (Melón-Izco et al., 2021; Moreno and Casasola, 2016). To make sure the formula works as intended, the texts were manually refined (Alcaide-Ruiz and Bravo-Urquiza, 2022; Moreno and Jones, 2022). The following information was removed: (1) amounts expressed in numbers and percentages; (2) any full stop from abbreviations and acronyms; (3) ellipsis (i.e. dots); (4) hyphens at the end of a line, separating a single word; and (5) bullet points at the beginning of sentences. Furthermore, full stops at the end of headings (if absent) were added. After this process, the software was run and a score was assigned to each three sections of every president's letter.
5.3 Analysis of attributions
Attributions are defined as “a phrase or a sentence in which an organizational event or performance outcome was linked with a reason or a cause for that event or outcome” (Aerts, 1994, p. 342). Similarly, Staw et al. (1983) define causal events as any explanation of results that noted how these had been caused by specific actions or circumstances. This study relies on the identification of attributions conducted by Moreno and Jones (2022) in the same database over the period 2002–2012. They conducted manual analysis in order to code the attributions or causal events. Manual attribution analysis is labor-intensive and subjective, but more sensitive and accurate than computerized attribution analysis (Clatworthy and Jones, 2003). Among other characteristics, positive/negative and internal/external orientation of attributions were coded. In this paper, each attribution was allocated, with the process described above, to each of the three sections of every president's letter [6]. The same method was followed to find and code the attributions in the COVID period.
Non-parametric tests were run to analyze intra-variability in syntactical complexity and attributions in the different analyses of the next section.
6. Results
The results of the main analysis studying intra-variability between the high- and low-performance periods are first described. In a second subsection, in order to analyze the differences between the most extreme performance behaviors in the crisis, only top- and bottom-performing companies are compared. In the third subsection, results are presented by sectors. In the fourth subsection, pre and post COVID-19 pandemic years are analyzed.
6.1 Main analysis
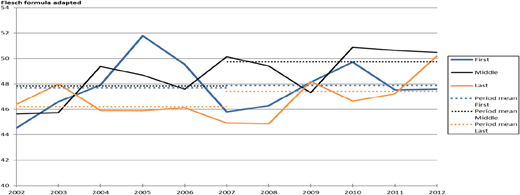
In relation to syntactical complexity variability, Panel A of Table 3 shows how, for the whole period, the middle part scores the highest value in the Flesch formula adapted into Spanish. This is considered to be the least syntactically complex, as a higher score in the formula means a lower syntactical complexity. The last part is considered the most syntactically complex. The first part has an intermediate score. The differences between the scores of the three parts are significant (according to a Kruskal-Wallis test, not reported in table format). In relation to the most syntactically complex part, our results are therefore in line with Clatworthy and Jones (2001) but differ from Courtis (1998), Bayerlein and Davidson (2012), and Pasko et al. (2020). The latter three studies find the middle part to be the most syntactically complex. In relation to the least syntactically complex part, our findings differ from Courtis (1998) and Clatworthy and Jones (2001), who identify the first part as the least syntactically complex.
The differences between the two performance periods are described next. According to the obfuscation hypothesis, the middle part should be more syntactically complex in the low-performance period in order to hide the poor performance of the companies (Courtis, 1998). Our results (Figure 1) do not show this behavior at all. In the second period, the middle part is not only still considered to be the least syntactically complex, but also sees the only significant decrease in syntactical complexity of the three different parts. This may even suggest incremental information especially in this section in the second period, in contrast to impression management. In fact, it is the only significant change of the three parts between the two periods (Panel A of Table 3). Therefore, H1a is not supported. In addition, the pattern of complexity for the three parts is quite similar in the two periods (there are the same least and most syntactically complex parts in all periods), and H1b is also not supported. Overall, no evidence of obfuscation is found in respect to the syntactical complexity intra-variability analysis.
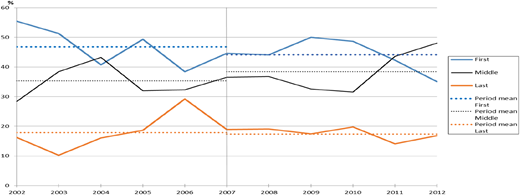
Regarding attributions, 865 attributions were manually found and coded by Moreno and Jones (2022). In this paper, as a consequence of the process described in the Methodology section, 832 of them (96.2%) are certainly allocated to one of the three sections of the presidents' letters. As described in the Methodology section, the attributions included in any of the sentences containing the character separating two sections were removed from this analysis. This was the case for 33 attributions (3.8%). Finally, as Panel B.1 of Table 3 shows, 379 (45.5%) were allocated to the first section, 306 (36.8%) to the middle section, and 147 (17.7%) to the final section.
The first part contains the highest number of attributions in all of the periods. The second part consistently contains an intermediate number of attributions in all of the periods. The last part contains the lowest number of attributions in all of the periods (Figure 2). Consequently, there are no significant differences in attributions between the periods (Panel B.1 of Table 3). Therefore, the location of the attributions in the sections of the presidents' letters does not change from a high-performance period to a low-performance period. Our results, thus, do not support H2b. In relation to the middle section, the percentage of attributions in the low-performance period is marginally higher than in the high-performance period. This directional change is in line with impression management. However, it is not significant. Therefore, our results also fail to support H2a. Overall, no significant evidence of obfuscation is found in relation to the variability of attributions.
Positive and negative attributions were also analyzed separately. Panel B.2 of Table 3 shows how neither positive nor negative attributions in each section differed significantly between the two periods. As commented earlier, Moreno and Jones (2022) do not study the location of attributions but find that the balance of total positive and negative attributions hardly differed between the high-performance period and the crisis period (positive attributions dominate extensively in the global financial crisis too). For this reason, apart from the difference between periods, this paper also analyzes the difference between positive and negative attributions over the whole period, in each of the sections. Similar to the previous analysis, the results do not show any significant difference between positive and negative attributions. In conclusion, the analysis of positive and negative attributions reinforces the previous findings.
6.2 Relative performance analysis
To complement our previous results in an attempt to consider the impact of the crisis on the underlying firm performance, the top five and bottom five companies in the crisis period are compared. This supplementary analysis provides an additional attempt for different disclosure patterns to emerge between different (top/bottom) performing companies, selected by the average annual change in profit before taxation. Opposite average annual rates were found in the top (positive rates) and bottom (negative rates) companies. Thus, differences in line with impression management are expected, with the objective to obfuscate negative performance (Courtis, 1998). To interpret the research hypotheses in line with this relative performance analysis, the top companies are representative of high performance (equivalent to the high-performance period) and the bottom companies are representative of low performance (equivalent to the low-performance period).
No significant differences in syntactical complexity are found in any of the three sections between the top and bottom companies (Panel A of Table 4). However, there are marginal increases in syntactical complexity in the middle and final sections, and a marginal decrease in the first section of the bottom companies. The change in the direction of the middle part is in line with impression management, but it is not significant. Therefore, H1a is not supported. The differences in the three sections, although not significant, involve a slight change in the variability pattern. The top five companies show the pattern 231 (1 represents the first section, 2 the middle section, and 3 the last section, and the order is related to the degree of complexity from the least to most complex, where the middle section is the least syntactically complex section and the first section is the most syntactically complex), whereas the bottom companies show a pattern of 213. As both (most and least complex) parts did not change, H1b is not supported [7].
In the case of attributions, the differences in the middle and last parts are found to be significant (Panel B of Table 4). The middle section of the bottom companies contains a higher number of attributions than that of the top companies, and the last section of the top companies contains a higher number of attributions than that of the bottom companies. In particular, the difference in the middle section is in line with the obfuscation hypothesis and therefore in line with H2a. In relation to the pattern of the location of attributions, the top companies follow 312 and the bottom companies follow 213. These different patterns are in line with H2b. Therefore, the support of the two hypotheses related to attributions points to the bottom companies using attributions in the global financial crisis in a way that can be considered in line with the obfuscation hypothesis.
In relation to the differences in positive and negative attributions, the number of positive attributions in the middle section in the bottom companies is significantly higher than in the top companies (not reported in table format to save space). The number of positive attributions in the last section in the top companies is significantly higher than in the bottom companies. Positive attributions follow the same pattern as the attributions as a whole (312 in the top and 213 in the bottom companies). There are no significant changes in negative attributions between the top and bottom companies, probably influenced by the very limited number of negative attributions. There are also no significant differences between positive and negative attributions.
6.3 Results by sectors
Impression management can be also influenced by company sector (Aerts, 2005; Merkl-Davies and Brennan, 2011). Crises may have different impacts on sectors, and the managers of different sectors can react differently and adopt different disclosure patterns. According to the stock exchange authority, the companies of the IBEX 35 are allocated to one of six different sectors: Petrol and Power (5/5); Basic Materials, Industry and Construction (9/6); Consumer Goods (4/4); Consumer Services (4/1); Financial Services and Real Estate (9/6); and Technology and Telecommunications (4/2). The first figure in brackets means the number of companies in the index of each sector. The second figure shows the number of companies from each sector in the sample. In the case of the Consumer Services and Technology and Telecommunications sectors, the results could be distorted because only one and two companies in these sectors, respectively, are part of the sample. Therefore, these two sectors are omitted from this sectoral analysis (Table 5).
The syntactical complexity variability (Panel A of Table 5) for the whole period shows significant differences between sectors in the case of the first and last parts of the letters, but not for the middle part (according to Kruskal-Wallis tests, not reported in table format). The middle part is not the most syntactically complex in any sector, in any of the periods. The last part is the most syntactically complex in any sector in any period.
In relation to the differences between periods, the only sector in which complexity increased in the middle part from the first to the second period is Consumer Goods. However, this difference is not significant. In the other three sectors, complexity decreased in the middle part (in two of them significantly). Consequently, H1a is not supported for any of the sectors.
For the whole period, the Petrol and Power and Consumer Goods sectors follow the same pattern of syntactical complexity variability found in the main analysis (213). The Basic Materials, Industry and Construction and Financial Services and Real Estate sectors follow the pattern 123. In relation to the changes in pattern between the two periods, the Petrol and Power sector does not change. The Basic Materials, Industry and Construction, and Financial Services and Real Estate sectors change from 123 to 213, and the Consumer Goods sector changes from 213 to 123. This means that in these three sectors, the least complex part changes, but not the most complex. Therefore, no sector supports H1b.
On variability in attributions (Panel B of Table 5), for the whole period, there are significant differences between sectors in every section (according to Kruskal-Wallis tests, not reported in table format). For the whole period, every sector contains the highest number of attributions in the first section and the lowest number of attributions in the last section (in this latter case, except for Consumer Goods).
In relation to the changes between the two periods, there is only one sector with a significant increase of attributions in the middle section in the low-performance period. This is the Financial Services and Real Estate sector. In addition, in this sector, this middle section is the one with the highest number of attributions in the low-performance period. This behavior is in line with the obfuscation hypothesis as it is compatible with an attempt to obscure attributions in the low-performance period. This is, therefore, the only sector clearly supporting H2a (there is also a marginal, not significant increase in attributions in the middle section in the Petrol and Power sector, and marginal decreases in the other two sectors).
In relation to the changes in the pattern of attributions between the two periods, the section with the highest number of attributions only changed in the Financial Services and Real Estate sector. The section with the lowest number of attributions only changed in the Basic Materials, Industry and Construction sector. The results do not show a change in both sections with the highest and lowest number of attributions in any sector. Therefore, no sector supports H2b.
6.4 Analysis of the COVID-19 period (2017 vs. 2020)
As suggested by one of the reviewers, different types of crises might have different influences. In the global financial crisis, the roots of poor corporate performance may be attributable to external factors. This crisis generated a global problem, and the consequences were not limited to the financial and economic spheres, but had much broader and deeper social and cultural consequences (Himanen, 2012). In this sense, the global crisis generated by the COVID-19 pandemic may be to some extent comparable to the global financial crisis. However, the demands for transparency and trust in companies' disclosure were probably different, as corporate managers were at least partly seen as responsible for the origin of the financial crisis, but not the COVID-19 pandemic (Moreno and Jones, 2022). They may involve different disclosure implications. Therefore, to complement our previous findings and contribute to literature examining COVID-19 in corporate disclosures (Brennan et al., 2022; Cherry et al., 2023; Crovini et al., 2022), pre and post COVID-19 pandemic years are analyzed.
In contrast to the main analysis, where the outbreak of the global financial crisis was the turning point from a long positive to a long negative period, as reflected by the IBEX 35, in the case of the COVID-19 pandemic long periods cannot be identified. The IBEX 35 shows alternatively positive and negative years (2016: −2.0%; 2017: +7.4%; 2018: −15.0%; 2019: +11.8%; 2020: −15.5%; 2021: +7.9%; 2022: −5.6%).[8] Isolated years were then compared. The year 2020 was selected as representative for the COVID-19 pandemic (low-performance year) and 2017 was selected as the basis of comparison (high-performance year). The year 2019 was not selected because, while it was positive, the annual reports for this year were prepared and published in the first months of 2020 and the narratives might already be biased by the pandemic.
In relation to syntactical complexity, Panel A of Table 6 shows that, with similar syntactical complexity means, the first and middle sections are the least syntactically complex sections in both years, 2017 and 2020. The last section is the most syntactically complex section in both years. Regarding the differences between the two years, there is an increase in syntactical complexity in the three sections in 2020; however, this increase is only significant in the first section. Because the increase is not statistically significant in the middle section, H1a is not supported. In addition, the pattern of complexity is quite similar in the two years, and H1b is also not supported. Overall, no clear evidence of obfuscation is found in relation to syntactical complexity.
As for the attributions, following the same method as Moreno and Jones (2022), 149 attributions were manually found and coded (in 2017 and 2020). Later, following the same method as in the main analysis, 141 (94.6%) were allocated to one of the three sections. In detail (Panel B of Table 6), 54 (38.3%) were allocated to the first section, 54 (38.3%) were allocated to the middle section, and 33 (23.4%) to the final section. In 2017, the middle section contains the highest number of attributions, followed quite closely by the first section. The final section clearly contains the lowest number of attributions. The findings are similar in 2020 but with the middle and first sections interchanging their positions. Consequently, the location of the attributions in the sections does not change significantly in the COVID-19 pandemic. Then, H2b is not supported. In addition, the percentage of attributions in the middle section is not higher in 2020 than in 2017. Therefore, H1a is also not supported.
In relation to positive and negative attributions, the number of negative attributions increases in the COVID-19 pandemic, but positive attributions still predominate (not reported in table format to save space). In relation to the differences in the location of positive and negative attributions, the results show that neither positive nor negative attributions differ significantly in each section between the two years.
7. Discussion and conclusion
The order of information presentation may influence judgements and investor decisions through the exploitation of human cognitive constraints (Hellmann et al., 2017). This paper studies whether managers provide information in different locations of corporate disclosure compatible with the obfuscation hypothesis. It has analyzed intra-document variability (first, middle, and final sections in the presidents' letters) in syntactical complexity and attributions between companies in two extremely different market-based periods, characterized by the global financial crisis. In a supplementary analysis, pre and post COVID-19 pandemic years are also analyzed. The setting is provided by a civil-law country. Although the results do not show clear evidence of location obfuscation, in this case, managers seem to prefer to change the location of news rather than increase syntactical complexity in different sections of the document. The present paper contributes to literature on information asymmetries and corporate disclosure.
Table 7 summarizes the hypothesis testing. Contrary to our hypotheses, no evidence has been found of syntactical complexity intra-variability being used for impression management purposes. Not only for the whole period but also for the two separate periods, the least syntactically complex section was the middle one (in contrast to Clatworthy and Jones (2001) and Courtis (1998), who identify the first part as the least complex). The most complex was the last section (in line with Clatworthy and Jones (2001) but different from Bayerlein and Davidson (2012), Courtis (1998) and Pasko et al. (2020), who find the middle section to be the most complex).
On attributions, in general the first section contains the highest number, the second section contains an intermediate number, and the last section contains the lowest number of attributions. Only the relative performance analysis between the top and bottom performers shows evidence of news (item) placement in line with the obfuscation hypothesis. In the crisis, poor performers, with higher incentives to obfuscate negative performance (Hassan et al., 2019), significantly increased the attributions contained in the middle section and also changed the total variability pattern of attributions. In addition, there are also directional changes, though not significant, in line with impression management in the main analysis. All of this shows that managers are more prone to use intra-variability in attributions rather than in syntactical complexity in line with the obfuscation hypothesis. Similar to the main analysis, the analysis of the COVID-19 period does not show a clear pattern compatible with the obfuscation hypothesis.
Conclusions about the results by sectors should be taken carefully because of the small size of the sample. The Financial Services and Real Estate sector is the one whose behavior could be most clearly interpreted in line with the obfuscation hypothesis. Interestingly, this sector significantly increased the attributions in the middle section in the low-performance period, with this section becoming the one with the highest number of attributions in that period. These changes could be used to try to obscure news in line with impression management. This finding can be related to the key role that this sector played in the root of the crisis (Carballo-Cruz, 2011). Managers of this sector could have felt more responsible for the situation and therefore been most reactive to the crisis.
The findings also show that focus matters. In the case of attributions, the paper finds positive results between the top and bottom companies, but not between positive and negative periods. Extreme conditions between companies are required for differences to emerge. Although in our setting there were two extremely different performance periods, this was not enough to detect differences. Therefore, impression management is maybe more likely in extreme differences between companies. This is the case of some previous literature, which finds impression management in the analysis of multiple textual characteristics. They select top and bottom companies according to accounting profit (Cen and Cai, 2013, 2014; Clatworthy and Jones, 2006).
The context probably also influenced our results. On the one hand, in a situation of a widespread crisis, there could be fewer incentives to incur impression management. Previous literature that has analyzed the influence of the global financial crisis on reporting quality seems to indicate a decrease in corporate opportunistic disclosure (Chintrakarn et al., 2017; Filip and Raffournier, 2014). In crisis, poor performance is already anticipated by shareholders (Patelli and Pedrini, 2014), and expected losses are less disappointing than unexpected losses (Lara et al., 2021). This could explain the overall reduced level of impression management of our findings. On the other hand, this research is conducted in a civil-law country, in contrast to most research based on common-law countries. They have different degrees of investor protection and capital markets (La Porta et al., 1997), and can then produce different disclosures (Moreno and Camacho-Miñano, 2024). Both context-based reasons can influence a different level of impression management in relation to previous research.
An alternative explanation for the inconsistent use in our findings of impression management could be related to the evidence found by Moreno and Jones (2022). With the same database, they find that despite different conditions (especially bad facts in the low-performance period), presidents' letters were based on a systematic presentation of good news. Then, if managers are already incurring impression management because they overwhelmingly disclose positive information, they maybe do not need to use other, subtler impression management techniques such as intra-document variability. Even in this case, this study is warranted, as managers could also have used intra-document variability to obscure this “positive news” during the crisis in relation to the positive news in the pre-crisis period.
More evidence, especially with larger samples, is required to increase the reliability of the results, particularly the findings by sectors. In special, a call for more research is made about the financial sector. Based on common practice, most previous research on financial reporting excludes banking institutions from analysis (Bratten et al., 2019). In addition, our findings are limited to a single civil-law country. Further research in different settings would be advisable in order to anticipate the expected level of impression management in civil-law countries in relation to common-law countries. Additional research from a user perspective is also commended to assess the real impact of disclosing news in the middle part of accounting documents, in relation to primacy or recency effects.
The author is grateful to participants at the 41st annual congress of the European Accounting Association held in Milan (Italy) and 22nd Financial Reporting and Business Communication Annual Conference held in Bristol (UK) for their helpful suggestions on earlier drafts of this paper.
Notes
Jones et al. (2020) marginally analyzed the location of graphs, but not the narrative information.
Clatworthy and Jones (2001) found the thematic structure was a key driver of the variability of syntactical complexity between the sections. Bayerlein and Davidson (2012) explained the differences were due to the high level of syntactical complexity of the largely positive connotation group across all sections.
Most syntactical complexity formulas were designed only for the English language and are not applicable to other languages (see Moreno and Casasola, 2016, for more detailed information about this issue).
Formula: 206.84–0.6 wl – 1.02 sl (wl: number of syllables per 100 words; sl: average number of words per sentence). An increase in the score of the formula means a decrease in syntactical complexity.
Available at Link to the website.
Apart from syntactical complexity and attributions, the location of graphs was also primarily explored. However, further analysis was disregarded because only 8% of the presidents' letters of the sample contained graphs.
In an additional analysis, differences between (different) top and bottom companies in the first period (2002–2007) were also analyzed. In this case, even the bottom companies showed a positive average annual rate and thus no impression management was expected. H1a, H1b, and H2a were not supported, but H2b was supported (results are not reported to save space). Moreover, by identifying the most extreme years in each period, an additional supplementary analysis on a one-year basis was conducted. The year 2006 (2008) was identified as that with the highest (lowest) annual growth rate of the IBEX35, +34.79% (−39.43%) in the first (second) period. We therefore compared 2006 vs. 2008 as representative of their respective periods. The results were similar to the main analysis, and H1a, H1b, H2a, and H2b were not supported (results are not reported to save space).
Information extracted from Investing.com.