Skip to Main Content
Purpose

As climate change continues to escalate, the urgent challenge of protecting heritage structures vulnerable to earthquakes in flood-prone areas cannot be ignored. Conducting thorough vulnerability assessments is essential to tackle this pressing issue, aligning with the United Nations’ Sustainable Development Goals 11 and 13 and New Zealand’s National Climate Change Adaptation Plan.

Design/methodology/approach

This study introduces an index-based approach to evaluate the flood vulnerability of earthquake-prone heritage buildings in Auckland, New Zealand, taking into account the evolving climate patterns. Data collection involved document analysis, on-site observations and mapping of ten earthquake-prone heritage buildings in Auckland.

Findings

The results reveal significant variations in 11 identified flood vulnerability indicators across the selected buildings, categorised into “Exposure”, “Susceptibility” and “Resilience”. The type of use, surface condition, number of storeys and finishing material of the façades were identified as the most influential indicators affecting the flood vulnerability of the selected buildings.

Originality/value

The study’s findings offer significant insights for stakeholders involved in the preservation of earthquake-prone heritage buildings in New Zealand, particularly in the context of increasing flooding risks from climate change. By providing a robust decision-making framework, the study enables local communities, heritage organisations and government bodies to collaborate more effectively in safeguarding cultural assets. The introduction of a quantitative intervention priority index is a valuable tool for assessing flood vulnerability, enabling stakeholders to prioritise resources and actions based on specific indicators. Ultimately, these insights will help protect New Zealand’s rich heritage and support its flood resilience efforts.

Heritage buildings play a pivotal role in both preserving the nation’s historical narrative and fostering community identity, while also serving as catalysts for economic growth in urban areas and enhancing their vibrancy Besen et al. (2020). Additionally, these buildings can support sustainable development goals through adaptive reuse, hence reducing energy consumption and minimising pollution levels in the built environment (Aigwi et al., 2023). Nonetheless, it is crucial to consider climate change and seismic resilience as key factors in safeguarding these structures.

New Zealand is positioned at the intersection of the Australian and Pacific tectonic plates, making it highly vulnerable to seismic activity (Besen et al., 2020). As per the regulations in New Zealand, earthquake-prone buildings refer to buildings or sections of buildings that are unable to withstand a moderate earthquake due to their condition, construction, and the soil on which they are built (MBIE, 2016). The identification of earthquake-prone buildings involves the local authorities’ recognition, categorisation, and engineers’ evaluations (MBIE, 2017). Due to the early construction time, construction methods, structures, and configurations, heritage buildings are more susceptible to earthquakes (Kamal and Brar, 2021). To address this issue, new earthquake-prone building regulations have been implemented to enhance the structural integrity of these buildings (Tong et al., 2022), leading to a proliferation of related research efforts (Aigwi et al., 2019, 2020, 2021; Besen et al., 2020; Filippova and Noy, 2020; Hoang et al., 2021; Murphy, 2020). However, heritage buildings also face the challenge of climate change, which poses a significant threat to their preservation.

The diverse climatic classifications of New Zealand make it vulnerable to various effects of climate change, including increased air and sea temperatures, heat waves, flooding, and rising sea levels (Pachauri and Meyer, 2015). These effects will have significant consequences for building performance. The construction of heritage buildings did not consider the impacts of climate change. Unusual weather patterns, now occurring more frequently due to climate change, can lead to significant deterioration in heritage buildings, thereby diminishing their functional and physical lifespan (Phillipson et al., 2016). This deterioration further restricts the adaptability and modification potential of these structures as needed (Sesana et al., 2018).

There are many earthquake-prone heritage buildings in New Zealand at risk of flooding caused by heavy rain and sea level rise. For instance, in Wellington, more than 100 earthquake-prone heritage buildings (Wellington City Council, 2023b) are under threat from flooding (Wellington City Council, 2023a). Besides, from Auckland’s protected heritage buildings, 220 require seismic strengthening (Bade, 2020), 261 are in flood-prone areas, and a 1-m sea level rise will affect 455 buildings (Bade, 2021). Furthermore, Whenua Māori and the land restored via the Treaty settlement process are frequently in low-land areas that are vulnerable to flooding on the coastal edge (Ministry for the Environment, 2022). Without mitigation measures in place through vulnerability assessments, Māori heritage buildings may be affected, and the distinct cultural and spiritual relationship of Māori to whenua may be damaged by climate change-induced flooding (Ministry for the Environment, 2022).

New Zealand is committed to achieving the Sustainable Development Goals, specifically Goal 11, which aims to enhance the inclusivity, security, resiliency, and sustainability of cities and human settlements (United Nations, 2022a). Additionally, Goal 13 targets immediate action on climate change and its effects (United Nations, 2022b). The country’s National Climate Change Adaptation plans include assessing climate change threats to heritage buildings and minimising their effects (Ministry for the Environment, 2022). Therefore, it is imperative to assess the vulnerability of earthquake-prone heritage buildings to climate change to promote sustainable cities and human settlements and mitigate disaster risks. The identification and grading of vulnerable buildings, coupled with the implementation of appropriate mitigation strategies, can guide decision-making, prioritise resource allocation, significantly reduce potential damage, and bolster climate resilience.

Regrettably, previous studies have overlooked the intersection of climate-induced flood vulnerability and earthquake-prone heritage buildings within the New Zealand context. This study aims to fill this significant research gap by proposing an index-based approach designed to quantify and classify the flood vulnerability of New Zealand’s earthquake-prone buildings. By developing this innovative approach, the research will provide valuable insights into the resilience of heritage buildings, enabling better preservation strategies and risk management practices in the face of climate-induced flooding and seismic activity. Ultimately, this research has the potential to inform policy and practice, protecting New Zealand’s cultural heritage for future generations.

This section reviews literature on the impact of climate-induced flooding on heritage buildings, the concept of flood vulnerability, approaches to assessing flood vulnerability, particularly index-based methods, and the Flood Vulnerability Index (FVI).

Climate change poses significant threats to the preservation of heritage buildings, especially in terms of their high vulnerability when exposed to unpredictable flooding occurrences in many parts of the world (Das and Scaringi, 2021; Fernandez et al., 2016; Islam et al., 2021; Nasiri et al., 2016). Accordingly, the results from a recent analysis conducted by Arrighi (2021) on 1,121 heritage sites indicate that over one-third of natural and one-fifth of mixed and cultural UNESCO Tangible World Heritage sites are situated in flood-prone regions.

Recently, climate-induced flooding severely damaged cultural assets in many Central European regions. For instance, in 2018, historic towns in the Adriatic region of Central Europe experienced sea floods brought on by high tides, storm surges, and/or intense rains, or a combination of these. The primary and secondary structural damage, material deterioration, and roof and façade damage were the main effects on heritage buildings (Porębska et al., 2019). In Denmark, urban flooding has increased in Odens, and cultural heritage is one of the main sectors affected (Kaspersen and Halsnæs, 2017). In the United States, there is an increase in the risk of flood hazards to archives (Mazurczyk et al., 2018). In Australia, some rock art sites will be affected by climate-induced flooding in the next few years (Sesana et al., 2021).

Similarly, Auliagisni et al. (2022) warned that in New Zealand, flooding is more frequent and intense in response to climate change, presenting a serious threat to the preservation of historic structures. Some significant New Zealand heritage sites are not only earthquake-prone but also located near beaches or rivers that are prone to flooding. For instance, the wharenui (i.e. large communal house) of the “Te Ore” Marae (i.e. Māori meeting ground) was declared earthquake-prone by the district council in 2017 (McCaull, 2022) and is located in Masterton, Wairarapa, at the risk of surface and river flooding (Greater Wellington, 2003). Also, in Whanganui, the ground level of the earthquake-prone heritage building “Thains”, which has an NBS (New Building Standard) rating of only five per cent, was flooded in 2015 (Aigwi et al., 2020).

Floods cause historical materials and structures to become significantly more damp, which degrades them physically, chemically, and biologically (Dassanayake et al., 2015). Besides, variations in soil moisture content can hasten several deterioration processes, such as the development of fungi that damage wooden structures and the mobilisation and crystallisation of salts that cause stone surfaces to deteriorate (Haugen and Mattsson, 2011). As a result, the impact of climate change-induced flooding on earthquake-prone buildings, which are already relatively structurally weak, will be even more severe, making it more difficult to preserve heritage buildings.

The concept of “Vulnerability” as defined by the United Nations Intergovernmental Panel on Climate Change (UN IPCC) Working Group II in their Third Assessment Report (Watson and Albritton, 2001) comprises a combination of exposure, sensitivity, and adaptive capacity. This concept has been widely accepted by scientists and practitioners, leading to the development of numerous vulnerability indices that consider these three components (Ishtiaque et al., 2022; Nguyen et al., 2022; Parker et al., 2019; Yoo et al., 2011). Besides, the FVI study considers vulnerability as the level of damage that can be projected under particular exposure, susceptibility, and resilience circumstances (UNESCO-IHE, 2023).

Understanding the most effective strategies for reducing flood vulnerability can be achieved through vulnerability assessment, with a primary objective of informing decision-makers and specific stakeholders about the possibilities for adapting to the threats posed by flooding (Douben, 2006). In the domain of flood vulnerability modelling, there are two general models: the “Empirical” model and the “Synthetic” model (Dottori et al., 2016; Galasso et al., 2021). Whereas the empirical model incorporates a data set of observed damage and/or loss (Paulik et al., 2021), the Synthetic model is more appropriate for heritage buildings, as their data sets are often unspecified (Drdácký, 2010). Moreover, the notion that the Synthetic model is more suitable for heritage buildings is supported by the fact that there is no accepted method to determine the extent of damage to heritage buildings caused by disasters (Figueiredo et al., 2020; Stephenson and D’ayala, 2014).

Flood vulnerability assessments are crucial for evaluating the potential risks associated with flood hazards. Since the flood vulnerability assessments for heritage buildings need to be conducted based on the specific content of the buildings (Adger and Agnew, 2004), most researchers often adopt the “index-based approaches”, which involves the quantitative analysis of vulnerability based on relative indices (D’Ayala et al., 2020; Davis et al., 2023; Miranda and Ferreira, 2019; Nguyen and Van Nguyen, 2019; Nguyen et al., 2022). Accordingly, index-based approaches provide a comprehensive view of the overall flood vulnerability of the research region compared to alternative approaches (Nasiri et al., 2016). This approach makes spatially specific vulnerabilities visible through a transparent process with quantitative results and facilitates the incorporation of several vulnerability dimensions by using Indicators covering physical, cultural, and economic dimensions (Davis et al., 2023).

While index-based approaches are advantageous in many ways, they also have drawbacks. Firstly, due to their dependence on various indicators, they may not accurately represent the complete scenario (Balica et al., 2012; Huang et al., 2012). Secondly, analysing indicators independently often overlooks their interactions. Additionally, accurately measuring social, political, and environmental indicators can be challenging, as Khan (2012) pointed out. Furthermore, some subjectivity is involved in index weighting, as Figueiredo et al. (2020) noted. In addition, the choice of indicators is heavily influenced by the specific situation, which is a strength in conducting localised analyses but also a weakness as these approaches are not universal (Balica et al., 2012; Nasiri et al., 2016). Despite its flaws, the index-based assessment approach remains an appropriate method for assessing flood vulnerability in heritage buildings.

While some index-based approaches rely on categorised vulnerability indicators (i.e. exposure, sensitivity/susceptibility, resilience/adaptive capacity), others use more specific indicators. For example, Stephenson and D’ayala (2014) employed seven indicators to evaluate the overall flood vulnerability of heritage buildings in England. Their approach was applicable and straightforward at the “building” level. In contrast, Garrote et al. (2020) introduced a vulnerability matrix with three indicators to assess the danger of flooding of cultural heritage assets on a “regional” level. This approach was more straightforward and feasible to conduct with fewer indicators at a “regional” scale. Another flood vulnerability analysis of a historic neighbourhood in Malaysia was conducted using 12 indicators, revealing a more detailed and convincing analysis as more indicators were added (D’Ayala et al., 2020). Similarly, Trizio et al. (2022) evaluated the vulnerability of earthen buildings to flooding with 11 indicators. Although this evaluation was satisfactory and easy, its design only applied to earthen heritage buildings (Trizio et al., 2022).

The FVI of a building can be obtained by summing up the values of relevant vulnerability indicators (D’Ayala et al., 2020; Miranda and Ferreira, 2019; Stephenson and D’ayala, 2014). It does not consider the composite components of flood vulnerability. While the indicators used in index-based approaches are related to the components of flood vulnerability, their relationships with the overall FVI are consistent with the components (“exposure”, “susceptibility” or “sensitivity”, and “resilience” or “adaptivity”) they belong to (Smit and Wandel, 2006). Moreover, there are interaction effects of different components existing in the flood vulnerability assessment (Ishtiaque et al., 2022). Therefore, evaluating the overall FVI may be more complex than approaches that directly use specific indicators.

On the other hand, there is a gradual emergence of approaches that utilise indicators associated with vulnerability composite components. Some researchers have calculated the overall FVI by multiplying the values of exposure and sensitivity components (Miranda and Ferreira, 2019). While their approach has proven to be effective, it does not account for the influence of the resilience or adaptive capacity component. Other researchers have also assessed the flood vulnerability of heritage buildings in Portugal by multiplying the components of exposure and sensitivity, neglecting the consideration of resilience or adaptive capacity (Davis et al., 2023). Similarly, Gandini et al. (2018) included the sensitivity and adaptive capacity components in calculating the overall FVI of cultural heritage buildings to flooding, but the effect of exposure was excluded.

For a more comprehensive flood vulnerability assessment, recent approaches have incorporated all three components of flood vulnerability. For instance, in the study of flood vulnerability assessment in Vietnamese towns by Nguyen and Van Nguyen (2019), the formula for the overall FVI involved the “exposure”, “susceptibility”, and “resilience” components. The overall FVI was calculated as the sum of exposure and susceptibility values minus the resilience value. It is worth noting that, in their approach, resilience exhibited a negative relationship with flood vulnerability. However, this assessment pertained to normal villages rather than heritage buildings (Nguyen and Van Nguyen, 2019).

Furthermore, Nguyen et al. (2022) employed an index-based approach to assess flood vulnerability in the historic city of Vietnam’s Central Region, and the overall FVI was determined by dividing the sum of the values of exposure, susceptibility, and resilience by three. These component values were obtained by summing the values of related indicators with various weightings. Notably, in this approach, the resilience component had a positive relationship with the overall FVI, which contrasted with the approach adopted by (Nguyen and Van Nguyen, 2019). This discrepancy arises from different scholars’ interpretations of the concept of flood vulnerability and their application of diverse calculation formulas, even when considering the same components (Nguyen and Van Nguyen, 2019; Nguyen et al., 2022). Furthermore, the approach by Nguyen et al. (2022) operated at a regional level, considering additional socio-economic factors within communities.

Following an extensive review of the current literature concerning the impact of climate-induced flooding on heritage buildings and the methodologies employed for flood vulnerability assessment, it has become evident that no previous study has utilised an index-based approach to evaluate the flood vulnerability of earthquake-prone heritage buildings in New Zealand. This research is significant as it introduces an innovative index-based methodology specifically tailored to the New Zealand context. This approach not only deepens the understanding of the interactions between seismic risks and climate-related flooding hazards in the region but also offers valuable insights for developing resilience strategies aimed at preserving earthquake-prone heritage structures. Additionally, other flood-prone areas can benefit from this study by adapting its methodology to assess their own heritage buildings, which will enhance their understanding of the relationships between seismic and climate-related flooding risks.

This research proposes an index-based approach to assess the climate-induced flood vulnerability of earthquake-prone heritage buildings in Auckland, New Zealand, incorporating indicators associated with all three components, namely “Exposure”, “Susceptibility”, and “Resilience”. The calculation of the FVI is based on Eq. (1), as proposed by the flood vulnerability system developed by the UNESCO-IHE Institute for Water Education (UNESCO-IHE, 2023).

(1)

Where:

  1. E = “Exposure”, which is defined as the appearance of significant variables (of an environment, physical, or socioeconomic nature) that could cause harm in flooding-prone locations (Balica et al., 2012);

  2. S = “Susceptibility”, which refers to human environmental or socio-ecological circumstances that may cause hazards to have an impact (Turner et al., 2003); and

  3. R = “Resilience”, which can be defined as a system or community’s adaptive capacity or ability to reduce the risks and effects of floods on itself (Nguyen and Van Nguyen, 2019), frequently has an adverse relationship to vulnerability (Smit and Wandel, 2006).

Drawing from previous research on the index-based flood vulnerability assessment of heritage buildings (D’Ayala et al., 2020; Davis et al., 2023; Gandini et al., 2020; Martínez-Gomariz et al., 2020; Miranda and Ferreira, 2019; Stephenson and D’ayala, 2014), indicators associated with exposure, susceptibility, and resilience were carefully chosen, considering the unique attributes of earthquake-prone heritage buildings within the local context. Subsequently, weightings were assigned to these three components and their respective indicators.

The indicators for exposure and susceptibility were assessed in four distinct classes based on different allocated weightings (Stephenson and D’ayala, 2014): A (10); B (40); C (70); and D (100). Table 1 shows the indicators, along with their attributes, classes, and weightings. Accordingly, higher exposure and susceptibility classes would signify greater vulnerability of buildings to specific aspects or features. However, the resilience indicators were categorised as: A weighted as 0; B weighted as 40; C weighted as 70; and D weighted as 100. Given the negative correlation between vulnerability and resilience as indicated in Equation 1, higher resilience class values correspond to a reduction in a building’s vulnerability (Nguyen and Van Nguyen, 2019). The minimum value of 0 indicates that in the absence of resilient factors, the degree of vulnerability to flooding remains unchanged. It is worth emphasising that the definitions of the exposure, susceptibility, and resilience components in this study are consistent with analogous indicators previously documented in the existing literature (see Table 1).

3.1.1 Exposure indicators

The exposure indicators included in this study are heritage status, type of building use, and surface condition, which assist in determining the potential of harm or loss to the economy, the physical, and the culture. It is important to note that floods not only destroy property physically but also halt financial pursuits and may jeopardise the characteristics that support their cultural significance (Davis et al., 2023).

Through E1-Heritage value, the cultural value of the structure is considered. This indicator aims to take into account the building’s cultural value and, consequently, the possible cultural impact brought on by its damage (Miranda and Ferreira, 2019). The classification of E1-Heritage Value refers to the categories of heritage buildings on the website of Heritage New Zealand Pouhere Taonga (Heritage New Zealand Pouhere Taonga, 2023).

The E2-Type of use explains the possible financial damages from the flood that properties may experience, pertaining to the usage of the heritage buildings. The nature of usage within these buildings significantly influences their vulnerability to flood-related damage.

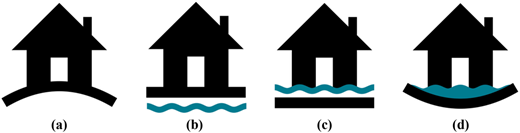
The E3-Surface condition (see Figure 1) evaluates the characteristics of the building’s immediate surroundings, particularly the ground’s inclination—whether it is concave, convex, or flat around the building—and its permeability (Davis et al., 2023). Building exposure will be reduced by a concave ground because the flow will typically drain from the structure. However, the concave earth will hold onto the flow near the building, raising its exposure. This aspect can be viewed as neutral on flat ground. Furthermore, the term “permeability of the ground” relates to whether there are drainage systems close to the structure (D’Ayala et al., 2020).

3.1.2 Susceptibility indicators

The susceptibility indicators are adopted for this study to assess a building’s vulnerability to flood damage. These indicators include material, condition, number of storeys, age, wall orientation, and the finishing material of façades.

  • S1-Material assesses a material’s susceptibility to damage and degradation brought on by water as a result of its porosity and surface features (Davis et al., 2023). This concept is derived from Schwarz and Maiwald (2009), where they identified 7 main structural types with varying responses to flooding events. In this context, four key material/structural typologies were taken into consideration based on the most prevalent construction types in New Zealand.

  • S2-Condition is determined by the structure’s condition evaluation. The structures’ poor state decreases their ability to withstand flooding volumes and raises the probability of a water intrusion, both of which might result in physical damage (Stephenson and D’ayala, 2014).

  • S3-Number of storeys is based on the concept of Stephenson and D’ayala (2014) asserting that a building’s susceptibility to flooding increases with the number of storeys. They claim that structures with more floors over a given footprint will be more vulnerable to stress variations caused by the foundation soil soaking and drying after and during flooding, especially if they have superficial foundations.

  • S4-Building age indicates that the likelihood of a building sustaining flood damage increases with age. It classifies earthquake-prone heritage buildings into four different historical eras. These classes are organised from the newest to the oldest structures, presuming the hypothesis that the building’s susceptibility to sustain flood damage increases with its age and its appeal from a historical conservation standpoint.

  • S5-Wall orientation aims to integrate the diverse aspects that ought to be considered for the assessment, including the building’s location, how its principal façade wall is oriented, and the presence of openings. Buildings situated in low-lying regions are possibly more vulnerable to flooding from floods. If a building is situated in a low-lying location, as is typical in cities close to riverbanks, its category will be raised to Class C or Class D, depending on whether it is a fully exposed building or not (regardless of the openings) (Miranda and Ferreira, 2019).

  • S6-Finishing Material of the Facades assesses the building’s primary cladding, which serves as the first water barrier (Davis et al., 2023). Regarding water exposure, different materials will behave differently in the short term. Higher permeability and materials that are more susceptible to deterioration are associated with higher susceptibility (Gandini et al., 2020).

3.1.3 Resilience indicators

The resilience indicators included drainage system conditions of the building and previous interventions.

R1-Drainage system condition measures the building’s ability to remove rainwater. R2-Existing flood-proofing is the intervention of the buildings, which is used to assess the owners’ ability to offer additional interventions. Owners who have completed restoration initiatives are typically more conscientious about maintenance tasks (Gandini et al., 2020).

From the Heritage New Zealand Pouhere Taonga website, which maintains a list of heritage buildings in the country (Heritage New Zealand Pouhere Taonga, 2023), a list of 566 heritage buildings in Auckland was obtained. Next, the characteristics of these buildings were ascertained on the EPB Register website (i.e. source of information about earthquake-prone buildings listed by territorial authorities in New Zealand) to verify their level of earthquake-proneness (Heritage New Zealand Pouhere Taonga, 2023). Consequently, a list of 64 earthquake-susceptible heritage buildings was compiled, which included pertinent details such as their address, heritage list type, and additional information (such as usage, suburb, etc). Notably, this indicates that more than one-tenth of heritage buildings in Auckland are currently grappling with seismic retrofitting concerns.

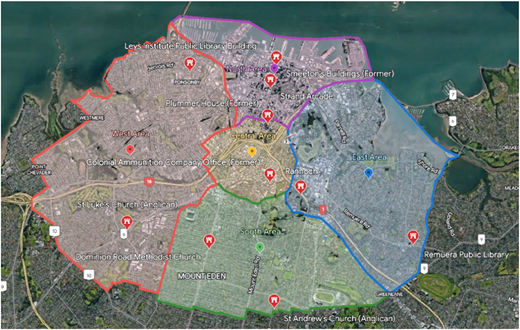
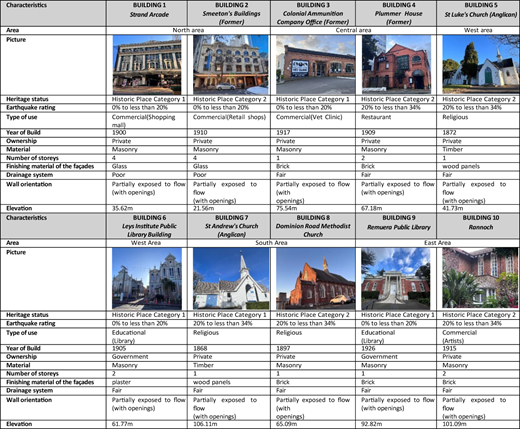
To visualise the geographical distribution of these 64 buildings, their locations were mapped out using the Google Earth application. A significant concentration of these buildings, 50 in total, was apparent within a demarcated area. This concentrated region was subsequently divided into five distinct areas of Auckland: the Central Area, North Area, East Area, West Area, and South Area, as delineated in Figure 2. Accordingly, 10 buildings were quasi-randomly selected for further analysis. Two buildings were selected from each of the five delineated areas, ensuring that one building belonged to the Category 1 heritage list type and the other to the Category 2 heritage list type. These selected buildings were highlighted in red on the map, as presented in Figure 2, and a comprehensive list of the 10 selected buildings is outlined in Table 2.

A score sheet was created for the 10 selected buildings to analyse their FVI. The score sheets were completed based on the characteristics of the 10 selected buildings shown in Table 2 (i.e. document analysis and physical observation of the buildings from site visits).

Once the class and weightings of various indicators have been established, as detailed in Table 1, the values of the three components (Exposure, Susceptibility, and Resilience) will fall within the respective ranges of [30, 300], [60, 600], and [0, 200]. Subsequently, the FVI for each building will be calculated using the following Eq. (2), which builds upon Eq. (1).

(2)

Where:

  1. FVIi is the FVI of i building (i=1,2,,10),

  2. Ei is the exposure of i building, Si is the susceptibility of i building, and

  3. Ri is the resilience of i building.

The FVIi of each building will be calculated and transformed into a normal scale ranging 0 to 1 using maximum-minimum normalisation in Eq. 3 (Krajnc and Glavič, 2005) prior to being manually categorised into 5 classes (Samanta et al., 2016). The FVI of the building is then classified according to the normalised scale they fall within: “very low” (0–2); “low” (0.20–0.40); “medium” (0.40–0.60); “high” (0.60–0.80); and “very high” (0.80–1.0), as shown in Table 3.

(3)

Where:

  1. =1,2,,10 ,

  2. Xi is the normalised FVI value for i building;

  3. Xi is the FVI value for i building before normalisation;

  4. Xmax refers to the FVI highest value when comparing different buildings;

  5. Xmin is the FVI minimum value when comparing different buildings.

The flood vulnerability of the ten selected buildings, as presented in Table 2, was assessed, and the results are shown in Table 4. Using Equation 2, the normalised FVI values of the 10 buildings were calculated, and their FVI levels were identified (see Table 4).

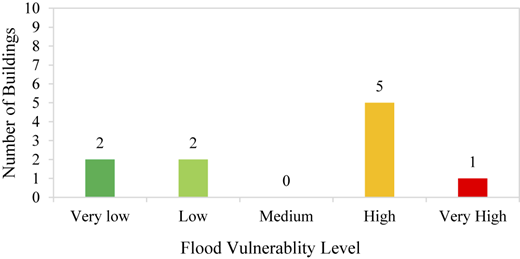
The distribution of selected buildings in different flood vulnerability levels suggests that more than half of the earthquake-prone heritage buildings under examination exhibit significantly higher vulnerability to flooding than others (see Figure 3). This implies that there are significant differences in flood vulnerability among earthquake-prone heritage buildings in Auckland. Consequently, there is a pressing need for the establishment of a hierarchy or prioritisation system for earthquake-prone heritage buildings based on their flood vulnerability, which is essential for the judicious allocation of resources in preparation for potential flood events.

To facilitate this prioritisation, the flood vulnerability rankings of the 10 earthquake-prone heritage buildings were selected. The most vulnerable was Building 1; the second was Building 7; the third was Buildings 4, 5 and 8; the fourth was Building 2; the fifth was Building 3 and 10; and the least vulnerable was Buildings 6 and 9. Based on the findings, Building 1 was identified as the most vulnerable building. Despite its favourable preservation condition, masonry structure, and glass façade, its FVI is elevated due to a flat and impermeable surface, four storeys, inadequate drainage systems, and the absence of existing flood-proofing measures. The least vulnerable buildings are the Leys Institute Public Library Building and the Remuera Public Library. They were observed to have weaker façade finishing and preservation condition than Building 1, but lower risk usage, convex surface, fewer floors, better drainage systems, and existing flood-proofing.

In New Zealand, a significant proportion of heritage buildings, particularly churches, are predominantly single-storey structures. This demographic skews the influence of storey count on the FVI values. These one-storey buildings, representing nearly one-third of the sample, may dilute the perceived impact of having multiple storeys in the context of flood vulnerability. As such, the prominence of four-storey buildings within the dataset suggests that their flood risk is more pronounced, which highlights the variability inherent in using storey count as a metric for assessing flood vulnerability.

It is also crucial to recognise that the flood vulnerability levels presented are highly dependent on the normalisation method used. For example, the maximum-minimum normalisation approach, which situates the FVI values on a scale from 0 to 1 based on extremum values, introduced a comparative lens for evaluating flood risk among the selected buildings. In this case, Building 1 represented the maximum FVI, normalised to a value of 1, while Buildings 6 and 9, identified as the least vulnerable, were assigned a value of 0. This relative assessment is essential for understanding vulnerabilities in a more meaningful context, as it provides a clearer picture of how these buildings compare against one another within the sample set. Moreover, the implications of using different normalisation scales highlight the potential for varying interpretations of vulnerability levels. A choice of method can significantly impact strategic decision-making regarding flood preparedness and mitigation for the affected buildings. Thus, it remains essential for future studies to not only validate these contributing factors through broader data sets but also to explore alternative normalisation methods that might yield insights into the complexities of flood vulnerability in diverse building typologies.

This study aimed to assess the flood vulnerability of earthquake-prone heritage buildings by introducing an innovative index-based approach. The mixed-methods approach, incorporating document analysis, site visits, and the design of an index-based assessment technique, was employed for data collection and analysis.

Additionally, the proposed FVI-based methodology, rooted in the concepts of “exposure”, “susceptibility”, and “resilience” and incorporating 11 distinct indicators, effectively quantified the flood vulnerability of earthquake-prone heritage buildings, yielding a comprehensive flood vulnerability ranking. Significantly divergent flood vulnerability levels were observed among these buildings, with more than half exhibiting notably higher vulnerability to flooding. The indicators that exerted the most influence on FVI included the type of use, surface condition, number of storeys, and finishing material of the façades.

As New Zealand is committed to achieving SDG 11 (United Nations, 2022a), as well as SDG 13 (United Nations, 2022b), the findings presented in this paper outline a practical methodology that can be applied in real-world settings. For example, the innovative index-based approach could serve as a platform for relevant decision-makers, including building professionals, policy regulators, and government officials, to effectively evaluate the FVI of selected earthquake-prone heritage buildings in New Zealand, thereby achieving logical results and making informed decisions. Moreover, the study’s methodology can be readily applied to other cities with similar contexts to Auckland, New Zealand. This flexibility highlights how this approach can be applied in various urban areas facing similar challenges relating to the vulnerability of earthquake-prone heritage buildings to climate-induced flooding.

It is essential to acknowledge that the study contains an element of subjectivity, particularly concerning the selection of buildings and the weighting of indicators, as the researchers’ judgement influenced these decisions. While the research faced limitations due to sample size stemming from time constraints, it successfully achieved a balance between the necessary information, computational complexity, and result accuracy. Looking ahead, future research should focus on applying this index-based methodology to a broader array of heritage buildings and diverse urban contexts, particularly in areas prone to flooding, such as floodplains. Additionally, it could be beneficial to refine the parameters used for different locations and further analyse the relationships between FVI components of “exposure”, “susceptibility”, and “resilience”. Establishing clear criteria for site visits will also enhance the effectiveness of future studies. Overall, these steps will not only strengthen the methodology but also significantly contribute to the protection of earthquake-prone heritage buildings exposed to climate-induced flooding.

This paper is an extended version of our previous work, which was presented at the International Conference of Smart and Sustainable Built Environment (SASBE 2024), Auckland, New Zealand. The authors acknowledge the support and feedback from the chairs of the conference Prof Ali GhaffarianHoseini, Prof Amirhosein Ghaffarianhoseini and Prof Farzad Rahimian and their team throughout the previous peer review process of SASBE2024 and during the conference that helped improve our submissions.

Adger
,
W.N.
and
Agnew
,
M.
(
2004
),
New Indicators of Vulnerability and Adaptive Capacity
, Vol. 
122
,
Tyndall Centre for Climate Change
,
Research Norwich
.
Aigwi
,
I.E.
,
Phipps
,
R.
,
Ingham
,
J.
and
Filippova
,
O.
(
2019
),
Urban Transformation Trajectories of New Zealand’s Earliest Cities Undergoing Decline: Identifying Links to the Newly Enforced Building (Earthquake-Prone Buildings) Amendment Act 2016
,
43RD AUBEA
, Vol. 
591
.
Aigwi
,
I.E.
,
Filippova
,
O.
,
Ingham
,
J.
and
Phipps
,
R.
(
2020
), “
Unintended consequences of the earthquake-prone building legislation: an evaluation of two city centre regeneration strategies in New Zealand’s provincial areas
”,
International Journal of Disaster Risk Reduction
, Vol. 
49
, 101644, doi: .
Aigwi
,
I.E.
,
Filippova
,
O.
,
Ingham
,
J.
and
Phipps
,
R.
(
2021
), “
From drag to brag: the role of government grants in enhancing built heritage protection efforts in New Zealand’s provincial regions
”,
Journal of Rural Studies
, Vol. 
87
, pp. 
45
-
57
, doi: .
Aigwi
,
I.E.
,
Duberia
,
A.
and
Nwadike
,
A.N.
(
2023
), “
Adaptive reuse of existing buildings as a sustainable tool for climate change mitigation within the built environment
”,
Sustainable Energy Technologies and Assessments
, Vol. 
56
, 102945, doi: .
Arrighi
,
C.
(
2021
), “
A global scale analysis of river flood risk of UNESCO world heritage sites
”,
Frontiers in Water
, Vol. 
3
, 764459, doi: .
Auliagisni
,
W.
,
Wilkinson
,
S.
and
Elkharboutly
,
M.
(
2022
), “
Using community-based flood maps to explain flood hazards in Northland, New Zealand
”,
Progress in Disaster Science
, Vol. 
14
, 100229, doi: .
Bade
,
D.
(
2020
), “
Auckland’s heritage counts 2019 annual summary
”,
available at:
 https://www.knowledgeauckland.org.nz/media/1924/aucklands-heritage-counts-2020.pdf (
accessed
 1 April 2023).
Bade
,
D.
(
2021
), “
Auckland’s heritage counts 2021 annual summary
”,
available at:
 https://knowledgeauckland.org.nz/media/2223/aucklands-heritage-counts-2021.pdf (
accessed
 30 April 2023).
Balica
,
S.F.
,
Wright
,
N.G.
and
Van der Meulen
,
F.
(
2012
), “
A flood vulnerability index for coastal cities and its use in assessing climate change impacts
”,
Natural Hazards
, Vol. 
64
No. 
1
, pp. 
73
-
105
, doi: .
Besen
,
P.
,
Boarin
,
P.
and
Haarhoff
,
E.
(
2020
), “
Energy and seismic retrofit of historic buildings in New Zealand: reflections on current policies and practice
”,
The Historic Environment: Policy and Practice
, Vol. 
11
No. 
1
, pp. 
91
-
117
, doi: .
D’Ayala
,
D.
,
Wang
,
K.
,
Yan
,
Y.
,
Smith
,
H.
,
Massam
,
A.
,
Filipova
,
V.
and
Pereira
,
J.J.
(
2020
), “
Flood vulnerability and risk assessment of urban traditional buildings in a heritage district of Kuala Lumpur, Malaysia
”,
Natural Hazards and Earth System Sciences
, Vol. 
20
No. 
8
, pp. 
2221
-
2241
, doi: .
Das
,
S.
and
Scaringi
,
G.
(
2021
), “
River flooding in a changing climate: rainfall-discharge trends, controlling factors, and susceptibility mapping for the Mahi catchment, Western India
”,
Natural Hazards
, Vol. 
109
No. 
3
, pp. 
2439
-
2459
, doi: .
Dassanayake
,
D.R.
,
Burzel
,
A.
and
Oumeraci
,
H.
(
2015
), “
Methods for the evaluation of intangible flood losses and their integration in flood risk analysis
”,
Coastal Engineering Journal
, Vol. 
57
No. 
1
,
pp. 1540007-1540001, 1540007-1540035
, doi: .
Davis
,
L.
,
Larionova
,
T.
,
Patel
,
D.
,
Tse
,
D.
,
Baquedano Juliá
,
P.
,
Pinto Santos
,
P.
and
Ferreira
,
T.M.
(
2023
), “
Flood vulnerability and risk assessment of historic urban areas: vulnerability evaluation, derivation of depth-damage curves and cost–benefit analysis of flood adaptation measures applied to the historic city centre of Tomar, Portugal
”,
Journal of Flood Risk Management
, Vol. 
16
No. 
3
, e12908, doi: .
Dottori
,
F.
,
Figueiredo
,
R.
,
Martina
,
M.L.
,
Molinari
,
D.
and
Scorzini
,
A.R.
(
2016
), “
INSYDE: a synthetic, probabilistic flood damage model based on explicit cost analysis
”,
Natural Hazards and Earth System Sciences
, Vol. 
16
No. 
12
, pp. 
2577
-
2591
, doi: .
Douben
,
K.J.
(
2006
), “
Characteristics of river floods and flooding: a global overview, 1985-2003
”,
Irrigation and Drainage: The journal of the International Commission on Irrigation and Drainage
, Vol. 
55
No. 
S1
, pp. 
S9
-
S21
, doi: .
Drdácký
,
M.F.
(
2010
), “
Flood damage to historic buildings and structures
”,
Journal of Performance of Constructed Facilities
, Vol. 
24
No. 
5
, pp. 
439
-
445
, doi: .
Fernandez
,
P.
,
Mourato
,
S.
,
Moreira
,
M.
and
Pereira
,
L.
(
2016
), “
A new approach for computing a flood vulnerability index using cluster analysis
”,
Physics and Chemistry of the Earth, Parts A/B/C
, Vol. 
94
, pp. 
47
-
55
, doi: .
Figueiredo
,
R.
,
Romão
,
X.
and
Paupério
,
E.
(
2020
), “
Flood risk assessment of cultural heritage at large spatial scales: framework and application to mainland Portugal
”,
Journal of Cultural Heritage
, Vol. 
43
, pp. 
163
-
174
, doi: .
Filippova
,
O.
and
Noy
,
I.
(
2020
), “
Earthquake-strengthening policy for commercial buildings in small-town New Zealand
”,
Disasters
, Vol. 
44
No. 
1
, pp. 
179
-
204
, doi: .
Galasso
,
C.
,
Pregnolato
,
M.
and
Parisi
,
F.
(
2021
), “
A model taxonomy for flood fragility and vulnerability assessment of buildings
”,
International Journal of Disaster Risk Reduction
, Vol. 
53
, 101985, doi: .
Gandini
,
A.
,
Egusquiza
,
A.
,
Garmendia
,
L.
and
San-José
,
J.-T.
(
2018
), “
Vulnerability assessment of cultural heritage sites towards flooding events
”,
IOP Conference Series: Materials Science and Engineering
, Vol. 
364
, p.
012028
, doi: .
Gandini
,
A.
,
Garmendia
,
L.
,
Prieto
,
I.
,
Álvarez
,
I.
and
San-José
,
J.-T.
(
2020
), “
A holistic and multi-stakeholder methodology for vulnerability assessment of cities to flooding and extreme precipitation events
”,
Sustainable Cities and Society
, Vol. 
63
, 102437, doi: .
Garrote
,
J.
,
Díez-Herrero
,
A.
,
Escudero
,
C.
and
García
,
I.
(
2020
), “
A framework proposal for regional-scale flood-risk assessment of cultural heritage sites and application to the Castile and León Region (Central Spain)
”,
Water
, Vol. 
12
No. 
2
, p.
329
, doi: .
Greater Wellington
(
2003
), “
Flooding hazard – Wairarapa
”,
available at:
 https://archive.gw.govt.nz/assets/council-publications/Environment%20Management_20030606_100838.pdf (
accessed
 29 March 2023).
Haugen
,
A.
and
Mattsson
,
J.
(
2011
), “
Preparations for climate change’s influences on cultural heritage
”,
International Journal of Climate Change Strategies and Management
, Vol. 
3
No. 
4
, pp. 
386
-
401
, doi: .
Heritage New Zealand Pouhere Taonga
(
2023
), “
New Zealand heritage list
”,
available at:
 https://www.heritage.org.nz/places (
accessed
 23 May 2023).
Hoang
,
T.
,
Noy
,
I.
,
Filippova
,
O.
and
Elwood
,
K.
(
2021
), “
Prioritising earthquake retrofitting in Wellington, New Zealand
”,
Disasters
, Vol. 
45
No. 
4
, pp. 
968
-
995
, doi: .
Huang
,
D.
,
Zhang
,
R.
,
Huo
,
Z.
,
Mao
,
F.
,
E
,
Y.
and
Zheng
,
W.
(
2012
), “
An assessment of multidimensional flood vulnerability at the provincial scale in China based on the DEA method
”,
Natural Hazards
, Vol. 
64
No. 
2
, pp. 
1575
-
1586
, doi: .
Ishtiaque
,
A.
,
Estoque
,
R.C.
,
Eakin
,
H.
,
Parajuli
,
J.
and
Rabby
,
Y.W.
(
2022
), “
IPCC’s current conceptualization of ‘vulnerability’ needs more clarification for climate change vulnerability assessments
”,
Journal of Environmental Management
, Vol. 
303
, 114246, doi: .
Islam
,
A.R.M.T.
,
Talukdar
,
S.
,
Mahato
,
S.
,
Kundu
,
S.
,
Eibek
,
K.U.
,
Pham
,
Q.B.
,
Kuriqi
,
A.
and
Linh
,
N.T.T.
(
2021
), “
Flood susceptibility modelling using advanced ensemble machine learning models
”,
Geoscience Frontiers
, Vol. 
12
No. 
3
, 101075, doi: .
Kamal
,
M.A.
and
Brar
,
T.S.
(
2021
), “
Analysis of seismic retrofitting in heritage buildings: techniques and conservation interventions
”,
Architecture Engineering and Science
, Vol. 
2
No. 
3
, pp.
73
-
83
.
Kaspersen
,
P.S.
and
Halsnæs
,
K.
(
2017
), “
Integrated climate change risk assessment: a practical application for urban flooding during extreme precipitation
”,
Climate services
, Vol. 
6
, pp. 
55
-
64
, doi: .
Khan
,
S.
(
2012
), “
Vulnerability assessments and their planning implications: a case study of the Hutt Valley, New Zealand
”,
Natural Hazards
, Vol. 
64
, pp.
1587
-
1607
.
Krajnc
,
D.
and
Glavič
,
P.
(
2005
), “
How to compare companies on relevant dimensions of sustainability
”,
Ecological Economics
, Vol. 
55
No. 
4
, pp. 
551
-
563
, doi: .
Martínez-Gomariz
,
E.
,
Forero-Ortiz
,
E.
,
Guerrero-Hidalga
,
M.
,
Castán
,
S.
and
Gómez
,
M.
(
2020
), “
Flood depth‒damage curves for Spanish Urban areas
”,
Sustainability
, Vol. 
12
No. 
7
, p.
2666
, doi: .
Mazurczyk
,
T.
,
Piekielek
,
N.
,
Tansey
,
E.
and
Goldman
,
B.
(
2018
), “
American archives and climate change: risks and adaptation
”,
Climate risk management
, Vol. 
20
, pp. 
111
-
125
, doi: .
MBIE
(
2016
), “
Building (Earthquake-prone buildings) amendment act 2016
”,
available at:
 https://www.legislation.govt.nz/act/public/2016/0022/latest/DLM5616102.html (
accessed
 28 March 2023).
MBIE
(
2017
), “
The methodology to identify earthquake-prone buildings
”,
available at:
 https://www.building.govt.nz/building-code-compliance/b-stability/b1-structure/methodology-identify-earthquake-prone-buildings/ (
accessed
 28 March 2023).
MBIE
(
2023
), “
Register of earthquake-prone buildings (EPB Register)
”,
available at:
 https://epbr.building.govt.nz/ (
acceseed
 23 May 2023).
McCaull
,
A.
(
2022
), “
Concern over safety, cost of fixing earthquake-prone marae buildings
”,
available at:
 https://www.rnz.co.nz/news/te-manu-korihi/476807/concern-over-safety-cost-of-fixing-earthquake-prone-marae-buildings (
accessed
 29 March 2023).
Ministry for the Environment
(
2022
), “
Chapter 7 Homes, buildings and places of Aotearoa New Zealand’s first national adaptation plan
”,
available at:
 https://environment.govt.nz/publications/aotearoa-new-zealands-first-national-adaptation-plan/homes-buildings-and-places/ (
accessed
 29 March 2023).
Miranda
,
F.N.
and
Ferreira
,
T.M.
(
2019
), “
A simplified approach for flood vulnerability assessment of historic sites
”,
Natural Hazards
, Vol. 
96
No. 
2
, pp. 
713
-
730
, doi: .
Murphy
,
C.
(
2020
), “
New Zealand’s unreinforced Masonry Buildings: facing up to the earthquake
”,
IOP Conference Series: Earth and Environmental Science
, Vol. 
410
No. 
1
, 012106, doi: .
Nasiri
,
H.
,
Mohd Yusof
,
M.J.
and
Mohammad Ali
,
T.A.
(
2016
), “
An overview to flood vulnerability assessment methods
”,
Sustainable Water Resources Management
, Vol. 
2
No. 
3
, pp. 
331
-
336
, doi: .
Nguyen
,
C.T.
and
Van Nguyen
,
B.
(
2019
), “
Application of flood vulnerability index in flood vulnerability assessment: a case study in Mai Hoa Commune, Tuyen Hoa district, Quang Binh province
”,
Sustainable Water Resources Management
, Vol. 
5
No. 
4
, pp. 
1917
-
1927
, doi: .
Nguyen
,
T.L.
,
Asahi
,
C.
,
Tran
,
T.A.
and
Le
,
N.H.
(
2022
), “
Indicator-based approach for flood vulnerability assessment in ancient heritage city of Hoi An, Central Region of Vietnam
”,
Natural Hazards
, Vol. 
114
No. 
2
, pp. 
2357
-
2385
, doi: .
Pachauri
,
R.K.
and
Meyer
,
L.A.
(
2015
),
Climate Change 2014 : Synthesis Report. Contribution of Working Groups I, II and III to the Fifth Assessment Report of the Intergovernmental Panel on Climate Change
,
Intergovernmental Panel on Climate Change
,
Geneva
.
Parker
,
L.
,
Bourgoin
,
C.
,
Martinez-Valle
,
A.
and
Läderach
,
P.
(
2019
), “
Vulnerability of the agricultural sector to climate change: the development of a pan-tropical Climate Risk Vulnerability Assessment to inform sub-national decision making
”,
PLoS One
, Vol. 
14
No. 
3
, e0213641, doi: .
Paulik
,
R.
,
Crowley
,
K.
and
Williams
,
S.
(
2021
), “
Post-event flood damage surveys: a New Zealand experience and implications for flood risk analysis
”,
FLOODrisk 2020-4th European Conference on Flood Risk Management
.
Phillipson
,
M.C.
,
Emmanuel
,
R.
and
Baker
,
P.H.
(
2016
), “
The durability of building materials under a changing climate
”,
WIREs Climate Change
, Vol. 
7
No. 
4
, pp. 
590
-
599
, doi: .
Porębska
,
A.
,
Godyń
,
I.
,
Radzicki
,
K.
,
Nachlik
,
E.
and
Rizzi
,
P.
(
2019
), “
Built heritage, sustainable development, and natural hazards: flood protection and UNESCO world heritage site protection strategies in Krakow, Poland
”,
Sustainability
, Vol. 
11
No. 
18
, p.
4886
, doi: .
Schwarz
,
J.
and
Maiwald
,
H.
(
2009
), “
Damage and loss prediction model based on the vulnerability of building types
”,
RIMAX Contributions at the 4th International Symposium on Flood Defence (ISFD4)
.
Samanta
,
S.
,
Koloa
,
C.
,
Kumar Pal
,
D.
and
Palsamanta
,
B.
(
2016
), “
Flood risk analysis in lower part of Markham river based on multi-criteria decision approach (MCDA)
”,
Hydrology
, Vol. 
3
No. 
3
, p.
29
, doi: .
Sesana
,
E.
,
Gagnon
,
A.
,
Bertolin
,
C.
and
Hughes
,
J.
(
2018
), “
Adapting cultural heritage to climate change risks: perspectives of cultural heritage experts in Europe
”,
Geosciences
, Vol. 
8
No. 
8
, p.
305
, doi: .
Sesana
,
E.
,
Gagnon
,
A.S.
,
Ciantelli
,
C.
,
Cassar
,
J.
and
Hughes
,
J.J.
(
2021
), “
Climate change impacts on cultural heritage: a literature review
”,
Wiley Interdisciplinary Reviews: Climate Change
, Vol. 
12
No. 
4
, e710, doi: .
Smit
,
B.
and
Wandel
,
J.
(
2006
), “
Adaptation, adaptive capacity and vulnerability
”,
Global Environmental Change
, Vol. 
16
No. 
3
, pp. 
282
-
292
, doi: .
Stephenson
,
V.
and
D’ayala
,
D.
(
2014
), “
A new approach to flood vulnerability assessment for historic buildings in England
”,
Natural Hazards and Earth System Sciences
, Vol. 
14
No. 
5
, pp. 
1035
-
1048
, doi: .
Tong
,
Q.
,
Filippova
,
O.
and
Ingham
,
J.
(
2022
), “
Effectiveness of unreinforced masonry seismic retrofit programmes: review of policies in New Zealand and the United States
”,
International Journal of Disaster Risk Reduction
, Vol. 
76
, 103008, doi: .
Trizio
,
F.
,
Garzón-Roca
,
J.
,
Eguibar
,
M.Á.
,
Bracchi
,
P.
and
Torrijo
,
F.J.
(
2022
), “
Above the ravines: flood vulnerability assessment of earthen architectural heritage in Quito (Ecuador)
”,
Applied Sciences
, Vol. 
12
No. 
23
, 11932, doi: .
Turner
,
B.L.
,
Kasperson
,
R.E.
,
Matson
,
P.A.
,
McCarthy
,
J.J.
,
Corell
,
R.W.
,
Christensen
,
L.
,
Eckley
,
N.
,
Kasperson
,
J.X.
,
Luers
,
A.
,
Martello
,
M.L.
,
Polsky
,
C.
,
Pulsipher
,
A.
and
Schiller
,
A.
(
2003
), “
A framework for vulnerability analysis in sustainability science
”,
Proceedings of the National Academy of Sciences
, Vol. 
100
No. 
14
, pp. 
8074
-
8079
, doi: .
UNESCO-IHE
(
2023
), “
Flood vulnerability indices (FVI)
”,
available at:
 http://www.unesco-ihe-fvi.org/ (
accessed
 23 May 2023).
United Nations
(
2022a
), “
The sustainable development goal 11
”,
available at:
 https://sdgs.un.org/goals/goal11 (
accessed
 28 March 2023).
United Nations
(
2022b
), “
The sustainable development goal 13
”,
available at:
 https://sdgs.un.org/goals/goal13 (
accessed
 28 March 2023).
Watson
,
R.T.
and
Albritton
,
D.L.
(
2001
),
Climate Change 2001: Synthesis Report: Third Assessment Report of the Intergovernmental Panel on Climate Change
,
Cambridge University Press
,
Cambridge
.
Wellington City Council
(
2023a
), “
How will climate change impact Wellington?
”,
available at:
 https://wellington.govt.nz/climate-change-sustainability-environment/climate-change/climate-change-in-wellington/how-will-climate-change-impact-wellington (
accessed
 1 April 2023).
Wellington City Council
(
2023b
), “
Seismic strengthening for heritage buildings
”,
available at:
 https://wellington.govt.nz/arts-and-culture/heritage/seismic-strengthening (
accessed
 1 April 2023).
Yoo
,
G.
,
Hwang
,
J.H.
and
Choi
,
C.
(
2011
), “
Development and application of a methodology for vulnerability assessment of climate change in coastal cities
”,
Ocean and Coastal Management
, Vol. 
54
No. 
7
, pp. 
524
-
534
, doi: .
Published by Emerald Publishing Limited. This article is published under the Creative Commons Attribution (CC BY 4.0) licence. Anyone may reproduce, distribute, translate and create derivative works of this article (for both commercial and non-commercial purposes), subject to full attribution to the original publication and authors. The full terms of this licence may be seen at http://creativecommons.org/licences/by/4.0/legalcode

Data & Figures

Figure 1
A figure shows four house icons depicting different exposure classes of E 3-Surface condition.(a) A house with a concave-down base. (b) A house with a flat base and a wavy line beneath it. (c) A house with a wavy line beneath it, with a flat base below the line. (d) A house with a wavy line beneath it, with a concave-up base below the line.

Exposure classes of E3-surface condition: (a) convex; (b) flat and permeable; (c) flat and impermeable; and (d) concave. Source: Davis et al. (2023) 

Close modal
Figure 2
A map shows selected buildings in different areas, including West, South, Central, North, and East areas.The map is divided into five regions: West Area (red border) includes buildings like Saint Luke’s Church (Anglican) and Leys institute Public Library Building. South Area (green border) includes buildings like Saint Andrew’s Church (Anglican) and Dominion Road Methodist Church. Central Area (purple border) includes Colonial Ammunition Company Office (Former) and Plummer House (Former). East Area (blue border) includes buildings like Remuera Public Library and Rannoch. North Area (pink border) includes buildings like Strand Arcade and Smeeton’s Buildings (Former). Various roads and other geographical features are visible on the map.

Selected buildings. Source: Authors’ own work

Close modal
Figure 3
A vertical bar graph plots number of buildings versus flood vulnerability ranging from very low to very high.The horizontal axis is labeled “Flood Vulnerability Level” and has five markings labeled “Very low”, “Low”, “Medium”, “High”, and “Very High”. The vertical axis is labeled “Number of Buildings” and has markings ranging from 0 to 10 in increments of 1 unit. The data from the bars on the graph are as follows: Very low: 2. Low: 2. Medium: 0. High: 5. Very High: 1.

Flood vulnerability levels distribution of selected buildings. Source: Authors’ own work

Close modal
Table 1

Flood vulnerability components: Indicators, classes, and weightings

ComponentsIndicatorsAttributesData collectionClassWeightings
ExposureE1-Heritage Value (Davis et al., 2023; Miranda and Ferreira, 2019)General heritage buildingDocument analysis from Heritage New Zealand Pouhere Taonga website (Heritage New Zealand Pouhere Taonga, 2023)A10
Significant heritage buildingB40
Outstanding heritage buildingC70
National heritage landmarkD100
 E2-Type of use (Martínez-Gomariz et al., 2020)Educational/dwelling- Heritage New Zealand
Pouhere Taonga website (Heritage New Zealand Pouhere Taonga, 2023),
- Site visits
A10
CommercialB40
RestaurantC70
Hotel/ReligiousD100
 E3-Surface condition (Davis et al., 2023; D’Ayala et al., 2020)ConvexSite visits, maps from Google Map and Google Earth, survey documentsA10
Flat and permeableB40
Flat and impermeableC70
ConcaveD100
SusceptibilityS1-Material (Davis et al., 2023; Schwarz and Maiwald, 2009; Miranda and Ferreira, 2019)Reinforced concrete/SteelSite visits, government statistics, literatureA10
Unreinforced MasonryB40
TimberC70
 Earth D100
 S2-Condition (Stephenson and D’ayala, 2014)No damage/cracking/dampness/decaySite visits, survey documentsA10
Slight damage/cracking/dampness/decayB40
Generalised damage/cracking/dampness/decayC70
Significant damage/cracking/dampness/decayD100
 S3-Number of storeys (Stephenson and D’ayala, 2014)1-storeySite visits, Google mapsA10
2-storeyB40
3-storeyC70
4-storey or moreD100
 S4-Building age (Miranda and Ferreira, 2019)Between 20th to 21st centuryGovernment statistics, literature, and information from EPB Register (MBIE, 2023)A10
Between 19th to 20th centuryB40
Between 18th to 19th centuryC70
Before 18th centuryD100
 S5-Wall orientation (Miranda and Ferreira, 2019)Partially exposed to flow (with no openings)Site visits, maps from Google Earth and Google Maps, survey documentsA10
Partially exposed to flow (with openings)B40
Fully exposed to flow (with no openings)C70
Fully exposed to flow (with openings)D100
 S6-Finishing material of the façades (Davis et al., 2023; Gandini et al., 2020)Steel/concrete/glazed tile/glassSite visits, surveys, and documentsA10
Brick/plaster/regular dressed stoneB40
Unglazed tile/irregular stone/wood panelsC70
Earth/rubble stoneD100
ResilienceR1-Drainage system condition (Gandini et al., 2020)NoneSite visits, literatureA0
PoorB40
FairC70
GoodD100
R2-Previous interventions (Gandini et al., 2020)NoneHeritage New Zealand Pouhere Taonga website (Heritage New Zealand Pouhere Taonga, 2023), literature, site visits, and Government statisticsA0
PoorB40
FairC70
GoodD100
Source(s): Authors’ own work
Table 2

Characteristics of selected buildings

A table depicts the area-wise characteristics of 10 buildings.
Table 3

FVI Classification based on Normalised Scale

Flood vulnerability levelVery lowLowMediumHighVery high
FVI0∼0.20.2∼0.40.4∼0.60.6∼0.80.8∼1.0
Source(s): Authors’ own work
Table 4

Scores of vulnerability components and FVI levels of selected buildings

Building no.12345678910
Scores of vulnerability components
Exposure1801501201801509018015090120
Susceptibility210210180180210180240210180180
Resilience40807070701101107011070
FVI of selected buildings
FVI350280230290290160310290160230
Normalised FVI1.000.630.370.680.680.000.790.680.000.37
FVI LevelVery highHighLowHighHighVery lowHighHighVery lowLow
Source(s): Authors’ own work

Supplements

References

Adger
,
W.N.
and
Agnew
,
M.
(
2004
),
New Indicators of Vulnerability and Adaptive Capacity
, Vol. 
122
,
Tyndall Centre for Climate Change
,
Research Norwich
.
Aigwi
,
I.E.
,
Phipps
,
R.
,
Ingham
,
J.
and
Filippova
,
O.
(
2019
),
Urban Transformation Trajectories of New Zealand’s Earliest Cities Undergoing Decline: Identifying Links to the Newly Enforced Building (Earthquake-Prone Buildings) Amendment Act 2016
,
43RD AUBEA
, Vol. 
591
.
Aigwi
,
I.E.
,
Filippova
,
O.
,
Ingham
,
J.
and
Phipps
,
R.
(
2020
), “
Unintended consequences of the earthquake-prone building legislation: an evaluation of two city centre regeneration strategies in New Zealand’s provincial areas
”,
International Journal of Disaster Risk Reduction
, Vol. 
49
, 101644, doi: .
Aigwi
,
I.E.
,
Filippova
,
O.
,
Ingham
,
J.
and
Phipps
,
R.
(
2021
), “
From drag to brag: the role of government grants in enhancing built heritage protection efforts in New Zealand’s provincial regions
”,
Journal of Rural Studies
, Vol. 
87
, pp. 
45
-
57
, doi: .
Aigwi
,
I.E.
,
Duberia
,
A.
and
Nwadike
,
A.N.
(
2023
), “
Adaptive reuse of existing buildings as a sustainable tool for climate change mitigation within the built environment
”,
Sustainable Energy Technologies and Assessments
, Vol. 
56
, 102945, doi: .
Arrighi
,
C.
(
2021
), “
A global scale analysis of river flood risk of UNESCO world heritage sites
”,
Frontiers in Water
, Vol. 
3
, 764459, doi: .
Auliagisni
,
W.
,
Wilkinson
,
S.
and
Elkharboutly
,
M.
(
2022
), “
Using community-based flood maps to explain flood hazards in Northland, New Zealand
”,
Progress in Disaster Science
, Vol. 
14
, 100229, doi: .
Bade
,
D.
(
2020
), “
Auckland’s heritage counts 2019 annual summary
”,
available at:
 https://www.knowledgeauckland.org.nz/media/1924/aucklands-heritage-counts-2020.pdf (
accessed
 1 April 2023).
Bade
,
D.
(
2021
), “
Auckland’s heritage counts 2021 annual summary
”,
available at:
 https://knowledgeauckland.org.nz/media/2223/aucklands-heritage-counts-2021.pdf (
accessed
 30 April 2023).
Balica
,
S.F.
,
Wright
,
N.G.
and
Van der Meulen
,
F.
(
2012
), “
A flood vulnerability index for coastal cities and its use in assessing climate change impacts
”,
Natural Hazards
, Vol. 
64
No. 
1
, pp. 
73
-
105
, doi: .
Besen
,
P.
,
Boarin
,
P.
and
Haarhoff
,
E.
(
2020
), “
Energy and seismic retrofit of historic buildings in New Zealand: reflections on current policies and practice
”,
The Historic Environment: Policy and Practice
, Vol. 
11
No. 
1
, pp. 
91
-
117
, doi: .
D’Ayala
,
D.
,
Wang
,
K.
,
Yan
,
Y.
,
Smith
,
H.
,
Massam
,
A.
,
Filipova
,
V.
and
Pereira
,
J.J.
(
2020
), “
Flood vulnerability and risk assessment of urban traditional buildings in a heritage district of Kuala Lumpur, Malaysia
”,
Natural Hazards and Earth System Sciences
, Vol. 
20
No. 
8
, pp. 
2221
-
2241
, doi: .
Das
,
S.
and
Scaringi
,
G.
(
2021
), “
River flooding in a changing climate: rainfall-discharge trends, controlling factors, and susceptibility mapping for the Mahi catchment, Western India
”,
Natural Hazards
, Vol. 
109
No. 
3
, pp. 
2439
-
2459
, doi: .
Dassanayake
,
D.R.
,
Burzel
,
A.
and
Oumeraci
,
H.
(
2015
), “
Methods for the evaluation of intangible flood losses and their integration in flood risk analysis
”,
Coastal Engineering Journal
, Vol. 
57
No. 
1
,
pp. 1540007-1540001, 1540007-1540035
, doi: .
Davis
,
L.
,
Larionova
,
T.
,
Patel
,
D.
,
Tse
,
D.
,
Baquedano Juliá
,
P.
,
Pinto Santos
,
P.
and
Ferreira
,
T.M.
(
2023
), “
Flood vulnerability and risk assessment of historic urban areas: vulnerability evaluation, derivation of depth-damage curves and cost–benefit analysis of flood adaptation measures applied to the historic city centre of Tomar, Portugal
”,
Journal of Flood Risk Management
, Vol. 
16
No. 
3
, e12908, doi: .
Dottori
,
F.
,
Figueiredo
,
R.
,
Martina
,
M.L.
,
Molinari
,
D.
and
Scorzini
,
A.R.
(
2016
), “
INSYDE: a synthetic, probabilistic flood damage model based on explicit cost analysis
”,
Natural Hazards and Earth System Sciences
, Vol. 
16
No. 
12
, pp. 
2577
-
2591
, doi: .
Douben
,
K.J.
(
2006
), “
Characteristics of river floods and flooding: a global overview, 1985-2003
”,
Irrigation and Drainage: The journal of the International Commission on Irrigation and Drainage
, Vol. 
55
No. 
S1
, pp. 
S9
-
S21
, doi: .
Drdácký
,
M.F.
(
2010
), “
Flood damage to historic buildings and structures
”,
Journal of Performance of Constructed Facilities
, Vol. 
24
No. 
5
, pp. 
439
-
445
, doi: .
Fernandez
,
P.
,
Mourato
,
S.
,
Moreira
,
M.
and
Pereira
,
L.
(
2016
), “
A new approach for computing a flood vulnerability index using cluster analysis
”,
Physics and Chemistry of the Earth, Parts A/B/C
, Vol. 
94
, pp. 
47
-
55
, doi: .
Figueiredo
,
R.
,
Romão
,
X.
and
Paupério
,
E.
(
2020
), “
Flood risk assessment of cultural heritage at large spatial scales: framework and application to mainland Portugal
”,
Journal of Cultural Heritage
, Vol. 
43
, pp. 
163
-
174
, doi: .
Filippova
,
O.
and
Noy
,
I.
(
2020
), “
Earthquake-strengthening policy for commercial buildings in small-town New Zealand
”,
Disasters
, Vol. 
44
No. 
1
, pp. 
179
-
204
, doi: .
Galasso
,
C.
,
Pregnolato
,
M.
and
Parisi
,
F.
(
2021
), “
A model taxonomy for flood fragility and vulnerability assessment of buildings
”,
International Journal of Disaster Risk Reduction
, Vol. 
53
, 101985, doi: .
Gandini
,
A.
,
Egusquiza
,
A.
,
Garmendia
,
L.
and
San-José
,
J.-T.
(
2018
), “
Vulnerability assessment of cultural heritage sites towards flooding events
”,
IOP Conference Series: Materials Science and Engineering
, Vol. 
364
, p.
012028
, doi: .
Gandini
,
A.
,
Garmendia
,
L.
,
Prieto
,
I.
,
Álvarez
,
I.
and
San-José
,
J.-T.
(
2020
), “
A holistic and multi-stakeholder methodology for vulnerability assessment of cities to flooding and extreme precipitation events
”,
Sustainable Cities and Society
, Vol. 
63
, 102437, doi: .
Garrote
,
J.
,
Díez-Herrero
,
A.
,
Escudero
,
C.
and
García
,
I.
(
2020
), “
A framework proposal for regional-scale flood-risk assessment of cultural heritage sites and application to the Castile and León Region (Central Spain)
”,
Water
, Vol. 
12
No. 
2
, p.
329
, doi: .
Greater Wellington
(
2003
), “
Flooding hazard – Wairarapa
”,
available at:
 https://archive.gw.govt.nz/assets/council-publications/Environment%20Management_20030606_100838.pdf (
accessed
 29 March 2023).
Haugen
,
A.
and
Mattsson
,
J.
(
2011
), “
Preparations for climate change’s influences on cultural heritage
”,
International Journal of Climate Change Strategies and Management
, Vol. 
3
No. 
4
, pp. 
386
-
401
, doi: .
Heritage New Zealand Pouhere Taonga
(
2023
), “
New Zealand heritage list
”,
available at:
 https://www.heritage.org.nz/places (
accessed
 23 May 2023).
Hoang
,
T.
,
Noy
,
I.
,
Filippova
,
O.
and
Elwood
,
K.
(
2021
), “
Prioritising earthquake retrofitting in Wellington, New Zealand
”,
Disasters
, Vol. 
45
No. 
4
, pp. 
968
-
995
, doi: .
Huang
,
D.
,
Zhang
,
R.
,
Huo
,
Z.
,
Mao
,
F.
,
E
,
Y.
and
Zheng
,
W.
(
2012
), “
An assessment of multidimensional flood vulnerability at the provincial scale in China based on the DEA method
”,
Natural Hazards
, Vol. 
64
No. 
2
, pp. 
1575
-
1586
, doi: .
Ishtiaque
,
A.
,
Estoque
,
R.C.
,
Eakin
,
H.
,
Parajuli
,
J.
and
Rabby
,
Y.W.
(
2022
), “
IPCC’s current conceptualization of ‘vulnerability’ needs more clarification for climate change vulnerability assessments
”,
Journal of Environmental Management
, Vol. 
303
, 114246, doi: .
Islam
,
A.R.M.T.
,
Talukdar
,
S.
,
Mahato
,
S.
,
Kundu
,
S.
,
Eibek
,
K.U.
,
Pham
,
Q.B.
,
Kuriqi
,
A.
and
Linh
,
N.T.T.
(
2021
), “
Flood susceptibility modelling using advanced ensemble machine learning models
”,
Geoscience Frontiers
, Vol. 
12
No. 
3
, 101075, doi: .
Kamal
,
M.A.
and
Brar
,
T.S.
(
2021
), “
Analysis of seismic retrofitting in heritage buildings: techniques and conservation interventions
”,
Architecture Engineering and Science
, Vol. 
2
No. 
3
, pp.
73
-
83
.
Kaspersen
,
P.S.
and
Halsnæs
,
K.
(
2017
), “
Integrated climate change risk assessment: a practical application for urban flooding during extreme precipitation
”,
Climate services
, Vol. 
6
, pp. 
55
-
64
, doi: .
Khan
,
S.
(
2012
), “
Vulnerability assessments and their planning implications: a case study of the Hutt Valley, New Zealand
”,
Natural Hazards
, Vol. 
64
, pp.
1587
-
1607
.
Krajnc
,
D.
and
Glavič
,
P.
(
2005
), “
How to compare companies on relevant dimensions of sustainability
”,
Ecological Economics
, Vol. 
55
No. 
4
, pp. 
551
-
563
, doi: .
Martínez-Gomariz
,
E.
,
Forero-Ortiz
,
E.
,
Guerrero-Hidalga
,
M.
,
Castán
,
S.
and
Gómez
,
M.
(
2020
), “
Flood depth‒damage curves for Spanish Urban areas
”,
Sustainability
, Vol. 
12
No. 
7
, p.
2666
, doi: .
Mazurczyk
,
T.
,
Piekielek
,
N.
,
Tansey
,
E.
and
Goldman
,
B.
(
2018
), “
American archives and climate change: risks and adaptation
”,
Climate risk management
, Vol. 
20
, pp. 
111
-
125
, doi: .
MBIE
(
2016
), “
Building (Earthquake-prone buildings) amendment act 2016
”,
available at:
 https://www.legislation.govt.nz/act/public/2016/0022/latest/DLM5616102.html (
accessed
 28 March 2023).
MBIE
(
2017
), “
The methodology to identify earthquake-prone buildings
”,
available at:
 https://www.building.govt.nz/building-code-compliance/b-stability/b1-structure/methodology-identify-earthquake-prone-buildings/ (
accessed
 28 March 2023).
MBIE
(
2023
), “
Register of earthquake-prone buildings (EPB Register)
”,
available at:
 https://epbr.building.govt.nz/ (
acceseed
 23 May 2023).
McCaull
,
A.
(
2022
), “
Concern over safety, cost of fixing earthquake-prone marae buildings
”,
available at:
 https://www.rnz.co.nz/news/te-manu-korihi/476807/concern-over-safety-cost-of-fixing-earthquake-prone-marae-buildings (
accessed
 29 March 2023).
Ministry for the Environment
(
2022
), “
Chapter 7 Homes, buildings and places of Aotearoa New Zealand’s first national adaptation plan
”,
available at:
 https://environment.govt.nz/publications/aotearoa-new-zealands-first-national-adaptation-plan/homes-buildings-and-places/ (
accessed
 29 March 2023).
Miranda
,
F.N.
and
Ferreira
,
T.M.
(
2019
), “
A simplified approach for flood vulnerability assessment of historic sites
”,
Natural Hazards
, Vol. 
96
No. 
2
, pp. 
713
-
730
, doi: .
Murphy
,
C.
(
2020
), “
New Zealand’s unreinforced Masonry Buildings: facing up to the earthquake
”,
IOP Conference Series: Earth and Environmental Science
, Vol. 
410
No. 
1
, 012106, doi: .
Nasiri
,
H.
,
Mohd Yusof
,
M.J.
and
Mohammad Ali
,
T.A.
(
2016
), “
An overview to flood vulnerability assessment methods
”,
Sustainable Water Resources Management
, Vol. 
2
No. 
3
, pp. 
331
-
336
, doi: .
Nguyen
,
C.T.
and
Van Nguyen
,
B.
(
2019
), “
Application of flood vulnerability index in flood vulnerability assessment: a case study in Mai Hoa Commune, Tuyen Hoa district, Quang Binh province
”,
Sustainable Water Resources Management
, Vol. 
5
No. 
4
, pp. 
1917
-
1927
, doi: .
Nguyen
,
T.L.
,
Asahi
,
C.
,
Tran
,
T.A.
and
Le
,
N.H.
(
2022
), “
Indicator-based approach for flood vulnerability assessment in ancient heritage city of Hoi An, Central Region of Vietnam
”,
Natural Hazards
, Vol. 
114
No. 
2
, pp. 
2357
-
2385
, doi: .
Pachauri
,
R.K.
and
Meyer
,
L.A.
(
2015
),
Climate Change 2014 : Synthesis Report. Contribution of Working Groups I, II and III to the Fifth Assessment Report of the Intergovernmental Panel on Climate Change
,
Intergovernmental Panel on Climate Change
,
Geneva
.
Parker
,
L.
,
Bourgoin
,
C.
,
Martinez-Valle
,
A.
and
Läderach
,
P.
(
2019
), “
Vulnerability of the agricultural sector to climate change: the development of a pan-tropical Climate Risk Vulnerability Assessment to inform sub-national decision making
”,
PLoS One
, Vol. 
14
No. 
3
, e0213641, doi: .
Paulik
,
R.
,
Crowley
,
K.
and
Williams
,
S.
(
2021
), “
Post-event flood damage surveys: a New Zealand experience and implications for flood risk analysis
”,
FLOODrisk 2020-4th European Conference on Flood Risk Management
.
Phillipson
,
M.C.
,
Emmanuel
,
R.
and
Baker
,
P.H.
(
2016
), “
The durability of building materials under a changing climate
”,
WIREs Climate Change
, Vol. 
7
No. 
4
, pp. 
590
-
599
, doi: .
Porębska
,
A.
,
Godyń
,
I.
,
Radzicki
,
K.
,
Nachlik
,
E.
and
Rizzi
,
P.
(
2019
), “
Built heritage, sustainable development, and natural hazards: flood protection and UNESCO world heritage site protection strategies in Krakow, Poland
”,
Sustainability
, Vol. 
11
No. 
18
, p.
4886
, doi: .
Schwarz
,
J.
and
Maiwald
,
H.
(
2009
), “
Damage and loss prediction model based on the vulnerability of building types
”,
RIMAX Contributions at the 4th International Symposium on Flood Defence (ISFD4)
.
Samanta
,
S.
,
Koloa
,
C.
,
Kumar Pal
,
D.
and
Palsamanta
,
B.
(
2016
), “
Flood risk analysis in lower part of Markham river based on multi-criteria decision approach (MCDA)
”,
Hydrology
, Vol. 
3
No. 
3
, p.
29
, doi: .
Sesana
,
E.
,
Gagnon
,
A.
,
Bertolin
,
C.
and
Hughes
,
J.
(
2018
), “
Adapting cultural heritage to climate change risks: perspectives of cultural heritage experts in Europe
”,
Geosciences
, Vol. 
8
No. 
8
, p.
305
, doi: .
Sesana
,
E.
,
Gagnon
,
A.S.
,
Ciantelli
,
C.
,
Cassar
,
J.
and
Hughes
,
J.J.
(
2021
), “
Climate change impacts on cultural heritage: a literature review
”,
Wiley Interdisciplinary Reviews: Climate Change
, Vol. 
12
No. 
4
, e710, doi: .
Smit
,
B.
and
Wandel
,
J.
(
2006
), “
Adaptation, adaptive capacity and vulnerability
”,
Global Environmental Change
, Vol. 
16
No. 
3
, pp. 
282
-
292
, doi: .
Stephenson
,
V.
and
D’ayala
,
D.
(
2014
), “
A new approach to flood vulnerability assessment for historic buildings in England
”,
Natural Hazards and Earth System Sciences
, Vol. 
14
No. 
5
, pp. 
1035
-
1048
, doi: .
Tong
,
Q.
,
Filippova
,
O.
and
Ingham
,
J.
(
2022
), “
Effectiveness of unreinforced masonry seismic retrofit programmes: review of policies in New Zealand and the United States
”,
International Journal of Disaster Risk Reduction
, Vol. 
76
, 103008, doi: .
Trizio
,
F.
,
Garzón-Roca
,
J.
,
Eguibar
,
M.Á.
,
Bracchi
,
P.
and
Torrijo
,
F.J.
(
2022
), “
Above the ravines: flood vulnerability assessment of earthen architectural heritage in Quito (Ecuador)
”,
Applied Sciences
, Vol. 
12
No. 
23
, 11932, doi: .
Turner
,
B.L.
,
Kasperson
,
R.E.
,
Matson
,
P.A.
,
McCarthy
,
J.J.
,
Corell
,
R.W.
,
Christensen
,
L.
,
Eckley
,
N.
,
Kasperson
,
J.X.
,
Luers
,
A.
,
Martello
,
M.L.
,
Polsky
,
C.
,
Pulsipher
,
A.
and
Schiller
,
A.
(
2003
), “
A framework for vulnerability analysis in sustainability science
”,
Proceedings of the National Academy of Sciences
, Vol. 
100
No. 
14
, pp. 
8074
-
8079
, doi: .
UNESCO-IHE
(
2023
), “
Flood vulnerability indices (FVI)
”,
available at:
 http://www.unesco-ihe-fvi.org/ (
accessed
 23 May 2023).
United Nations
(
2022a
), “
The sustainable development goal 11
”,
available at:
 https://sdgs.un.org/goals/goal11 (
accessed
 28 March 2023).
United Nations
(
2022b
), “
The sustainable development goal 13
”,
available at:
 https://sdgs.un.org/goals/goal13 (
accessed
 28 March 2023).
Watson
,
R.T.
and
Albritton
,
D.L.
(
2001
),
Climate Change 2001: Synthesis Report: Third Assessment Report of the Intergovernmental Panel on Climate Change
,
Cambridge University Press
,
Cambridge
.
Wellington City Council
(
2023a
), “
How will climate change impact Wellington?
”,
available at:
 https://wellington.govt.nz/climate-change-sustainability-environment/climate-change/climate-change-in-wellington/how-will-climate-change-impact-wellington (
accessed
 1 April 2023).
Wellington City Council
(
2023b
), “
Seismic strengthening for heritage buildings
”,
available at:
 https://wellington.govt.nz/arts-and-culture/heritage/seismic-strengthening (
accessed
 1 April 2023).
Yoo
,
G.
,
Hwang
,
J.H.
and
Choi
,
C.
(
2011
), “
Development and application of a methodology for vulnerability assessment of climate change in coastal cities
”,
Ocean and Coastal Management
, Vol. 
54
No. 
7
, pp. 
524
-
534
, doi: .

Languages

or Create an Account

Close Modal
Close Modal