


We explore the formation of coalitions to provide a public good when some players are averse to payoff inequality between coalition members and non-members. A model is presented to demonstrate how inequality-averse preferences could cause players to deliberately block profitable but inequitable coalitions from forming, and how the likelihood of such blocks is affected by the magnitude of payoff inequality. We then empirically examine coalition formation rates using laboratory experiments. Our results show that profitable coalitions are less likely to form the bigger the gap in payoffs between members and free-riding non-members. The experimental design allows us to tease out potentially confounding effects between the level of inequality and the minimum number of players required to make the coalition profitable. As predicted, controlling for the size of the participation threshold, we find that coalition formation rates fall as the payoff gap between members and non-members is increased.
Introduction
When resource users cannot rely on a regulatory body to adequately provide public goods or manage common resources, they must coordinate their decisions endogenously by creating new institutions. Important examples include the provision of global public goods like nuclear nonproliferation and climate change mitigation. Other examples include local resource management in the absence of strong or effective regulatory institutions (e.g.,fishing communities in developing countries). Endogenous institution formation typically involves individuals voluntarily agreeing to forfeit some of their sovereignty in order to reach a collective goal. In this paper, we examine the voluntary formation of coalitions to provide public goods in which members agree to maximize their collective earnings. Such coalitions have been explored in depth in the literature (e.g.,Barrett, 1994; Eichner and Pethig, 2013; Finus and Pintassilgo, 2013; Kolstad, 2007; McGinty, 2007; Rubio and Ulph, 2006). The equilibrium coalition size (often called a self-enforcing coalition) is one in which no member wants to withdraw and no non-member wants to accede. In equilibrium, the members are materially better off within the coalition than they would be in the absence of any coalition forming. However, non-members, if any, are even better off than coalition members because they get to free ride on the members’ provision of the public good. The difference between member and non-member payoffs is driven by the members’ cost of providing the public good.
Two important points regarding equilibrium coalitions that provide public goods are well established in the literature (beginning with Barrett, 1994). First, coalitions are largest when the cost of providing the public good is high relative to the benefits. This means that coalitions are large when there are relatively small gains from cooperation, and they are small when cooperation could yield large gains. This result, however paradoxical, is a pessimistic prediction for individuals trying to achieve cooperative goals. The second important point is that equilibrium coalitions can be extremely fragile. In many coalition formation models, although not all, a single defection from an equilibrium coalition can make the remaining members worse off than if no coalition had formed. This may suggest that the formation of coalitions is sensitive to individual preferences over non-material earnings, such as those involving preferences for equity.
In this paper, we explore how coalition formation rates are affected by individual preferences over payoff inequality. Inequality aversion is potentially important in the analysis of coalition formation and endogenous institutions in general because of the gap in payoffs between cooperating members and free-riding non-members. If resource users only cared about their material wellbeing, then the equilibrium coalition size is well established. However, if utility also depends on relative earnings, then other equilibrium coalition sizes are possible. In this paper, we build inequality aversion into a standard theoretical model of coalition formation and public good provision. We use the model to demonstrate how coalition formation rates change with the payoff gap between coalition members and non-members when members may feel disutility from earning less than freeriders. Conceptually, an inequality-averse individual may block the formation of a coalition if her material gain from joining the coalition is less than the disutility she experiences from earning less than freeriders. Assuming that the likelihood that a coalition will be blocked is increasing in this disutility, we examine how coalition formation rates are affected by the payoff gap between coalition members and non-members. In the process, we identify two countervailing effects on coalition formation rates of changing this payoff gap. The first is a direct payoff inequality effect which leads to more blocked coalitions as the payoff gap between members and non-members is increased. The second is a threshold effect that is due to the fact that increasing the payoff gap leads to larger minimally profitable coalitions, and thus higher participation thresholds for effective coalitions to form. This threshold effect motivates fewer blocked coalitions because there are then fewer freeriders. The combined effects of increasing the payoff gap on coalition formation rates are non-monotonic. The likelihood of coalition blocks increases with the payoff gap between coalition members and non-members for low payoff gaps but decreases for high payoff gaps. The reason is that the payoff inequality effect dominates the threshold effect for low payoff gaps, while the threshold effect dominates for high payoff gaps.
We then test these predictions with a series of laboratory experiments in which subjects choose whether or not to join a coalition to provide a public good. We start with data from two treatments in McEvoy et al. (2011) and McEvoy (2010) as our point of departure. In those two treatments, the authors compare coalition formation rates when the cost of contributing to the public good is either low or high. They find that coalitions form significantly less often when the cost of providing the public good is relatively high. However, with only these treatments it is not possible to disentangle the payoff effect (i.e.,the payoff gap between members and non-members is higher in the high-cost treatment) and the threshold effect (i.e., fewer freeriders exist when coalitions form in the high-cost treatment). Therefore, we introduce two new treatments: one in which the payoff gap between members and non-members is low but the participation threshold remains high and one in which the payoff gap between members and non-members is high but the participation threshold is low. With this 2 × 2 design, our experiments isolate the effects of payoff inequality, the threshold effect, and their combined effects on coalition formation rates.1
As predicted, controlling for the size of the participation threshold, we find that coalition formation rates fall as the payoff gap between members and non-members is increased. However, our results do not support the hypothesis that coalition formation rates increase with higher participation thresholds, holding the payoff gap constant. This may be due to a coordination problem of reaching a higher threshold that offsets the reduction in the disutility from unequal payoffs that come from having fewer freeriders. Previous experimental studies of threshold public goods games have found that increasing the minimum number of required contributors reduces the likelihood of reaching the threshold (Dawes et al., 1986; Van de Kragt et al., 1983).2 Finally, given the parameters we chose for our experiments, we expected that the combined effects of payoff inequality and higher thresholds would lead to lower coalition formation rates. In fact, this is what we observe in our experiments.
A number of theoretical papers have explored the role of inequality on equilibrium coalition sizes. Lange and Vogt (2003) model international environmental agreements when countries have other regarding preferences. They explore agreement formation when players have preferences toward equity and competition leaning on the theory developed by Bolton and Ockenfels (2000). They find that if countries put significant weight on earning an equal payoff share, then other equilibria are possible compared with standard models of payoff maximizing agents. Preferences toward equity can increase coalition sizes and even the grand coalition is possible. Lange (2006) adapts the standard model of international environmental agreements to allow for inequality-averse preferences across different forms of inequity among heterogeneous countries. His model imposes payoff inequality exogenously by dividing the world into developed and developing countries. He also finds that inequality aversion can motivate larger coalition sizes. A more recent paper by Kolstad (2014) provides a review of the literature on international environmental agreements and social preferences and introduces a model of agreement formation when countries have preferences according to the theory developed by Charness and Rabin (2002). The model specifies a utility function that includes preferences toward equity, altruism, and efficiency. Kolstad (2014) finds that when countries have such preferences, equilibrium coalition sizes can be smaller than those predicted by pure self-interest. The reason is that altruism and preferences for efficiency increase a player’s utility from cooperating (relative to only considering material payoffs) and so it is possible that fewer coalition members are needed to make cooperation desirable.
As others have found, our theoretical model suggests that inequality aversion can increase the size of equilibrium coalitions. However, our model also suggests that inequality aversion can cause coalitions that maximize collective payoffs to form less often than if all players had standard preferences. This insight is missing from the related literature.3
The study closest to ours is Kosfeld et al. (2009). Like our work, they introduce a model of public good provision and coalition formation that allows for inequality-averse preferences according to the theory proposed by Fehr and Schmidt (1999). They also demonstrate that inequality aversion can increase equilibrium coalition sizes. In laboratory experiments, they find that groups tend to form large coalitions, in fact, most often the grand coalition forms. Their approach, however, deviates in a fundamental way from the established literature on coalition formation. Their model and experiments do not specify the objective of successful coalitions ex ante. Rather, individuals join a coalition and then vote on what they will do ex post. Therefore, when players decide whether to join a coalition they are uncertain about what their payoffs will be. This is a striking difference from the broad literature on coalition formation and is therefore unique. That Kosfeld et al. (2009) observe large coalition sizes in their experiments may be the product of inequality aversion or it could be the product of the uncertainty in members’ payoffs at the time they decide to join a coalition. In contrast, our study uses a model firmly grounded in the literature on stable coalitions in which coalition members maximize their collective payoffs.
Our paper also fits in with the broader literature on exploring the role of inequality aversion in public good and other strategic games (e.g.,Blanco et al., 2011; Fehr and Schmidt, 2006; Teyssier, 2012). The literature makes an important distinction between individual and aggregate-level analyses of inequality aversion. The approach for individual analyses has been to tease out inequality aversion parameters from separate ultimatum and modified dictator games and then use those estimates to make subject-specific predictions in other games. Blanco et al. (2011) find that while inequality-aversion models predict observed behavior well in aggregate (consistent with Fehr and Schmidt, 2006), the models are less informative at the individual level. One explanation is that inequality-aversion is context specific, and inequality aversion parameters will differ not only between games but also within games. Our experimental design is focused on aggregate behavior regarding coalition formation rates between treatments and not on individual hypothesis tests based on inequality-aversion parameters derived from other environments. The assumption is that the unobserved distribution of inequality aversion is similar between samples given the random assignment to treatments, and therefore the focus is on relative treatment effects.
The rest of this paper proceeds as follows. In the next section, we present our theoretical model of coalition formation to provide a public good with individuals who may have preferences over payoff inequality. In the third section, we present our experimental design and hypotheses derived from the theoretical model. We present the results of the experiments in the fourth section and conclude in the final section.
The Model
Following Barrett (2003), Kolstad (2007), McEvoy and Stranlund (2009), and McEvoy et al. (2011), consider n players with identical monetary payoffs who each make a binary decision whether to contribute to a public good. Player i’s payoff function is
where qi∈ (0,1) is the decision whether to contribute, q–i is the sum of contribution decisions made by all players other than i, b > 0 is the public marginal benefit from an individual contribution, c > 0 is the individual cost of contributing, and A is a positive constant. Throughout, c > b, so no player contributes to the public good in a non-cooperative Nash equilibrium, and nb > c so that all n players contribute to the public good in the social optimum. Thus, we have familiar n-player Prisoners’ Dilemma.
2.1 Coalition Formation with Payoff-Maximizing Players
Players have the opportunity to form a coalition to provide the public good. The game has two stages. In the first stage, players decide independently and sequentially under perfect information whether to join a coalition. In the second stage, each player chooses whether to contribute to the public good. Those who join a coalition in the first stage are assumed to make their contribution decisions to maximize their joint payoffs. If enough players join a coalition so that each is better off contributing to the public good than not contributing, then such a coalition is called effective and all of its members contribute to the public good. All effective coalitions are profitable in the sense that each member is at least as well off contributing to the public good as they would be if no player contributed. If too few players join a coalition in the first stage to make contributions to the public good worthwhile, then none of them contribute and an effective coalition does not form. Players who choose not to join a coalition in the first stage never contribute to the public good in the second stage.
If we let s be the number of coalition members from the first stage of the game and the coalition jointly provides the public good, a member’s payoff is
where the superscript m denotes membership in a coalition. A nonmember’s payoff in this situation is
where the superscript nm denotes non-membership. Note that nonmembers earn more than members because they avoid paying the cost of providing the public good. The effect on coalition formation when the payoff gap c varies is the focus of our work.
The equilibrium coalition size in the simultaneous-choice version of this game is called a self-enforcing coalition. A self-enforcing coalition is one that is internally and externally stable in the sense that no member wishes to leave and no non-member wishes to join (Barrett, 1994). It is well-established in this context that the only internally and externally stable coalition size is the smallest profitable (or effective) coalition size, which we denote as s*. To determine s*, set Eq. (2) equal to A (the non-cooperative payoff level) and solve for s to find s = c/b. s* is the smallest integer value greater than or equal to c/b. That is,
Note that s* increases (weakly) in the cost of providing the public good and decreases in the benefit. Therefore, as explained by Barrett (1994), equilibrium coalitions are relatively large (small) when the benefits from providing the public good are relatively small (large). Because coalitions with fewer than s* members will not form, we will refer to s* as the participation threshold for an effective coalition to form.
While the equilibrium coalition size s* is usually derived under the assumption that players make simultaneous decisions to join or not, it is also the subgame-perfect coalition size in a game of sequential decisions, which is a feature of our experiments. To see why, first define a critical player as a player whose decision not to join a coalition in the first stage prevents an effective coalition from forming. Note that a player is critical if n – s* players have already refused to join a coalition. A critical player who simply maximizes her financial payoff will always choose to join a coalition. The reason is that if she refuses to join then all potential coalitions are unprofitable (i.e.,the participation threshold is not met), implying that an effective coalition will not form and all players earn their non-cooperative payoff A. On the other hand, if she joins she cannot do worse than the non-cooperative payoff, which would occur if another critical player refuses to join, but she will be better off if all remaining players (who are themselves critical) join to form an effective agreement. While all critical players will join an agreement, all non-critical players will refuse to join because they earn more by staying out of an effective agreement. Therefore, an effective coalition with s* members will form in the first stage of the game. In terms of timing, the first n – s* players to choose will decide to stay out of a coalition while the remaining s* will join.4 In the second stage, the members of the coalition will provide their units of the public good while the non-members will not contribute.
2.2 Coalition Formation with Inequality-Averse Preferences
In this section, we modify the model to incorporate inequality aversion following Fehr and Schmidt (1999). A similar approach is used in Kosfeld et al. (2009) and McEvoy et al. (2015). While these authors have established that inequality aversion can cause larger coalitions to form, we focus here on how inequality-averse individuals may block profitable coalitions from forming in the sense that they refuse to join a coalition when they are critical for its formation. An inequality-averse individual may block a profitable coalition if the disutility they feel from earning less than freeriders is great enough. Assuming that coalitions are more likely to be blocked the greater is this disutility, we examine the likelihood that coalitions are blocked as a function of the payoff gap between coalition members and non-members.
Define the utility (including inequality aversion) of a member of an effective coalition with s members as:
where αi≥ 0 captures an individual’s loss from disadvantageous inequality (i.e.,disutility when other players earn more), and βi≥ 0 captures the loss from advantageous inequality (i.e.,disutility when other players earn less). The third term in Eq. (5) is zero because all members earn equivalent payoffs so that , and non-members earn strictly higher payoffs than members so that and max The second term in Eq. (5) reduces to (n – s)c, because is multiplied by the number of non-members. The first term in Eq. (5) is Eq. (2).
Therefore, a member’s utility can be written as:
Note that bs – c is the monetary payoff from joining a coalition with s members. The fourth term is a coalition member’s disutility from earning less than non-members. We will examine this term more thoroughly shortly.
Now define the utility of a non-member of a coalition with s members as:
The second term in Eq. (7) equals to 0 because and The third term in Eq. (7) is equal to sc, because and is multiplied by the number of members. The first term in Eq. (7) is Eq. (3), and therefore a non-member’s utility can be expressed as:
In Eq. (8), bs is a freerider’s gain if a coalition of size s forms to provide the public good. The third term is the disutility a freeriding non-member experiences because she earns more than coalition members. Like Fehr and Schmidt (1999) we assume αi βi so that an individual feels less pain from advantageous inequality than disadvantageous inequality.
In the previous section in which players were only concerned about their individual payoffs, the equilibrium coalition is the smallest profitable coalition defined by Eq. (4). Here we use the more general utility measure from Eq. (6) to solve for the minimum preferred coalition size for an inequality-averse individual. Solving for s yields this individual’s minimum preferred coalition size as:
It is straightforward to show that is strictly increasing in αi and it is equal to c/b when αi = 0. Consequently, for an individual that does not experience disutility from disadvantageous inequality and for an individual who does feel such disutility.
Since an inequality-averse individual may demand that coalitions form that are larger than the participation threshold for an effective coalition to form. Thus, aversion to disadvantageous inequality can lead to the formation of larger coalitions depending on the prevalence of this preference in a group of players. However, this sort of inequality aversion can also frustrate coalition formation. Individuals who do not feel disutility from disadvantageous inequality would always rather join a minimum profitable coalition than to see it fail. However, an individual who is averse to disadvantageous inequality may actually block a profitable coalition from forming.
To explore this possibility more thoroughly, return to the payoff of an inequality-averse member of a coalition given by Eq. (6). Note that an individual will block a coalition of size s if Eq. (6) is strictly less than the non-cooperative payoff A. Note also that an individual can only block a coalition if her joining is critical for its formation. This implies further that an individual can only block the minimum profitable coalition given by Eq. (4). Therefore, an inequality-averse individual blocks the minimum size profitable coalition if and only if
The monetary payoff from joining a coalition with s* members is bs*- c. This is greater than or equal to 0, so a payoff-maximizing individual will never block a coalition that reaches the participation threshold. However, the expression
is the disutility an inequality-averse member of a coalition with s* members feels because non-members earn more. It is clear that even though a coalition with s* members is profitable, an inequality-averse individual may block the coalition if the disutility from earning less than freeriders is high enough. It is reasonable for us to assume that the higher is d(s*) the more likely it is that a profitable coalition will be blocked by an inequality-averse individual.
To examine how the disutility from disadvantageous inequality changes with the payoff gap between coalition members and nonmembers, let the participation threshold be
where γ is a non-negative parameter used here to account for the discreteness of coalition sizes. Plug this into Eq. (11), differentiate with respect to c and rearrange terms to obtain This indicates that the individual’s disutility from disadvantageous inequality increases for c up to approximately bn/2 and then falls from that point to bn. Thus, increasing c (and the accompanying participation threshold) can increase the number of blocked coalitions for low initial levels of c and smaller thresholds, but decrease the number of blocked coalitions for higher initial levels of c and larger thresholds.
The intuition behind the non-monotonic effect of increasing the payoff gap between members and non-members on coalition formation rates is the following. From Eq. (11), note that the disutility from earning less than freeriders increases with the payoff gap, holding s* constant. We refer to this effect as the payoff inequality effect. On the other hand, increasing s* while holding c constant reduces the disutility from disadvantageous inequality because the number of freeriders is smaller. We refer to this countervailing effect as the threshold effect. In total, increasing the payoff gap between members and non-members has a non-monotonic effect on the disutility from earning less than freeriders, because the payoff inequality and threshold effects work in opposite directions. Moreover, the inequality effect dominates for low initial payoff gaps and accompanying participation thresholds, while the threshold effect dominates for higher initial payoff gaps and larger participation thresholds.
In the next section, we present experiments designed to isolate the payoff inequality effect and the threshold effect of increasing the payoff gap between coalition members and non-members. If inequality aversion plays a significant role in coalition formation, we expect to observe a lower coalition formation rate as the payoff gap is increased, holding the participation threshold constant, but a higher formation rate as we increase the participation threshold, holding the payoff gap constant. What happens to the coalition formation rate as we allow both the payoff gap and the participation threshold to adjust depends on the parameters chosen for the experiment. We chose parameters that imply a lower coalition formation rate as the payoff gap and participation thresholds increase together.
Experimental Design
In each experimental treatment, players decide individually whether or not they want to join a coalition. After all players decide, coalition members automatically make their binary contribution decisions to maximize joint payoffs. Therefore, if enough players join to make the agreement profitable, then an effective coalition forms and all coalition members contribute to the public good. If too few players join to reach the participation threshold then no one contributes. Nonmembers maximize their individual payoffs by not contributing to whether effective coalition forms or not. In our experiment, all second stage contribution decisions were automated, and the single decision is whether or not to join the coalition.5
Players were placed in groups of 10 and had payoff functions matching Eq. (1). The first two treatments differ in the cost of contributing to the public good and the participation threshold for an effective coalition to form. In these treatments, A = 8, b = 3, and c, the cost of contributing, was either 7 (low cost) or 15.10 (high cost). In the treatment in which c = 7 (labeled T1), by Eq. (4), the participation threshold for an effective coalition is three members (the smallest integer greater than c/b = 7/3 = 2.33). Players were informed of this threshold before making their decisions, and their potential payoffs for all possible decisions were displayed in tabular form (instructions available from corresponding author). This payoff table is reproduced in Table 1 below. For this treatment, when three players join the coalition, each earns $10 while non-members earn $17 (i.e.,the payoff gap is $7).6 If fewer than three members join the coalition, then no player contributes and each earns $8. From the table it is clear that there is a financial incentive to be a member of an effective coalition (i.e.,one with three or more players) relative to when a coalition fails (i.e.,when less than three join). However, it is always more lucrative to be a non-member outside of an effective coalition.
Payoff table for T1.
| # of OTHER players that join coalition | 0 | 1 | 2 | 3 | 4 | 5 | 6 | 7 | 8 | 9 |
|---|---|---|---|---|---|---|---|---|---|---|
| YOUR earnings if you join | 8 | 8 | 10 | 13 | 16 | 19 | 22 | 25 | 28 | 31 |
| YOUR earnings if you do not join | 8 | 8 | 8 | 17 | 20 | 23 | 26 | 29 | 32 | 35 |
As the cost of providing the public good is increased to 15.10 in treatment T2, the threshold for an effective coalition increases to six players (the smallest integer greater than 15.10/3 = 5.03).7 For a coalition of exactly six members, each member earns $11 and nonmembers each earn $26. Thus, when the cost of public good provision is higher, the threshold coalition size is higher and so too is the gap between member and non-member earnings. Table 2 shows the payoffs for members and non-members for T2.
Recall from our theoretical model that members of a coalition may feel disutility from earning less than free-riding non-members and so may block profitable coalitions if this disutility is great enough. Moreover, increasing the payoff gap between members and non-members produces countervailing payoff inequality and threshold effects on the disutility from differential payoffs and, in turn, on the likelihood that coalitions will be blocked. However, for the parameters in T1 and T2, the payoff-inequality effect dominates the threshold effect so that coalitions will form at a higher rate under T1 than T2 if there are inequality-averse subjects in our subject pool. To see this, using our parameters, the values of the inequality disutility (11) are d(3) = αi(5.44) and d(6) = αi (6.67), under T1 and T2, respectively. Thus, the disutility from earning less than freeriders is higher under T2 than T1, demonstrating that the payoff inequality-effect dominates the threshold effect. Moreover, from Eq. (10), if αi> 0.367 in T1 or αi> 0.170 in T2, then a player would rather block a profitable coalition from forming than be a contributing member. The greater range of the inequality parameter for which an individual will block a profitable coalition under T2 implies that the probability a profitable coalition will be blocked is higher under T2 than under T1. Therefore, we have the following hypothesis.
Payoff table for T2.
| # of OTHER players that join coalition | 0 | 1 | 2 | 3 | 4 | 5 | 6 | 7 | 8 | 9 |
|---|---|---|---|---|---|---|---|---|---|---|
| YOUR earnings if you join | 8 | 8 | 8 | 8 | 8 | 11 | 14 | 17 | 20 | 23 |
| YOUR earnings if you do not join | 8 | 8 | 8 | 8 | 8 | 8 | 26 | 29 | 32 | 35 |
Hypothesis 1. Coalition formation rates are higher under T1 than under T2.
We conduct two more treatments to isolate the payoff inequality and threshold effects of increasing the payoff gap between coalition members and non-members from $7 to $15. In treatment T3, the participation threshold is kept small at three members, but we increase the payoff gap between members and non-members to mirror T2 at $15. The payoffs for T3 are found in Table 3.
The final treatment T4 maintains a high participation threshold at six members with a small payoff gap between members and non-members of $7. The payoffs for T4 are found in Table 4.
Payoff table for T3.
| # of OTHER players that join coalition | 0 | 1 | 2 | 3 | 4 | 5 | 6 | 7 | 8 | 9 |
|---|---|---|---|---|---|---|---|---|---|---|
| YOUR earnings if you join | 8 | 8 | 11 | 14 | 17 | 20 | 23 | 26 | 29 | 32 |
| YOUR earnings if you do not join | 8 | 8 | 8 | 26 | 29 | 32 | 35 | 38 | 41 | 44 |
Payoff table for T4.
| # of OTHER players that join coalition | 0 | 1 | 2 | 3 | 4 | 5 | 6 | 7 | 8 | 9 |
|---|---|---|---|---|---|---|---|---|---|---|
| YOUR earnings if you join | 8 | 8 | 8 | 8 | 8 | 10 | 13 | 16 | 19 | 22 |
| YOUR earnings if you do not join | 8 | 8 | 8 | 8 | 8 | 8 | 17 | 20 | 23 | 26 |
Given that the payoff inequality effect suggests that increasing the payoff gap between members and non-members can cause a coalition member to feel greater disutility from earning less than non-members, holding the participation threshold constant, we have the following hypothesis.
Hypothesis 2. Coalition formation rates are higher under T1 than under T3. For the same reason, coalition formation rates are higher under T4 than under T2.
Finally, because increasing the participation threshold is expected to reduce the disutility a coalition member feels from earning less than nonmembers, holding the payoff gap between members and non-members constant, we have our final hypothesis:
Hypothesis 3. Coalition formation rates are higher under T4 than under T1, and they are higher under T2 than under T3.
A summary of the difference in payoffs and participation thresholds for the four treatments is displayed in Table 5.
Protocols
For treatments T1 and T2, we utilize the experiments and data from McEvoy (2010) and McEvoy et al (2011). 8. Treatments T3 and T4 use the same software program (programmed in Visual Basic) but with parameter values to reflect the payoffs in Tables 3 and 4. These experiments were conducted at Appalachian State University using undergraduates recruited from the general student population. Subjects made decisions individually and were given a set of instructions at their station that were read aloud by the moderator. Each session consisted of 20 subjects, and participants were assigned randomly to one of the two groups of 10. The groups were reshuffled each period so that the same 10 people were never in the same group for more than one period. Two 13-period sessions were conducted for each of the four treatments yielding 520 individual observations and 52 group-level observations per treatment. Subjects were paid for all 13 periods. The frame of the experiment was kept neutral and players made decisions whether to join an agreement in which the members either jointly produce an unspecified product (if the participation threshold was met) or jointly not produce (if they did not meet the threshold).
As we are focused on the effect of payoff inequality on coalition formation rates, we tried to mitigate coordination problems as much as possible. Therefore, the software was designed so that membership decisions were made sequentially with subjects having real-time information regarding the decisions made by the other nine members of the group. This information included the number of players that joined, the number that opted out, and the number waiting to decide. Subjects were also updated with how many more players were needed to join to satisfy the participation threshold. The order of decision-making was endogenous (subjects could make decisions at any point in time), and once a subject made a decision the other players were notified, and their decision buttons were made inactive for a fraction of a second so they could reevaluate their position. Once all players made their decision whether to join the agreement the period ended and the results were displayed.9.
Results
Table 6 presents group-level summary statistics on effective coalition formation rates, the average number of members when effective coalitions form, and the average number of members for all coalitions (including failures) by treatment. Recall that if players are strict payoff-maximizers, then coalitions are expected to form in 100% of trials for each of the four treatments. However, if at least some players have strong enough preferences for equal payoffs, then they may be better off causing a profitable coalition to fail rather than being a member. Our predictions about how coalition formation rates vary across treatments are contained in Hypotheses 1–3 in the previous section. Aggregating over all four treatments, profitable coalitions failed to form in roughly 20% of all trials. To illustrate changes over time, Figure 1 shows coalition formation rates over the 13 periods for each treatment. Each data point on the graph is the fraction of the four groups that formed effective coalitions. It is immediately clear that coalition formation rates are higher and more stable in the two treatments with lower payoff inequality.
Effective coalition formation rates and average number of members.
| Treatment | Effective coalition formation rates | Average effective coalition size | Average coalition size overall |
|---|---|---|---|
| T1: low payoff inequality ($7)/low threshold (three members) | 0.962 (0.027) [52] | 4.26 (0.166) [50] | 4.135 (0.184) [52] |
| T2: high payoff inequality ($15)/high threshold (six members) | 0.615 (0.068) [52] | 6.188 (0.096) [32] | 5.212 (0.206) [52] |
| T3: high payoff inequality ($15)/low threshold (three members) | 0.75 (0.061)[52] | 3.231 (0.086)[39] | 2.827 (0.128)[52] |
| T4: low payoff inequality ($7)/high threshold (six members) | 0.865 (0.048)[52] | 6.311 (0.089)[45] | 5.981 (0.147)[52] |
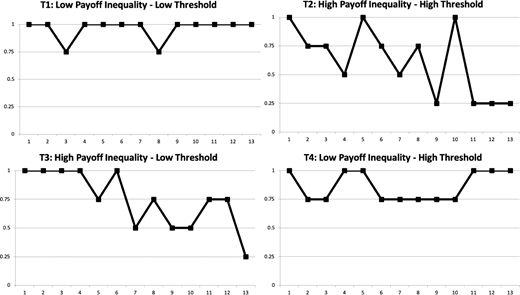
Coalition formation rates by treatment over time.
Coalition formation rates by treatment over time.
For a more granular look at coalition sizes in the experiments, Table 7 contains the number of players that joined a coalition for each unique group over all periods. In the Table 7, S1 and S2 indicate session 1 and 2, while lower case a and b are used to denote the group (recall, groups are shuffled each period).
Coalition sizes by treatment, group, and period.
| Period | ||||||||||||||
|---|---|---|---|---|---|---|---|---|---|---|---|---|---|---|
| 1 | 2 | 3 | 4 | 5 | 6 | 7 | 8 | 9 | 10 | 11 | 12 | 13 | ||
| T1 | S1.a | 5 | 4 | 0 | 4 | 3 | 3 | 3 | 2 | 4 | 5 | 4 | 3 | 3 |
| S1.b | 7 | 3 | 6 | 6 | 4 | 3 | 5 | 4 | 3 | 4 | 4 | 3 | 6 | |
| S2.a | 4 | 4 | 5 | 5 | 7 | 3 | 6 | 4 | 3 | 4 | 5 | 4 | 4 | |
| S2.b | 3 | 3 | 5 | 4 | 7 | 5 | 3 | 5 | 4 | 4 | 3 | 4 | 6 | |
| T2 | S1.a | 6 | 6 | 5 | 6 | 6 | 3 | 6 | 6 | 2 | 6 | 3 | 6 | 5 |
| S1.b | 6 | 7 | 6 | 2 | 6 | 6 | 6 | 4 | 4 | 6 | 6 | 3 | 4 | |
| S2.a | 8 | 6 | 6 | 6 | 6 | 6 | 5 | 6 | 5 | 6 | 5 | 3 | 4 | |
| S2.b | 6 | 3 | 6 | 2 | 8 | 6 | 2 | 6 | 6 | 7 | 4 | 5 | 6 | |
| T3 | S1.a | 3 | 3 | 3 | 4 | 3 | 3 | 2 | 3 | 5 | 2 | 2 | 3 | 0 |
| S1.b | 3 | 3 | 4 | 3 | 5 | 3 | 3 | 2 | 3 | 3 | 3 | 3 | 2 | |
| S2.a | 3 | 3 | 3 | 3 | 3 | 3 | 2 | 3 | 2 | 3 | 4 | 3 | 3 | |
| S2.b | 3 | 3 | 3 | 3 | 1 | 4 | 4 | 3 | 2 | 2 | 3 | 0 | 2 | |
| T4 | S1.a | 6 | 6 | 6 | 6 | 6 | 7 | 6 | 6 | 6 | 6 | 7 | 7 | 6 |
| S1.b | 7 | 3 | 7 | 6 | 6 | 5 | 6 | 4 | 9 | 6 | 6 | 6 | 7 | |
| S2.a | 7 | 6 | 6 | 6 | 7 | 6 | 6 | 6 | 4 | 6 | 6 | 6 | 6 | |
| S2.b | 7 | 6 | 3 | 6 | 6 | 6 | 5 | 6 | 6 | 3 | 7 | 6 | 7 | |
We supplement the summary statistics in Tables 6 and 7 and Figure 1 with a series of regression models of coalition formation to control for potential period and session effects and to rely on robust standard errors for our hypotheses tests. The dependent variable in each case takes on a value of 1 when an effective coalition forms. We regress this on dummy variables for the treatments (relative to T1), session, and period.10Table 8 contains regression results for a linear probability,probit, and logit specification (marginal effects are reported for the probit and logit models). We omit the coefficient estimates for periods and sessions in Table 8.
Regression results on effective coalition formation.
| Linear | Probit | Logit | |
|---|---|---|---|
| T2 | –0.385*** (0.095) | –0.261*** (0.063) | –0.146*** (0.034) |
| T3 | –0.269***(0.088) | –0.204***(0.066) | –0.116***(0.037) |
| T4 | –0.154**(0.076) | –0.128*(0.071) | –0.078*(0.041) |
| Constant | 1.202***(0.050) | 6.740***(0.379) | 19.071***(0.844) |
| Model statistics | n = 208, F = 2.81, p = 0.000, r2 = 0.179 | n = 208, χ2 = 1084.17, p = 0.000 | n = 208, χ2 = 1763.09, p = 0.000 |
| Hypotheses tests | T2 vs. T4, p = 0.051 | T2 vs. T4, p = 0.044 | T2 vs. T4, p = 0.050 |
| T3 vs. T2, p = 0.360 | T3 vs. T2, p = 0.353 | T3 vs. T2, p = 0.333 | |
| T3 vs. T4, p = 0.301 | T3 vs. T4, p = 0.258 | T3 vs. T4, p = 0.287 |
Notes: In each model, the dependent variable takes on a value of 1 when an effective coalition forms and 0 otherwise. The superscripts ***, **and * indicate significance at the 0.01, 0.05 and 0.10 level, respectively. Standard errors are in parentheses. The hypothesis test results reported are from postestimation Wald tests.
Total Effect of Increasing the Payoff Gap Between Members and Non-Members (Hypothesis 1)
From Table 6, effective coalitions formed most often (96.2%) in T1, the scenario with low payoff inequality between members and non-members and a low participation threshold. Comparing this to the corresponding result from T2 (61.5%), the effective coalition rate decreased by about 35% in response to an increase in the cost of contributing to the public good and the accompanying increase in the participation threshold. This reduction is highly significant — observe the coefficients for T2 in each of the regression models of Table 8. Given the parameters of our experiments, this effect of increasing the payoff is what we expected, thereby confirming Hypothesis 1.
Effect of Increasing Payoff Inequality, Controlling for the Threshold Effect (Hypothesis 2)
Now we keep the participation thresholds constant and examine the effects of an increase in payoff inequality on coalition formation rates, which we expect to be negative. Start by considering treatments T1 and T3 that have a participation threshold fixed at three members while the gap in payoffs jumps from $7 in T1 to $15 in T3. In fact, the formation rate is lower under T3 (75%) than under T1 (96.2%). This effect is captured by the coefficient on T3 in the regression models of Table 8, which are all highly significant. Now consider treatments T2 and T4 that each includes a relatively high participation threshold of six members, but the payoff gap drops from $15 in T2 to $7 in T4. Again higher payoff inequality holding the participation threshold constant reduces the coalition formation rate (61.5% vs. 86.5% for T2 vs. T4). Hypotheses tests in Table 8 indicate that this effect is significant for each regression model. These results confirm Hypothesis 2 that increasing payoff inequality holding the participation threshold reduces coalition formation rates.
Effect of Increasing the Participation Threshold, Holding the Payoff Gap Constant (Hypothesis 3)
Contrary to Hypothesis 3, the threshold effects tend toward decreasing coalition formation rates, although these effects are not all statistically significant. Recall that the difference between T1 and T4 is that the payoff gap is constant at $7 while the participation threshold increases from three to six members. We expect that the coalition formation rate will be lower under T1, but in fact the formation rates are not very different (96.2% vs. 86.5% for T1 vs T4), and the hypothesis tests in Table 8 suggest that this difference is only weakly significant.11 Similarly, we expect that coalition formation rates would be lower under T3 than under T2, but the opposite occurs (75% vs. 61.5% for T3 vs. T2). This effect is not significant at conventional levels for any of our regression specifications in Table 8, but the overall message is clear — we find no support for a positive threshold effect (Hypothesis 3).
What could explain this result? One possibility is that a separate coordination effect (that is not modeled here) is at work that makes it harder for groups to form coalitions with higher participation thresholds. In fact, evidence from binary-choice threshold public goods games suggests that this may be a common finding (Dawes et al., 1986; Van de Kragt et al., 1983). Such a coordination effect could be working to offset the conceptual threshold effect in our experiments.
Coalition Sizes
Recall that our theoretical model suggests that inequality-averse individuals will tend to require that larger coalitions form for their participation. If such preferences are prevalent in a group, then coalitions can form that exceed the participation threshold levels. From Table 6, we observe effective coalition sizes higher than the relevant threshold in all four treatments, but with substantial variability. The largest difference is found in T1 in which coalitions average 1.26 members more than the threshold of three. Recall that in this treatment, both the payoff gap and the participation threshold are low. The next largest difference between the average coalition size and the threshold is observed in T4 in which payoff inequality remains low but the threshold is increased (0.311 members more than the threshold of six). In the two treatments in which payoff inequality is high (T2 and T3), coalition sizes are closest to the threshold levels. In summary, while we observe effective coalition sizes greater than the threshold in all four treatments, coalitions are relatively larger when the gap between member and non-member payoffs is smaller.
When considering the average size of all coalitions (including ones that did not reach the participation threshold) in Table 6, again, the only treatment with evidence of participation levels greater than the threshold is T1 (4.12 vs. 3). In contrast, we see lower participation rates compared with the threshold in T2 (5.212 vs. 6), T4 (5.981 vs. 6), and T3 (2.827 vs. 3).
Post-Survey Results on Motives
When the experiment concluded all participants completed a short survey. One of the questions asked the subject to think back during the game and indicate whether or not they ever blocked a coalition when their participation was critical for its formation. If they answered yes, they were then asked to elaborate on why. The responses were open-ended and were solicited only to provide some supporting evidence as to what motivated players to deliberately block profitable coalitions from forming. In T1 only two of 52 possible coalitions were blocked and only one subject indicated they blocked a coalition from forming. In treatments T2, T3, and T4 more coalitions were blocked and, therefore, more subjects responded to the question set.
We categorized the open-ended responses according to five themes: inequality aversion, conditional punishment, spite, trying too hard to free ride, and other. A response was categorized as “inequality aversion” if the sentiment was that the subject blocked the coalition to prevent others from earning more than themselves. As an example, one subject wrote:
“Yes, because if I was the 5th person not to agree then everyone received $8. By agreeing I was able to make $11. However this let the others that had not agreed to make $26. I sacrificed myself”.
Responses that suggested the coalition was blocked as payback for a previously blocked coalition were categorized as “conditional punishment”, while “spite” captured a primary motive of reducing others’ earnings. A number of subjects indicated that they blocked the coalition because they were “trying too hard to free ride”. This response either suggests a lack of understanding of how a coalition formed or perhaps these respondents were not paying close enough attention when their decision to join the agreement became critical. The last category “other” is a catch-all for responses that were not easily categorized or understandable. The summary statistics are included in Table 9. Although the data is too thin for statistical tests, the majority of responses in the treatments with a significant number of blocked coalitions (T2 and T3) indicated inequality aversion as the motive.
Order of Individual Decisions
We conclude the results section with an analysis of the sequencing of individual decisions to join or not join a coalition across the four treatments. In particular, we note that when the payoff inequality between members and non-members is relatively low (T1 and T4), a higher fraction of first movers choose to join the coalition compared with when payoff inequality is relatively high (T2 and T4). Figure 2 shows the percentage of subjects that join a coalition, conditional on the order of their decisions (1 is the first movers, 2 is the second movers, and so on). The top panel of Figure 2 shows the low payoff inequality treatments (T1 and T4) and the bottom panel shows the high payoff inequality treatments (T2 and T3). The dashed lines indicate the low threshold treatments (T1 on the top and T3 on the bottom) and the solid lines indicate the high threshold treatments (T4 on the top and T2 on the bottom).
Post-experiment survey responses on motives for blocking profitable coalitions.
| Inequality aversion | Conditional punishment | Spite | Trying too hard to free ride | Other | N | |
|---|---|---|---|---|---|---|
| T2 | 7 (53.8%) | 3 (23.1%) | 1 (7.7%) | 1 (7.7%) | 1 (7.7%) | 13 |
| T3 | 6 (54.5%) | 1 (9.1%) | 2 (18.2%) | 0 (0%) | 2 (18.2%) | 11 |
| T4 | 1 (25%) | 0 (0%) | 0 (0%) | 1 (25%) | 2 (50%) | 4 |
Figure 2 suggests that when the payoff inequality between members and non-members is relatively low (T1 and T4), a higher fraction of first movers chose to join the coalition compared with when payoff inequality was relatively high (T2 and T3). In fact, under T1 and T4, the majority of the initial decisions were to join an agreement. With a low threshold of three members (T1), the percentage tapered off after the third decision, but with the high threshold of six members (T4), the percentage of joiners remained high until later decisions. In contrast, when the payoff gap between members and non-members was relatively high (T2 and T3), the majority of initial decisions were to opt-out of an agreement. The bottom panel of Figure 2 shows that the percentage joining the agreement increased with the decision order when the participation threshold was six (T2) compared with three (T3).
Figure 2 reveals how the payoff-inequality effect affects the order of individual decisions. It appears that a relatively low payoff gap between members and non-members triggers more cooperative behavior by the early movers, while a high payoff gap triggers more non-cooperative behavior by early movers. Our theoretical model cannot explain this phenomenon because it focuses on how inequality-averse individuals may block coalitions from forming and says little else about the order of individual decisions. However, the combination of more early commitments to a coalition and a lower probability of profitable coalitions being blocked can both lead to high levels of coalition formation when the payoff gap between coalition members and non-members is low.
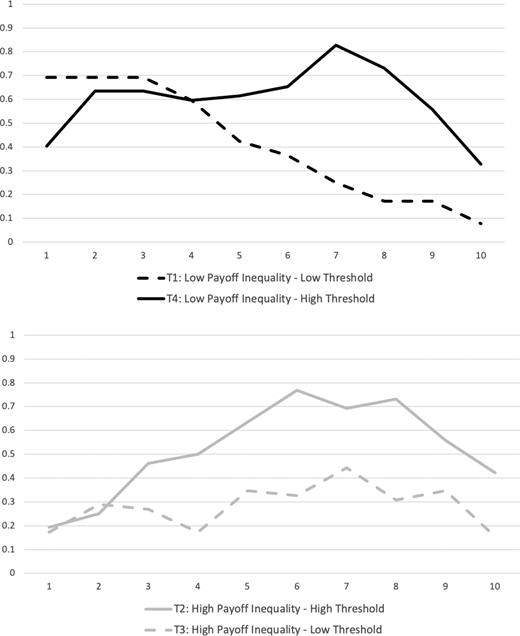
Percent of ordered decisions in which subjects chose to join the coalition.
Percent of ordered decisions in which subjects chose to join the coalition.
Conclusion
Challenges like managing common resources, climate change mitigation, nuclear non-proliferation, and the preservation of biological diversity require individuals to voluntarily restrict their use of shared resources toward achieving a collective goal. In the absence of strong regulatory bodies, resource users typically coordinate their activities through the creation of new institutions in which the members commit to collectively managing their resources. Over the past two decades, theoretical research has explored the formation of such institutions through the concept of a self-enforcing coalition. The self-enforcing coalition is one in which no member wants to leave (internal stability) and no non-member wants to join (external stability). A self enforcing coalition is profitable in the sense that members earn higher payoffs within a coalition than without one. However, free-riding nonmembers are materially better off than members. For this reason, the formation of profitable coalitions may be sensitive to other-regarding preferences. In this paper, we specifically explore how inequality averse individuals can prevent profitable but inequitable coalitions from forming.
We have introduced a theoretical model of coalition formation to provide a public good when some players are averse to payoff inequality. We demonstrate that such players may block profitable coalitions because they feel disutility from being in a coalition and earning less than free-riding non-members. Moreover, we identify two opposing effects of increasing the payoff gap between coalition members and non-members on the likelihood of coalitions forming. One is a direct payoff inequality effect, while the other is an indirect participation threshold effect. The theoretical model suggests that increasing the payoff gap between members and non-members and holding the participation threshold constant should lead to lower coalition formation rates, while increasing the threshold and holding the payoff gap constant should lead to higher coalition formation rates. The overall effect of increasing the payoff gap depends on the parameters of the problem. We then test for these effects with a series of economic experiments, the results of which broadly support our hypotheses although not entirely. Given the parameters of our experiments, we expected that the overall effect of increasing the payoff gap between coalition members and non-members is to reduce the coalition formation rate, which is what occurs in our experiments. We also find strong support for the direct payoff gap effect. However, we do not observe higher coalition formation rates with higher participation thresholds, controlling for the payoff gap between coalition members and non-members. We suspect that there is an unspecified coordination effect at work here that offsets the theoretical threshold effect.
Our research contributes to the broad literature on endogenous institution formation to provide public goods. While others have shown theoretically that social preferences can affect the size of equilibrium coalitions, ours is the first empirical test of how varying the level of payoff inequality between members and non-members influences the likelihood of a profitable coalition forming. Although experiments necessarily oversimplify the relationship between resource users in a strategic environment, the method offers a way to evaluate the impact of specific policy components in a controlled environment. The experimental approach complements the theoretical analysis by testing its predictions and by highlighting the importance of behavioral elements that might not be present in the theory.
Our results have implications for the design of effective institutions to provide public goods in the absence of a strong regulatory body. The findings suggest that profitability is a necessary but insufficient condition for coalitions to form to increase the provision of a public good beyond business as usual. We show that preferences toward equitable payoffs can prevent agreements from forming even when they are materially beneficial. In the context of climate change — where equity concerns are forefront in negotiations — the results suggest that agreements should be designed with such behavioral elements in mind. Indeed, when the United States formally withdrew from the Paris Climate Accord in June of 2017, President Trump pointed to inequity in burden sharing as a primary reason when stating: “But the bottom line is that the Paris Accord is very unfair, at the highest level, to the United States.” Given our findings, it may be wise to design agreements that reach beyond the profitability requirement in order to account for preferences for equity and fairness. In addition, although we do not model financial transfers in our analysis, our results highlight the important role they might play within voluntary institutions. Financial transfers could be utilized to satisfy both profitability and equity constraints in order to foster cooperation through coalition formation.
The two new treatments were conducted using a different laboratory and subject pool compared with those in McEvoy (2010) and McEvoy et al. (2011). Given the neutral context and language used in the experiments and that the subject pools were similar (i.e.,undergraduates at 4-year public institutions in the United States), we do not expect any systematic differences in behavior between the two different student populations. However, we acknowledge that our experimental design does not allow us to isolate any institution-specific or time effects, which could potentially confound treatment effects.
Van de Kragt et al. (1983) and Dawes et al. (1986) report results from public good games with a “minimum contributing set” (MCS), where the MCS is defined as the smallest number of contributors required for a public good to be provided. Players make binary, all-or-nothing decisions whether to contribute $5 to a public account, or to keep the $5. Both studies examine groups of seven and compare results when the MCS is set to three or five. In both studies, the percentage of times the public good is provided decreases when the MCS increases from three to five. Both studies also report no significant effect of including a money-back-guarantee (i.e.,contributions are returned if the MCS is not met) on individual contributions. One notable difference between the threshold in these early studies and the one in ours is that in their design any contributions in excess of the MCS are wasted, while in our experiments, the provision of the public good is linear in the number of contributors.
Vogt (2016) analyzes the effect of inequality aversion on coalition stability using simulations. The paper uses inequality aversion parameter estimates from Fehr and Schmidt (1999) and marginal benefit and cost estimates from the RICE model (Nordhaus, 2011). The estimates are then used to check the stability of all 4096 possible coalitions that can be formed by the 12 global regions in the RICE model. The study finds that no stable coalitions exist for the range of inequality aversion parameters considered.
See McEvoy (2010) for experimental analysis of the timing of decisions in this game.
There are a handful of experimental papers that explore coalition formation rates in public good games when members maximize their collective payoffs, including McEvoy (2010), McEvoy et al. (2011), Dannenberg (2012), and Dannenberg et al. (2014). These papers do not explicitly explore inequality-averse preferences.
Earnings are reported in experimental dollars and 10 experimental dollars exchanged for one US dollar. Subjects also earned an additional $5 for showing up on time.
The non-integer parameter value of 15.10 was chosen so that the minimum sized profitable coalition (from Eq. (4)) would be six players while also making sure that a member of a six-player coalition is financially better off compared with when no agreement forms. This is achieved because the difference between 6 and 5.03 is large enough to make membership rewarding (a member of a six-player coalition earns $10.9 compared with $8 without an agreement). To simplify the experiments, the payoffs were rounded to integer values.
McEvoy et al. (2011) analyzed T1 and T2 in a study that examined how internal enforcement of compliance with agreement requirements affects coalition formation and performance. T1 and T2 were used as treatments with high and low costs of joining an agreement when perfect enforcement of agreement member requirements was guaranteed. The outcomes of these treatments were compared with other treatments in which agreement members had to invest in enforcing agreement provisions. McEvoy (2010) used T1 and T2 to investigate hypotheses concerning the sequencing of decisions to join a coalition that provides public goods with the two different levels of the costs of joining an agreement. Hypotheses 1 in this study, which states that coalition formation rates are higher under T1 than under T2, was not examined in the previous two papers.
In order to limit the length of time for each period, subjects had 60 s to make a decision. However, if someone made a decision in the last 5 s of the experiment and others were still undecided, an additional 5 s was added to the clock. If someone failed to decide before the time was up, she chose to not join the agreement by default (less than 5% of decisions were made by letting the clock run out). This feature was clearly explained to participants in their instructions.
The session dummies for each treatment are insignificant, but we reject the joint hypothesis (Wald Test, p = 0.001) that there are no period-level effects. Examining each treatment individually, we observe a negative and significant time trend for treatments T2 and T3, but observe no significant time trends for treatments T1 and T4. The results are from treatment-specific linear regressions where whether a coalition formed or not is regressed on a period variable (controlling for session). We find p = 0.003 and p = 0.001, for T2 and T3, respectively, and p = 0.475 and p = 0.597, for T1 and T4, respectively. The results are robust to probit and logit specifications as well.
The coefficient estimate for T4 in Table 8 is significant at the 5% level in the linear probability model but only significant at the 10% level under the logit and probit specifications.

