


The purpose of this paper is to examine changes in disorder and fear of crime in a disadvantaged neighbourhood following the implementation of a Business Improvement District (BID) organisation, a collaborative initiative designated to improve a defined geographical area.
A mixed-method design was used. The quantitative data was collected through an annual community survey with four pre-implementation and five post-implementation waves. Also a comparison area was included. The qualitative data was comprised of interviews with key informants in the community, which were completed before the organisation commenced its work and then again six years later.
Survey results revealed a reduction in disorder and fear of crime. This trend, albeit smaller, could be seen in the comparison area as well. Key informants further corroborated the reduction in disorder and fear of crime, attributing many of the neighbourhood changes to the organisation’s work.
This study is the first to evaluate whether BIDs can affect perceived disorder and fear of crime, relevant factors affecting crime levels and community well-being. Furthermore, it illustrates the benefits of using a comprehensive study design suitable for accounting for changes in a setting where it is difficult to isolate effects.
Introduction
Business Improvement Districts (BIDs) initially started as a model for urban revitalisation and have since expanded to include crime-preventive objectives (e.g. Reenstra-Bryant, 2010). While previous research has explored the impact of BID initiatives on crime rates and often concluded that these rates also apply to disorder and fear of crime, to the best of our knowledge, no prior research exists that assessed the impact of BID on perceived disorder and fear of crime. We revisit a previous quasi-experimental study that explored the effects of a BID organisation on crime rates in an urban disadvantaged area in Sweden (Kronkvist and Ivert, 2020). Using a mixed-method approach, we aim to extend the results by examining the development of perceived disorder and fear of crime by combining data from a pre-post community survey design and pre-post interviews with key informants to examine the development of these factors following the implementation of BID.
Business Improvement Districts: theory and evidence
The BID model can be seen as an organisational structure between local property owners and business partners who collaborate to improve a designated geographical area. The initial focus of BIDs was to rejuvenate commercial areas to attract visitors, but it has since been extended to improve residential areas. Lately, BIDs are typically considered to either focus on town centre management or on improving disadvantaged neighbourhoods, known as neighbourhood BIDs (NBIDs) [1] (Kusevski et al., 2023). Traditionally, BIDs are established through legislation, with mandatory membership and associated fees for private actors within the area. In contrast, in countries such as Sweden, BIDs are run as non-profit organisations with voluntary membership, though they still require a membership fee. In Sweden, this voluntary approach is considered a type of public-private partnership aimed at improving specific areas (Swedish National Council for Crime Prevention, 2022). A key aspect of BIDs is ensuring that the designated geographical area appears “clean and safe”. Emphasis is placed on maintenance and security efforts, following the logic that a well-kept physical environment makes people feel safer, and some BIDs depart from the “disorder approach”, where the removal of visual disorder in an area is believed to reduce crime and fear of crime (e.g. Hoyt, 2005; Vindevogel, 2005). Visible signs of disorder in disadvantaged neighbourhoods signal disorganisation and are linked to higher crime levels and greater fear of crime (e.g. Wilson and Kelling, 1982; Skogan, 1986; Sampson and Raudenbush, 2004; Brunton-Smith and Sturgis, 2011). Meanwhile, a perceived disorder in the local environment can lead residents to believe that an area is in decline and unable to control deviant behaviour, resulting in withdrawal from the public space (Skogan, 1986). By reducing disorder in the physical environment and making it clean and safe, residents should feel less fearful, thus maintaining social control in the neighbourhood. Based on the disorder approach, it would be reasonable to assume that BIDs working to remove visible signs of decay in the neighbourhood could influence perceived disorder and fear of crime.
The empirical evidence on BIDs’ effects on crime rates is somewhat inconsistent. In a recent review by Moir et al. (2024), BIDs seem to have an overall positive effect on crimes, mainly regarding property crime, whereas the effect of violent crime is less clear. In the USA, some studies show a reduction in violent crime and property crimes such as burglary (e.g. MacDonald et al., 2010; Cook and MacDonald, 2011; Hoyt, 2005). Other results suggest a novelty effect, where levels of nuisance crime initially decrease, but the effect is no longer significant after five years (Han et al., 2017). Additionally, some evidence indicates that the formation of a BID can actually increase robberies by acting as a crime generator and consequently increase the number of opportunities for crime (e.g. Clutter et al., 2019). In the UK, many property owners found that while commercial districts with BIDs have higher crime levels, crime levels are significantly reduced after BID implementation, seemingly moderated by the amount of crime preventive efforts taken by the organisations (Faggio, 2022).
The quasi-experimental study, on which the current study builds, evaluated an NBID, which showed a significant reduction in property crimes relative to comparison areas, with the decrease in property crime mainly driven by a reduction in vandalism (Kronkvist and Ivert, 2020). There was also an indication that the decrease in property crime was evident before the organisation commenced, making it difficult to isolate the effects of the BID. Furthermore, there was no significant reduction in violent public crimes after implementation; however, the small number of crimes limits interpretation. Also, in a Swedish setting, Daunfeldt et al. (2023) assessed the effects of voluntary BIDs on crime levels in five smaller cities and found no significant reduction in crime rates. Daunfeldt et al. (2023) also emphasised the low number of observed crimes, making it difficult to draw accurate conclusions.
Fear of crime
Hale (1996) summarised fear of crime as an individual’s negative feelings inflicted by crime, which include affective, cognitive, and behavioural components (Jackson and Gouseti, 2014). While crime prevention strategies traditionally focus on reducing actual crime rates, there is also an acknowledgement that addressing fear of crime is important (Ekblom and Pease, 1995) and that crime and fear of crime are interlinked but also two separate problems (Brown and Polk, 1996). In some evaluations, crime is equated with terms such as “urban safety” (Daunfeldt et al., 2023) or “public safety” (Cook and MacDonald, 2011). This is, however, distinctively different from perceived safety; while crime rates indicate the known level of crime, perceived safety instead captures the cognitive component of fear of crime (Hale, 1996). It is well established that fear of crime can significantly impact residents’ lives, leading to anxiety and behavioural changes such as avoiding specific areas, restricting daily activities, and fortifying one’s home (Hale, 1996). Furthermore, fear of crime is a widespread concern, impacting a larger number of individuals than actual victimisation (Lane, 2015). If BIDs can reduce fear of crime through their initiatives, this would underscore the importance of BIDs in improving residents’ sense of safety, well-being, and overall quality of life. However, there is a gap in the literature assessing changes in BID initiatives on the perceived disorder and fear of crime in disadvantaged neighbourhoods.
Intervention neighbourhood; BID Sofielund
The neighbourhood in focus for the current study is Sofielund, a small central neighbourhood in Malmö, Sweden, the third largest city with approximately 350,000 inhabitants. Sofielund, with a population of around 4500 people, has lower incomes, higher unemployment rates, and a higher proportion of foreign-born residents compared to the overall Malmö population [2]. Sofielund has been subjected to national and local initiatives for decades because of high levels of crime and disorder in the area. In 2015, the Swedish Police Authority labelled Sofielund “a particularly vulnerable neighbourhood”; neighbourhoods characterised, among other factors, by high criminal concentration and an unwillingness for residents to participate in legal processes, which makes it difficult for the police to operate fully in the area (Swedish Police Authority, 2015).
From 2010 to 2015, Sofielund was part of a municipality neighbourhood development project. Towards the end of the project, some local private property owners, together with the municipality, took inspiration from other BID models and decided to form BID Sofielund. In BID Sofielund, the board of directors is mainly property owners, and police and municipal representatives have been invited as active board members. Paying members of the organisation are local property owners, businesses and organisations, and membership is voluntary and roughly consists of thirty-five members.
The organisation arranged various activities throughout the years but focused on improving the physical environment. A snapshot of these activities includes starting a cleaning patrol, painting murals on buildings, collaborating with the police to install surveillance cameras, conducting safety walks in the neighbourhood, and hosting social events at the community square.
The current study
The current study examines changes in perceived disorder and fear of crime following the implementation of the NBID-inspired property owner organisation BID Sofielund. Using a community survey, we evaluate changes in neighbourhood-level disorder and fear of crime for four years before the BID started compared to five years after. Changes in the intervention area will be compared to changes in a comparison area undergoing other crime preventive efforts.
Additionally, we will analyse interviews with key informants from the community before and after the implementation to explore their perception of disorder and fear of crime in Sofielund. These interviews contextualise the survey findings and provide insights into possible reasons behind any potential outcome change (Onwuegbuzie and Hitchcock, 2017; Heap, 2019). The combination of the survey data with key informant interviews is used for complementarity and a comprehensive understanding of the studied outcomes (Heap, 2019).
Method
Overall study design
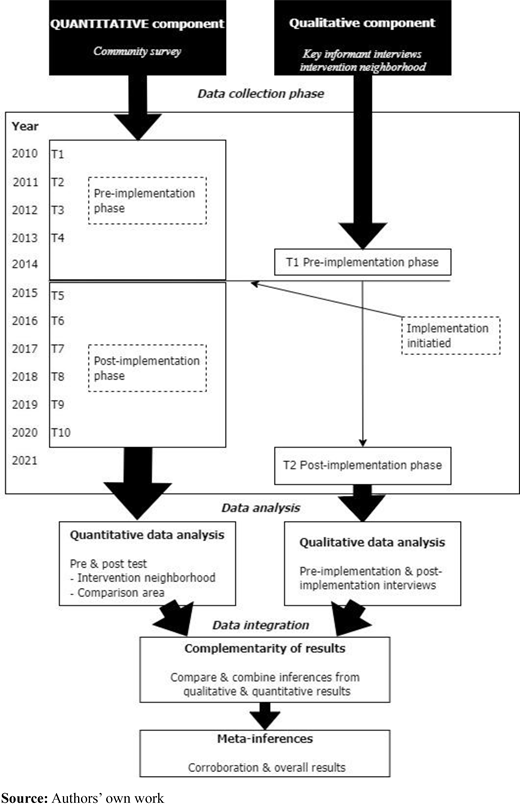
The current study opted for mixed methods and a convergent parallel design (Heap, 2019). We use a pre–post survey design with a comparison area for the quantitative component. BID Sofielund began its activities in 2015, and at the time of writing, the organisation is still active in the neighbourhood. The quantitative data spans from 2010 to 2020 [3]; the period ranging from 2010 to 2013 is considered the pre-implementation period, and the period from 2015 to 2020 is considered the post-implementation period.
The comparison area consists of three disadvantaged neighbourhoods, which we will now refer to as the “comparison area”. These neighbourhoods were chosen to act as comparison areas because these neighbourhoods have, together with the intervention neighbourhood, been subjected to the same five-year municipality neighbourhood development project during 2010–2015. The municipality chose the neighbourhoods because the residents’ welfare was the lowest in the city [4]. During the municipal project, the intervention neighbourhood and the other three neighbourhoods received financial resources, and certain activities were implemented in the different neighbourhoods. The activities varied across neighbourhoods and were tailored to specific needs (only the intervention neighbourhood had BID). After the municipal program ended, some activities remained in the three neighbourhoods, and this comparison area can, therefore, be seen as receiving “treatment as usual”.
In addition to the comparison area, a city score representing Malmö will be used descriptively for the levels of disorder and fear of crime as an overall city trend over a ten-year period. This city score excludes the intervention neighbourhood and comparison area and is comprised of the remaining neighbourhoods in the city [5].
The qualitative component consists of interviews conducted in 2014 (pre-implementation) and 2021 (post-implementation). The qualitative and quantitative data collections were done independently of each other, and the data were combined during the stage of interpreting the results; see Figure 1 for an illustration of the design.
The quantitative data: a community survey
The Swedish Police Authority administered a repeated cross-sectional community survey with a stratified randomised sample of 7000 residents, aged 16–85, in Malmö each year during 2010–2020. The sample was stratified based on zip codes that closely resemble the neighbourhood structures that the municipality uses, and each neighbourhood sampled 300 residents. The intervention neighbourhood had, on average, 134 answers per wave (45% response frequency over the years) and 480 answers in the comparison area (53%).
Disorder was measured separately as “physical” and “social” disorder. Although physical and social disorder are often combined into an index, some research suggests there is a point in analysing these subscales separately (Kuen et al., 2022). “Physical disorder” was assessed by a total score index with five items: littering, vandalism, traffic issues, houses occupied by people intoxicated by alcohol and narcotics. “Social disorder” was also assessed with five items: observing people intoxicated with alcohol and narcotics, people fighting, women being harassed, and youth gangs disrupting the order. The range was 0–3; response alternatives were as follows: “does not happen”, “happens but is not an issue”, “small problem” and “large problem”. High levels on the scale indicated high levels of disorder. Internal reliability analysis yielded an average Cronbach’s alpha value of 0.92 for social and 0.82 for physical disorder over the time points.
Fear of crime was assessed by two dimensions: affective and cognitive. The cognitive dimension of “fear of crime” measured unsafety and builds on two questions: “If you go out alone in the evening in your neighbourhood, do you feel safe or unsafe?” and “Are there any specific people in your neighbourhood that you are afraid of?”. The response alternatives were dichotomised to “safe”, “unsafe”, “no” and “yes, one or more”. These variables were aggregated to the neighbourhood level to assess proportion changes pre- and post-implementation.
The affective component measured residents’ emotions regarding worry about being victims of specific crime types in their neighbourhood. “Worry about property crime” was measured using a mean score index of three items, asking if the residents were worried about residential burglary, burglary in storage units, and vehicle theft. “Worry about physical assault” was measured with one item. Response alternatives were “no, has not happened”, “yes, but only seldomly”, “yes, fairly often” and “yes, very often”, with a scale from 0 to 3 where high levels were indicative of high levels of fear of crime (mean Cronbach’s alpha for worry about property crime: 0.81).
The independent variables were “time” (pre and post) and “area” (intervention neighbourhood and comparison area).
The qualitative data: key informant interviews
Ten semi-structured interviews with key informants were conducted in 2014, and purposeful sampling was used. Participants were selected from local government entities and local services such as municipality workers representing the school, social work and traffic department, police and fire department, and local non-governmental organisation (NGO) representatives. These representatives were deemed to have enough knowledge to assess the “social climate” in the neighbourhood and act as key informants with local expertise in the community (Hardyns et al., 2023). The focus of the interviews was to map the current situation in the neighbourhood concerning disorder and fear of crime.
In 2021, ten additional interviews were conducted with a new sample of key informants, and the participants were contacted via a gatekeeper in the organisation. This sample included representatives from police, local NGOs, and municipal and private property owners. During the interviews in 2021, the focus was on changes in the neighbourhood, along with questions concerning cooperation between entities.
Analytical strategy
The survey data were analysed using SPSS (29). A multivariate analysis of variance (MANOVA) model evaluated changes in the continuous variables: physical and social disorder and worry about crime. After that, separate chi-square tests for independence were conducted for the two categorical variables measuring unsafety. Analyses were performed separately for the intervention neighbourhood and the comparison area. This strategy was deemed a reasonable choice because no clear differences between the intervention neighbourhood and comparison area were present during the period before implementation in preliminary analyses [6]. The MANOVA and chi-square tests enabled the capture of changes in the outcome variables within the intervention neighbourhood and comparison area and before and after implementation.
The interviews were analysed using thematic analysis with a deductive approach. The results from pre-implementation (2014) and post-implementation (2021) were analysed separately and then merged afterwards by comparing predefined themes. The merging of quantitative and qualitative data was done after the separate analyses had been completed. The data was inserted in a joint display table to assess corroboration and convergence between the studied outcomes (Guetterman et al., 2015).
Results
Disorder: findings from the community survey
The community survey results indicate a positive change in disorder within the intervention neighbourhood. The MANOVA analysis showed a statistically significant difference between pre- and post-implementation scores for the studied outcomes, including physical and social disorder (F(4, 1133) = 10.56, p < 0.001, Wilks’ Lambda = 0.964). Post hoc tests showed that both social and physical disorder reached statistical significance using a Bonferroni adjusted alpha level of 0.012 (p < 0.001, respectively p < 0.001).
A duplication of the analysis was conducted for the comparison area, showing similar changes in disorder (F(4, 3546) = 10.62, p < 0.001, Wilks’ Lambda = 0.918). This indicates reductions in physical and social disorder (p < 0.001, respectively p < 0.001).
Comparing changes between the intervention neighbourhood and the comparison area, both physical and social disorders were significantly reduced in both areas. Mean value changes (see Table 1) indicate a larger reduction in the intervention neighbourhood compared to the comparison area; physical disorder decreased by a mean value change of −1.38 pre- to post-implementation, while the comparison area had a mean value change of −0.66. Similarly, for social disorder, the intervention neighbourhood had a mean value change of −1.53, compared to −0.86 in the comparison area.
Descriptive statistics for disorder and fear of crime
| Intervention neigbourhood | Comparison area | City comparison | |||||||
|---|---|---|---|---|---|---|---|---|---|
| Pre | Post | Pre | Post | Pre | Post | ||||
| Outcome variable | M(SD) | M(SD) | Mean value change | M(SD) | M(SD) | Mean value change | M(SD) | M(SD) | Mean value change |
| Physical disorder | 7.93 (3.84) | 6.55 (3.73) | −1.38 | 6.32 (3.90) | 5.66 (3.87) | −0.66 | 4.46 (3.04) | 4.58 (3.09) | +0.12 |
| Social disorder | 6.85 (4.39) | 5.32 (4.09) | −1.53 | 5.56 (4.30) | 4.70 (4.38) | −0.86 | 3.05 (3.48) | 3.08 (3.56) | +0.03 |
| Unsafe at night (proportion) | 59% | 46% | −13% | 53% | 50% | −3% | 33% | 35% | +2% |
| Fearful of people (proportion) | 27% | 20% | −7% | 22% | 19% | −3% | 11% | 12% | +1% |
| Worry about property crimes | 1.20 (0.92) | 1.02 (0.89) | −0.18 | 1.23 (0.99) | 1.05 (0.99) | −0.18 | 0.83 (0.79) | 0.89 (0.83) | +0.06 |
| Worry about physical assault | 1.08 (1.06) | 0.85 (1.04) | −0.23 | 0.98 (1.12) | 0.83 (1.06) | −0.15 | 0.53 (0.82) | 0.58 (0.86) | +0.05 |
In comparison to the overall city trend, the descriptive analysis indicates a slight increase in disorder during post-implementation across the city (see Table 1). This increase is relatively small, yet indicating a less favourable trend in disorder compared to the intervention and comparison areas. It also reveals a large difference between the intervention neighbourhood and comparison area in terms of levels of disorder. These areas have much larger mean values compared to the overall city score. The intervention neighbourhood’s post-score is similar to the comparison’s pre-score.
Disorder: reflections from key informants
The key informant interviews showed that the major problems in 2014 regarding physical disorder were reckless traffic, rundown buildings that property owners poorly managed, and littering. For traffic-related issues in 2014, a police officer mentioned:
There is crazy traffic with cars, it is loud, it’s perceived as unsafe too. And it is a traffic hazard, if nothing else. One is afraid to walk around because of [the traffic].
In 2021, however, the key informants stated that because of the work of BID Sofielund, reckless driving had been greatly improved by installing traffic barriers in joint collaboration with the municipality. Also, a “drug drive-thru” was removed by creating traffic barriers so it was no longer possible to drive in and out of the neighbourhood by car to buy drugs. Also, thanks to the organisation, the poorly managed properties were restored after a heavy push from BID Sofielund, via, e.g. articles in local media highlighting the issues and putting pressure on the municipality to fine the property owners. Several key informants mentioned that the rundown buildings were now in much better condition and that there were no more comments regarding shattered windows as there were in 2014. Another example concerning the physical environment that was attributed to the organisation was BID Sofielund encouragement to residents and property owners to report graffiti immediately to make sure it was removed swiftly. The interviews in 2021 also showed that many property owners had made efforts to reduce criminogenic places, such as cutting down bushes, putting up fences, increasing lighting and improving door locks. Furthermore, during the organisation’s early work, BID Sofielund formed a cleaning patrol in the neighbourhood in collaboration with the municipality to improve the appearance and cleanliness of the neighbourhood. The cleaning patrol quickly removed litter and any minor vandalism to reduce the physical disorder and was still active in the neighbourhood during the interviews in 2021. Although some littering still occurred, according to one of the property owners, the neighbourhood appeared more “calm and clean”.
For social disorder, the most prominent issue in 2014, according to key informants, was loitering youth and open drug scenes in the neighbourhood, along with people being intoxicated by narcotics. The issue of youth loitering was discussed in terms of cultural differences in socialising because many families lived in overcrowded living conditions and, consequently, youth had no choice but to spend time outside. During the interviews in 2021, there was no mention of overcrowding. Instead, there were concerns about gentrification and pushing certain groups out because of the positive changes in the neighbourhood. When the irresponsible property managers vacated the buildings, one key informant stated:
The disorder and social hardship left with them.
Furthermore, other comments implied a change in the neighbourhood after implementing BID. One of the local NGO’s noted:
There is a before BID and after BID in Sofielund.
At the same time, the representative acknowledged that neighbourhood change takes time, and if all invested resources are removed too quickly, the fragile neighbourhood can easily “slip back” again. Other key informants representing the municipality and property owners with properties throughout the city also mentioned that there was a difficult balance between continuing the work in the neighbourhood and prioritising resources for other parts of the city.
Regarding open drug sales in the neighbourhood, two types of answers appeared in the interviews in 2021. The first one was that the open drug scenes had either moved or reduced significantly, although a few were still present. This answer came from representatives working closely related to narcotic questions, such as the police and the property owners who had problems with drug sales in their buildings. The other type was that there were no comments about issues with open drug scenes, implying the key informants did not perceive a problem with this. Beyond what has been previously mentioned, no other types of disorder appeared problematic during the interviews in 2021.
Fear of crime: findings from the community survey
The community survey results indicate positive changes in fear of crime within the intervention neighbourhood. Analysis of “feelings of unsafe at night”, using a chi-square test, revealed a significant reduction in the proportion of unsafe residents post-implementation (χ2(1, n = 1511) = 25.2, p < 0.001, phi = −0.13). Similarly, “fearful of certain individuals” also showed a lower proportion post-implementation (χ2(1, n = 1504) = 11.1, p < 0.001, phi = −0.09). The changes in proportion can be found in Table 1.
Regarding the dimension measuring worry, the MANOVA analysis for the intervention neighbourhood showed a statistically significant difference between pre- and post-implementation for “worry about property crime” and “worry about physical assault” (F(4, 1133) = 10.56, p < 0.001, Wilks’ Lambda = 0.964). Post-hoc tests show that both “worry about property crime” and “worry about physical assault” reached statistical significance (p < 0.001, respectively, p < 0.001).
The comparison area showed a similar change in fear of crime, with significant reductions observed post-implementation. Specifically, there was a significant decrease in the proportion of feeling “unsafe at night” (χ2(1, n = 5212) = 5.24, p = 0.02, phi = −0.03), and “fearful of certain individuals” (χ2(1, n = 5161) = 7.15, p = 0.008, phi = −0.04). Both “worry about property crime” and “worry about assault” showed statistically significant reductions (F(4, 3546) = 10.62, p < 0.001, Wilks’ Lambda = 0.918) also with post hoc test (p < 0.001, respectively, p < 0.001).
As shown in Table 1, the intervention neighbourhood and comparison area had lower levels of fear of crime post-implementation. When inspecting the mean value changes, however, it appears that the change is larger in the intervention neighbourhood compared to the comparison area regarding unsafety. The overall city trend instead slightly increased in fear of crime during post-implementation. The small increase signals a negative city trend for fear of crime. Furthermore, the mean values and proportions for the intervention neighbourhood and comparison area are larger than the overall city score.
Fear of crime: reflections from key informants
Concerning the qualitative results on changes in fear of crime, most of the key informants reported in 2014 that they generally felt safe in their professional role working in the neighbourhood. This was discussed in terms of what time they spent there, which was mostly during the day, which might contribute to the feelings of safety. A few of the key informants stated, however, that they had been name-called by young men loitering in the neighbourhood, and a community police officer and a municipal parking worker reported that they had been exposed to rock throwing several times. The police officer said that several police cars had been vandalised when they had been dispatched to the neighbourhood. During the interviews in 2021, none of the key informants raised professional safety concerns regarding spending time in the neighbourhood. In 2021, there was a difference in perceived safety, at least for the police. One of the police officers said:
The effects have been great. Just look around the neighbourhood. Just drive, park the car, walk around, and talk to the residents.
In 2014, when it comes to the residents’ fear of crime, the key informants reported that their overall perception of the residents’ fear of crime was that they felt safe. However, there was a concern about altruistic worry, where residents voiced concerns about their family members being exposed to crime. For example, during the time of the interviews, a grenade had recently detonated in the neighbourhood, which the key informants believed could impact the residents’ perception of safety. During the interviews in 2021, the key informants did not mention any major negative events in the neighbourhood. When asked about any developments in the intervention neighbourhood since they had started to work there, several of the key informants referred to a reduction in fear of crime among residents, and they spoke about the decrease in general terms where “fear of crime has gone down”. Neither of the key informants in 2021 raised any comments concerning altruistic worry among the residents. Some key informants were saying that the neighbourhood had changed, and one of the local NGO representatives stated:
The atmosphere is different […] the residents have reclaimed the neighbourhood.
Additionally, in both 2014 and 2021, the key informants mentioned the ambivalent effect of police presence in the neighbourhood. During the early years of BID Sofielund, there was a high police presence to combat problems in the neighbourhood. Also, after the neighbourhood was categorised as “a particularly vulnerable area” by the Swedish Police Authority, more police resources could be directed to the area. According to the key informants, this could be seen as a way to increase feelings of safety, that the neighbourhood is not left alone, and that it is positive to have visible police patrolling the streets for safety-enhancing work. The other side, however, is that the increase in police presence might result in more fear of crime because it signals that it is an area in need of support from law enforcement. As one of the key informants representing the domestic services for the municipality said in 2014:
The residents have mentioned, ‘Why are the police here?’ […] ‘Why are there so many police?’
Moreover, several key informants mentioned during the interviews in 2014 that a small group of active offenders was present and residing in the neighbourhood. The signs of social disorder discussed previously, such as youths loitering, name-calling, throwing rocks and disturbing the public order, were highlighted as major contributing factors to feelings of unsafety in 2014. In the interviews in 2021, several key informants raised the idea that this group of individuals was almost completely gone. A community police officer also highlighted that recruitment to criminal activities was negligible in the neighbourhood at the moment of the interview. The police also raised a more nuanced perspective and said that even though the neighbourhood had improved greatly over the last few years, there is still a long way to go, and changing criminal organisations and structures takes time.
Merging of quantitative and qualitative data
The results suggest that both types of data show congruent results: disorder and fear of crime have decreased in the intervention neighbourhood. In regard to the community survey, both social and physical disorders were reduced in the five-year period after the organisation was implemented compared to the period before, along with improvements in all four measures of fear of crime. The interviews with key informants further corroborated this reduction in disorder and fear of crime.
Discussion
The current study extends the results from a previous evaluation of BID Sofielund that assessed crime rates by examining changes in perceived disorder and fear of crime (Kronkvist and Ivert, 2020). Applying a mixed-method approach, we tested a previously assumed theoretical link between BID and disorder and fear of crime and found both of these factors were reduced among the residents in the intervention neighbourhood post-implementation.
In line with theory and previous research on disadvantaged neighbourhoods and disorder (e.g. Sampson and Raudenbush, 2004), we found that the residents in the intervention neighbourhood perceived high levels of disorder. In the current study, perceptions of physical disorder among residents have reduced significantly post-BID implementation. This is supported by the key informant’s statements of the activities that BID organised and focused on, such as implementing the cleaning patrol and pushing for property owners to renovate slum properties. This is conceptually linked to the “disorder approach” and the theoretical ground many BIDs depart from, where disorder removal is believed to reduce crime and, by extension, fear of crime (Vindevogel, 2005). Also, social disorder was reduced in the post-implementation period. For the positive change in social disorder, one explanation offered by the key informants was the reduction of open drug scenes and the removal of the small group of active offenders in the neighbourhood. While it is unclear from the interviews if the youth loitering and all the criminal offenders belonged to the same group, the neighbourhood had fewer people disrupting the public order during the post-implementation period.
If the activities of the BID organisation might be a factor in reducing disorder, it is still important to acknowledge which type of issues BID models can feasibly impact – BIDs cannot, per se, remove offenders in the neighbourhood because this is out of their scope of jurisdiction. The organisation can, however, be useful in disseminating the responsibility to maintain order and safety in society (D’Souza, 2020). In line with this, Linning and Eck (2021) also point out that property owners and business owners can exercise social control, which is important in sustaining an organised neighbourhood. Indeed, the organisation collaborated with the municipality and police on issues such as reporting graffiti, which can be considered a sort of semi-formal control function in the neighbourhood. Another noteworthy point regarding the impact of BIDs is that it might not be reasonable to assume that BIDs can improve the structural characteristics of a neighbourhood on their own, such as improving living conditions. Hence, the youth loitering in the neighbourhood because of overcrowding might be more of a larger structural issue. However, one contributing factor to the positive changes might be the close partnership BID Sofielund had with the police, as cooperation between private and public entities can be beneficial as collective action to resolve issues that neither entity can achieve on their own (Grossman, 2012). Furthermore, what does seem to be in the realm of possibilities for a BID to impact is the level of investment in crime prevention. BIDs that spend more resources appear to achieve greater effects (Faggio, 2022), and the organisation had a clear aim to reduce crime and disorder and increase feelings of safety, so they allocated plenty of resources for these activities.
Regarding fear of crime, the results from the community survey indicated that the intervention neighbourhood had a much higher level of fear of crime compared to the overall city value. This is consistent with previous research on fear of crime in disadvantaged neighbourhoods (e.g. Brunton-Smith and Sturgis, 2011). Additionally, we found changes in cognitive and affective dimensions of fear of crime; both “unsafety” and “worry about crime” were reduced post-implementation in the intervention neighbourhood. For “unsafety of walking alone at night” and “fearful of certain individuals”, the survey results revealed a large decrease, and this trend was not as evident in the comparison area. As previously mentioned, in 2021, the key informants reported that the small group of offenders that were active during the BID’s early years were no longer present in the neighbourhood, which could be why the proportion was so much lower during the post-implementation period. It is, however, difficult to establish if this was because of some of the activities the BID implemented, such as having an active dialogue with the police, or if it is actually a result of police work apprehending these offenders.
Moreover, post-implementation, there were lower levels of “worry about property crime” and “worry about physical assault” in the intervention neighbourhood. The property owners interviewed during the post-implementation period reported that, via joint work with the organisation, they had spent considerable effort on improving security features such as changing locks and making physical improvements. With the current study design, we cannot conclude that this activity from the organisation was directly linked to the reduction in the worry about crime among the residents because fear of crime is largely considered a subjective feeling (Hale, 1996). We can, however, say that the residents’ perceived fear of crime assessed by the community survey gives an important indicator: both as a representation of changes in neighbourhood-level fear of crime over time and also bears a socially significant outcome to the residents in the neighbourhood.
Methodological discussion
One challenge in evaluating BIDs is the several stakeholders involved, and as a result, several indicators of success often need to be assessed (Ferguson, 2023). Because BIDs can be considered a tool where the activities should be customised to meet local demands (see, e.g. Reenstra-Bryant, 2010), generalisability will remain a persistent concern. More so, isolating effects and attributing change to the results of an intervention is a challenge, which makes it difficult to identify which activity carried out by the organisation had the greatest effect (Ferguson, 2023). In an attempt to address these issues, we assessed both quantitative and qualitative data for a full exploration of the studied outcomes. Nonetheless, this design has limitations. With the quasi-experimental design in the current study, the neighbourhoods studied were not randomised, which may have affected the study results. Moreover, the comparison area was found to have a similar development as the intervention neighbourhood, and this means we cannot ascertain the implementation of BID as the reason for the observed change in the intervention neighbourhood with certainty. Neither can we dismiss the positive changes; the implementation was not unsuccessful, but rather similarly effective as receiving treatment as usual, i.e. other crime preventive initiatives. Furthermore, the key informants provided important insights that contextualised the organisation’s activities and processes and why there was a change (Onwuegbuzie and Hitchcock, 2017). On the other hand, to contextualise the results limits the generalisability to other locations. Future research should, therefore, explore if the type of activities by the organisation, the exercise of semi-formal control in the neighbourhood or the voluntary collaborative structure between different entities mainly drive changes in the neighbourhood.
Another limitation of the current study is the non-randomisation of the interview participants. Their view cannot be seen to account for the organisation that they represent fully. For validity reasons, it would also have been better if the same representatives had been interviewed again in 2021. Yet, given the participants’ representation of an organisation, employee turnover is likely to have occurred over the years. Nevertheless, key informant interviews can reliably report on neighbourhood factors such as disorder (Hardyns et al., 2023), so using key informant interviews in the current study further corroborates the survey results that there was a positive change in the intervention neighbourhood.
Conclusion
We explored the effects of an NBID on disorder and fear of crime. We found that the intervention neighbourhood had reduced physical and social disorder levels along with worry about crime and unsafety. Even though it is not possible to rule out other factors that contribute to the development, the key informants in the community suggest that the organisation played an important part in the positive change. The results of the study add important evidence of how BIDs with a “clean and safe” approach might influence disorder and fear of crime, and it also provides practical insights for BIDs in settings with similar issues. Moreover, after the data collection for the current study had been concluded, the Swedish Police Authority moved the intervention neighbourhood from the top category “particular vulnerable area” to a less severe classification (Swedish Police Authority, 2023), which can be viewed as another testament to improvement for the neighbourhood.
Notes
Several definitions exist on residential areas with similar structures: low socioeconomic status, lower educational level, poverty, high population turnover and other unfavourable structural factors.
A demographic analysis showed the population composition did not change in the intervention neighbourhood over the years: there was no major change in income level, educational level or occupational status.
In 2014, there was no data collection due to budget constraints.
The three neighborhoods were not matched by the municipality on demographics or outcome variables. The neighborhoods were combined to one comparison area for simplicity, but all analyses have been conducted on the separate neighborhoods and results remain similar as for the combined comparison area.
Due to data limitations, this group cannot be deconstructed to neighbourhood level.
We considered Difference-in-Difference analysis. Only one out of six outcome variables showed parallel trends ruling out the suitability. That only one out of six variables had parallel trends is not surprising given the different crime preventive activities the comparison neighbourhoods received.
Funding: The research was funded by the Swedish National Council for Crime Prevention.
Ethical approval: The research project received ethical approval from the Swedish Ethical Review Authority (2017/896; 2021-01629).

