This study highlights the impact of environmental, social and governance (ESG) risk levels on the performance of sector-focused mutual funds compared to their corresponding sector Exchange-Traded Funds (ETFs) and examines the differences in the impact of ESG risk levels within sector funds.
Using six-factor model, we conduct a comparative analysis of active sector funds and their corresponding sector ETFs' performance between 2015 and 2023.
We show that empirical results mainly depend on sectors, study period and sustainability strategy. We find that active sector funds fail to beat sector ETFs in general, except for health care and materials sectors. However, our findings reveal that doing better than its sector in sustainability may positively affect active sector funds' performance compared to the corresponding ETFs, especially after the pandemic crisis crash.
We contribute to the literature on sustainable fund performance by combining the analysis of active versus passive asset management with ESG risk levels. Hence, this study highlights the impact of ESG risk levels on the performance of sector-focused mutual funds compared to their corresponding sector ETF and examines the differences in the impact of ESG risk levels within sector funds.
1. Introduction
The rapid development of sustainable finance has generated significant interest among academic researchers and practitioners. Assets incorporating environmental, social and governance (ESG) commitments grew from $6 trillion to $121 trillion globally between 2006 and 2021. Individual investors are becoming increasingly interested in sustainable investments because of the increased availability of ESG funds. Even though most products are actively managed by mutual funds, some sustainable passive investments, such as Exchange-Traded Funds (ETFs) and index funds, have also emerged (Bioy and Lamont, 2018).
The concept of indexing was first introduced to the mutual fund industry in 1976 (Bogle, 2015). Nevertheless, the debate on active versus passive investments has lasted for decades. The value added by active management has been extensively studied in the academic study (Barras et al., 2010; Berk, 2005; Berk and Green, 2004; Cremers and Petajisto, 2009; Fama and French, 2010; Ferson and Chen, 2020; French, 2008; Grinblatt and Titman, 1989; Jensen, 1968).
One investment strategy employed by fund managers is the use of sector funds in both active and passive investment strategies. Although sector funds do not provide the same diversification benefits as other mutual funds, fund managers use this strategy to take advantage of stock selection for market timing decisions (Dellva et al., 2001). Sector equity funds originated as a pillar of the mutual fund industry in the 1930s and 1940s but lost popularity in the 1950s before returning to the investment world in 1981 (Bogle, 2015). Fan and Lin (2020) note that “At the end of 2017, active sector equity funds stood at $424 billion and passive sector equity funds at $488 billion, representing 6.3% of active equity funds and 9.1% of passive equity funds, respectively.” The Investment Company Institute defines sector funds as “funds that invest solely in companies that operate in related fields or specific industries” (Investment Company Institute, 2022 [1]). With a net asset value of $52 billion in 2021, sector funds have shown a growth rate of 20% over the past 21 years.
Many studies have focused on the performance of specific fund samples, such as real estate investment funds (Bond and Mitchell, 2010; Chiang et al., 2008; Elyasiani et al., 2022; Kallberg et al., 2000) , biotechnology and healthcare funds (Chen et al., 2018; Kaushik et al., 2014; Martí-Ballester, 2020), technology funds (Maruti and Shivaji, 2013), energy funds (Martí-Ballester, 2019), and infrastructure funds (Kammoun and Tandja Mbianda, 2020). Other studies focus on comparing sector and non-sector mutual fund performance (Kacperczyk et al., 2005, 2007; Keswani and Stolin, 2006; Khorana and Nelling, 1997; O'Neal, 2000). However, despite the importance of this mutual fund industry segment, only a few studies have analyzed overall sector funds, such as Tiwari and Vijh (2001).
As investors have become more socially and environmentally responsible, sustainable sector funds have grown in popularity. Previous studies highlighted the sensitivity of some industries to ESG factors, namely materials, banking, energy, technology construction, real estate, transport, and infrastructure (Apergis et al., 2022; Ashwin Kumar et al., 2016; Kammoun and Tandja Mbianda, 2023). However, the academic study findings on whether integrating ESG into investment decisions affect financial performance find mixed evidence (Abate et al., 2021; Dolvin et al., 2019; Kammoun and Tandja Mbianda, 2023).
We contribute to the previously mentioned literature by combining the analysis of active versus passive asset management with ESG risk levels. Hence, this study highlights the impact of ESG risk levels on the performance of sector-focused mutual funds compared to their corresponding sector ETF and examines the differences in the impact of ESG risk levels within sector funds. Using the Morningstar Direct Database, we conduct a comparative analysis of active sector funds and their corresponding sector ETFs between 2015 and 2023. These funds belong to one of the 10 major sectors of the economy, which we define as communications, cyclical, domestic energy, domestic real estate, healthcare, industrials, materials, domestic financial, technology, and utilities. We apply the six-factor model of Fama and French (2018) to measure fund performance. We then assume that ESG commitment could affect the performance of some active-sector funds compared to the overall sector. Therefore, we classify each active sector fund into two classes based on the global ESG score of its corresponding sector ETF: (1) high ESG risk sector funds, with scores above those of their peer ETF sectors, and (2) low ESG risk sector funds, with scores below those of their peer ETF sectors. This study aims to focus on the sensitivity of ESG risk levels' impact within different active sector funds. We examine the impact of ESG risk levels on the performance of sector-focused funds compared to their peer sector ETFs.
Our results provide evidence on whether ESG risks are transmitted from companies to funds and identify whether some sectors are the most affected by ESG commitments. These findings could help fund managers avoid investments in sensitive industries that may lead to lower performance and higher fund risk. Additionally, this study offers guidance to investors in choosing between active and passive strategies. Our findings enable them to assess whether it is worth paying more fees for some sector funds or opting to settle for some types of sector ETFs that may outperform some active sector funds.
The remainder of this paper is organized as follows: Section II presents the literature review and hypothesis development. Section III describes the data and methodology used in this study. Section IV presents descriptive statistics, Section V analyzes empirical results, and Section VI concludes.
2. Literature review and hypotheses development
The evaluation of mutual funds has been a long-standing issue in finance. According to the 2022 Investment Company Fact Book [2], there were more than 132,000 mutual funds worldwide by the end of 2021, with net asset values nearly tripling since the start of the new millennium. Mutual funds can either have actively managed portfolios, in which a fund manager selects a unique mix of investments to meet a particular investment objective, or passively managed portfolios that seek to track the performance of a selected benchmark. Since the early studies of Sharpe (1966) and Jensen (1968), financial research has extensively analyzed the performance of mutual funds. Literature on value-added through active management provides mixed evidence. Some studies (Barras et al., 2010; Fama and French, 2010; Ferson and Chen, 2020; French, 2008; Jensen, 1968) conclude that active management does not improve performance compared to passive management, whereas others (Berk, 2005; Berk and Green, 2004; Cremers and Petajisto, 2009; Grinblatt and Titman, 1989) argue that managers' abilities result in superior performance. (Berk, 2005; Berk and Green, 2004; Cremers and Petajisto, 2009; Grinblatt and Titman, 1989) also support evidence of fund managers' selection abilities.
Recently, the passive asset management market has grown significantly due to the increasing popularity of ETFs. The U.S. ETFs industry grow significantly, from total net assets of $66 billion in December 2020 to $7,191 billion in December 2021, compared to a smaller increase for U.S. mutual funds industry, from total net assets of $6,956 billion to $26,964 billion over the same period [3]. Most ETFs replicate a specific index, enabling them to charge lower fees. However, it is important to account for the risks associated with ETFs, such as counterparty risk, trading costs, market risk, closed-out risk, and potential tracking inaccuracies (Hill et al., 2015). Several studies show that ETFs exhibit similar performance (Rompotis, 2005) , underperform (Shin and Soydemir, 2010; Svetina, 2010) or outperform compared to their benchmark (Gastineau, 2004). When comparing ETFs to mutual funds, Farinella and Kubicki (2018) find that ETFs have statistically higher annual return and lower annual fees than mutual funds.
Among various management strategies, mutual fund managers may adopt a sector fund strategy for both actively managed mutual funds and ETFs, to take advantage of general upswings in a specific industry. Because of their specialized investment objectives, these funds have grown in popularity since the 1980s (Dellva et al., 2001). Information asymmetry varies across sectors. Some sectors, such as real estate and technology, may exhibit greater information asymmetry than others. Hence, the superior skills of fund managers may be particularly valuable when stocks are selected in these sectors. For example, Kallberg et al. (2000) found that real estate funds outperform their passive benchmarks by 2% per year. This suggests that it is possible to beat the market by specializing in a particular sector of the stock market. O'Neal (2000) examined the impact of industry-specific aspects of momentum on the mutual fund sector and concluded that high-momentum portfolios perform significantly better than benchmarks derived from the mutual fund universe. There is also evidence of fund managers' fund-selection abilities (Berk, 2005; Berk and Green, 2004; Cremers and Petajisto, 2009; Grinblatt and Titman, 1989). Fund managers holding concentrated portfolios in a few industries appear to have superior investment abilities compared to those with more diversified portfolios. Moreover, the degree of sector concentration positively affects fund performance (Kacperczyk et al., 2005, 2007) . Keswani and Stolin (2006) analyzed the U.K. mutual fund industry and found that the competitiveness of the fund sector influences the persistence of its members' relative performance. However, Tiwari and Vijh (2001) found that “sector funds neither outperform nor underperform the relevant benchmarks, that there is no persistence in sector fund returns, and that sector fund investors have no ability to pick the winning funds or the winning sectors.” Additionally, Fan and Lin (2020) analyzed the performance of 95 U.S. sector equity mutual funds relative to their ETFs, Standard and Poor’s Depositary Receipts (SPDR) sector ETFs, from 2008 to 2017. Their findings do not support the outperformance of actively managed sector mutual funds compared to their peer sector ETFs.
As shown in previous studies, we infer that there is mixed evidence regarding the performance of sector funds compared with relevant benchmarks. Hence, this study contributes to previous literature by examining whether mutual fund managers can outperform their benchmarks by investing in sector funds. We conduct a sector analysis by examining whether the use of active strategies through sector funds is more profitable than passive strategies through sector ETFs. Therefore, we first investigate the performance of the overall sector-focused mutual funds against that of their peers in sector ETFs by testing the following hypotheses:
Active sector-focused mutual funds perform similarly to their peers' sector ETFs.
Active sector-focused mutual funds outperform their peers' sector ETFs.
The recent emergence of sustainable funds reflects a growing desire among investors to have a positive impact on the environment and society while generating a return on investment. As investors become more socially, and environmentally responsible, sustainable sector funds are gaining popularity. Recent studies have examined the impact of ESG ratings on the performance of mutual funds in general. Most existing academic studies examine either the performance of sustainable funds (Adler and Kritzman, 2008; Humphrey and Tan, 2014; Revelli and Viviani, 2015; Shank et al., 2005) or the performance of specific samples of funds that invest in a particular sector, such as real estate funds (Bond and Mitchell, 2010; Chiang et al., 2008; Elyasiani et al., 2022), biotechnology and healthcare funds (Chen et al., 2018; Kaushik et al., 2014; Martí-Ballester, 2019), technology funds (Maruti and Shivaji, 2013), energy funds (Martí-Ballester, 2019), and infrastructure funds (Kammoun and Tandja Mbianda, 2023). While Dolvin et al. (2019) find that ESG risk ratings do not affect mutual fund performance, Abate et al. (2021) and Kammoun and Tandja Mbianda (2023) report superior performance for mutual funds with high ESG commitments.
Previous studies focusing on evaluating the impact of ESG risk levels on mutual funds do not consider that sustainability could affect some sector funds that invest in sensitive industries differently. Several studies have documented the sensitivity of certain industries to ESG risks, namely materials, banking, energy, technology construction, real estate, transport, and infrastructure (Apergis et al., 2022; Ashwin Kumar et al., 2016; Kammoun and Tandja Mbianda, 2023). Ashwin Kumar et al. (2016) demonstrate that each industry is affected differently by ESG factors. For example, considering ESG risks when investing in energy sector could help reduce significant risk in this volatile industry. Apergis et al. (2022) document that the industries of construction, energy, real estate, transport and infrastructure are likely to be most affected by environmental risk. Their results also show that sectors like tourism, oil, plastics, mining, transportation and airlines are more vulnerable to ESG risk during the pandemic crisis. Kammoun and Tandja Mbianda (2023) document the positive impact of ESG risks on the performance of mutual funds investing on infrastructure during normal periods.
Moreover, it seems that industries with high pollution levels or high natural resource intensity are often less likely to benefit from ESG commitments. Hartzmark and Shue (2022) show that as sustainable investors divest from materials and heavy-industry firms, these firms face higher financing costs and reduced investment capacity, which can translate into lower expected returns and stock performance. Chau et al. (2025) documents the relationship between ESG factors and firm value across multiple industries, including materials. Their results show that low to moderate ESG improvements increase firm value, but high levels of ESG spending generate diminishing returns, sometimes turning negative. Norocel and Brasoveanu (2025) emphasize that ESG benefits materialize slowly in heavy industries, and that the cost burden is higher relative to less emission-intensive sectors. Similarly, the relationship between ESG scores and stock performance in the healthcare sector is highly heterogeneous. Agarwal et al. (2023) find significant negative association between ESG and financial performance of healthcare corporations.
Meanwhile, these previous studies have not addressed the impact of ESG risk levels when comparing the performance of sector funds with relevant benchmarks. Hence, we believe that the analysis of the performance of active sector funds versus passive sector ETFs could be affected by the ESG risk level of the active sector fund compared to that of its peer sector ETF. The level of ESG risk of each active sector fund should be compared to that of its sector reference (passive sector ETF) to distinguish active sector funds characterized by a higher (lower) ESG risk than their peer sector ETF. Then, we assume that:
Low ESG risk active sector funds outperform their peer sector ETF.
High ESG risk active sector funds underperform their peer sector ETF.
Additionally, this study examines whether the overperformance of mutual funds with high ESG commitment, as shown by Kammoun and Tandja Mbianda (2023), is supported for all active sector funds. We assume that the impact of ESG risk could be more relevant for sensitive industries, such as real estate and technology. Hence, we test the following hypotheses:
Low ESG risk active sector funds perform similarly to high ESG risk active sector funds.
Low-ESG risk-active sector funds outperform high ESG risk active sector funds.
As previously mentioned, a growing body of literature has documented the sensitivity of some industries to ESG risks. Since ESG considerations affect each sector differently, we assume that the top-ranked sector funds in terms of performance vary across sectors and depend on the ESG risk level. Therefore, this study focuses on the ranking of sectors for overall sector funds and among high and low risk ESG active sector funds.
The performance of sustainable funds during market crises has been also explored. Nofsinger and Varma (2014) and Dong et al. (2019) show that, compared to matched conventional mutual funds, sustainable funds underperform during non-crisis periods and outperform during crisis periods. Many studies focus on the COVID-19 pandemic and document the outperformance of sustainable mutual funds during this crisis (Pástor and Vorsatz, 2020). Recently, Fang and Parida (2022) document the outperformance of high-sustainable funds compared to low-sustainable ones, especially during the COVID-19 pandemic and the post-crash pandemic. Building on these findings, we test the following two hypotheses:
Low ESG risk active sector funds perform similarly to high ESG risk active sector funds after the pandemic crisis period.
Low-ESG risk-active sector funds outperform high ESG risk active sector funds after the pandemic crisis period.
By testing the above hypotheses, we focus on whether the sustainability strategy would be more valuable in specific periods of crisis to allow sector mutual funds to beat their benchmarks. Furthermore, this paper contributes to the literature on both active versus passive sector fund performance and sustainable investment by providing a comparison between active sector funds and sector ETFs' performance, while considering the ESG risk level of the funds relative to their corresponding sectors. We suggest that doing better than its sector in sustainability may positively affect sector funds' performance compared to the corresponding sector ETF. This could be because fund managers' ability to select the best assets in the sector is not sufficient to overcome the passive strategy. Hence, we propose another way to overcome the passive strategy by using a sustainability-based strategy involving ESG risk levels.
3. Data
This study uses monthly net-of-fee returns on actively managed open-ended U.S. equity mutual funds from the Morningstar Direct Database from 2015 to 2023. The starting date corresponds to the date of the first availability of the ESG risk score, especially the Portfolio Corporate Sustainability Scores (PCSS) [4]. We accounted for known biases in the mutual fund database. Our database does not suffer from survivorship bias, as documented by Elton et al. (2001) and Fama and French (2010), because we consider both surviving and non-surviving funds by not selecting the “include only surviving investments” criteria in the database. To address backfill and incubation biases, we eliminate observations before the fund organization date, funds without names, and funds with no reported inception dates (Elton et al., 2001; Evans, 2010; Kacperczyk et al., 2008). Following Chrétien and Kammoun (2017), to ensure inclusion of only actively managed open-ended U.S. equity funds, we exclude index funds, balanced funds, money market funds, bond funds, international funds, funds not strongly invested in common stocks, and funds not opened to investors. We identify sector funds using the variable “Morningstar Institutional Category” obtained from the Morningstar Direct Database. We categorize funds into ten sectors [5] (communications, consumer cyclical, domestic energy, domestic financial, domestic real estate, health care, industrials, materials, technology, and utilities) and consider their corresponding S&P500 sector ETFs (Communication Services Select Sector SPDR Fund (XLC), Consumer Discretionary Sector SPDR Fund (XLY), Energy Sector SPDR Fund (XLE), Financial Sector SPDR Fund (XLF), Real Estate Select Sector SPDR (XLRE), Health Care Select Sector SPDR (XLV), Industrial Sector SPDR Fund (XLI), Materials Sector SPDR Fund (XLB), Technology Sector SPDR Fund (XLK), and Utilities Sector SPDR Fund (XLU)) along with the ETF replicating S&P500 ( SPDR S&P 500 ETF Trust (SPY)) as the S&P500 is the major financial index in the United States. Following Barras et al. (2010), we exclude funds with fewer than 60 observations to obtain reliable statistical Generalized Method of Moments (GMM) estimates. Finally, the Fama and French (2018) six-factor model factors are collected from Kenneth R. French's website [6].
4. Methodology
First, we conduct a comparative study to analyze the performance of active sector-focused mutual funds versus passive sector ETFs. We adopt a six-factor model (Fama and French, 2018) using GMM (Hansen, 1982) [7] as follows:
where measures the fund performance. is the excess return on fund i relative to the risk-free rate for month t. The risk-free rate is based on the return on one-month Treasury bills. represents the market portfolio, which corresponds to the value-weighted market return of all Center for Research in Security Prices (CRSP) firms incorporated in the U.S. and listed on the NYSE, AMEX, or NASDAQ. is the return difference between small- and big-market capitalization portfolios. is the return difference between high- and low-book-to-market ratio portfolios. is the return difference between the robust and weak operating profitability portfolios. is the return difference between conservative and aggressive corporate investment portfolios. is the return difference between the winner and loser portfolios based on the previous year's returns.
We considered 10 sectors and their corresponding S&P500 sector ETFs as follows: communications, consumer cyclical, domestic energy, domestic real estate, healthcare, industrials, materials, domestic financial, technology, and utilities. Then, using the overall sample of sector funds, we verify whether the overall active sector funds outperform the passive sector ETF, particularly the S&P 500 tracking ETF.
Second, we examine the impact of ESG risk scores on the performance of active sector funds versus their peer sector ETFs. Following Durán-Santomil et al. (2019) and Kammoun and Mrissa Bouden (2025), our sample of active sector funds is classified according to the Morningstar sustainability scores PCSS. Since PCSS is available monthly, we calculate an average for each active sector fund over the fund sample period. We divide the active sector funds into two groups based on whether their mean Morningstar sustainability score is below or above the median PCSS of their corresponding sector ETF. We then obtain two distinct groups: (A) high ESG risk sector funds and (B) low ESG risk sector funds.
We use two performance measures for each sector fund and its peer ETF: (1) the alphas calculated using regression analysis above and (2) the information ratio (IR) measured by using the alpha for the numerator and the standard deviation (SD) of the regression-adjusted error for the denominator. While alpha is a performance measure which is adjusted only from systematic risk factors, the IR also considers the unsystematic risks with could affect sector funds (Goodwin, 1998). Unlike mutuals funds which are diversified, the portfolios of sectors funds are concentrated in one sector and then could be affected by the specific risk of this sector. Hence, we assume that the IR could be a more accurate measure of sector funds' performance.
We test the differences in the mean between: (1) active sector funds and their corresponding sector ETFs, (2) high ESG risk active sector funds and their corresponding sector ETFs, (3) low ESG risk active sector funds and their corresponding sector ETFs, and (4) high ESG risk active sector funds and low ESG risk active sector funds.
5. Descriptive statistics
Table 1 presents the distribution of sample funds by sectors. The total number of sector funds in the sample is 874. We note that domestic real estate and technology have the largest number of funds (226 and 176, respectively). There are 132 and 130 funds for domestic energy and healthcare, respectively. The other sectors have between 51 (domestic financials) and 19 (industrials) funds.
Table 2 compares the average monthly returns for active versus passive sector funds between 2015 and 2023. Panel A (mutuals sector funds) shows that the top three performing sectors are technology, materials and consumer cyclical, with mean monthly returns of 1.239%, 0.831%, and 0.804%, respectively. In contrast, the communication sector has the lowest mean monthly return of 0.492%. The average monthly returns sector ETFs, presented in Panel B, reveals the same top ranking as mutual sector funds (technology with mean monthly returns of 1.662%). However, domestic energy ETF is in the second rank, followed by consumer cyclical ETF.
A comparison between Panels A and B in Table 2 shows that ETFs tend to outperform mutual sector funds in all sectors. The t-test results indicate that the differences in mean returns between mutual funds and ETFs are significant for all sectors at the 1% level, except for materials. Meanwhile, the differences in Sharpe ratio (SR) are significant for all sectors.
Furthermore, actively managed sector mutual funds are expected to be riskier and have a wider range of returns than their peer ETFs. Mutual funds exhibit a higher SD in nine out of 10 sectors. Therefore, Table 2 compares the Sharpe ratios used as a risk-adjusted performance measure. The differences in the Sharpe ratios between sector mutual funds and the corresponding ETFs align with the results for raw returns. Sector funds tend to generate a lower SR than their ETF peers. Overall, sector ETFs appear to outperform mutual sector funds. The average monthly return (SR) of the benchmark SPY is 1.03% (0.20%), versus only 0.78% (0.11%) for all mutual fund sectors.
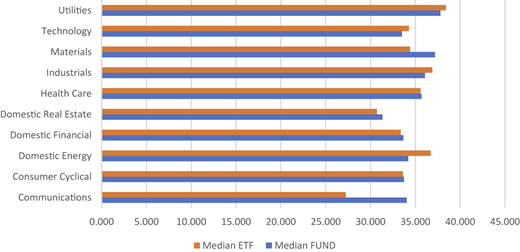
Table 3 reports descriptive statistics of ESG risk scores for sector funds and sector ETFs. We note that most sector funds present higher average ESG scores than their peer ETFs. It seems that only domestic energy and industrials exhibit lower average ESG scores than their peer ETFs. This finding highlights the efforts made by fund managers to select funds with lower ESG risk within these sectors. Furthermore, the difference in ESG score levels between sector funds and sector ETFs is unsignificant only for consumer cyclical and utilities. We find that, based on mean ESG scores, overall active sector funds appear to be riskier than their peer ETFs. However, we note high standard deviations for some sectors, which attests the asymmetric distribution of ESG scores. Thus, our analysis will be based rather on the median which is often preferred over the mean because it is less susceptible to the influence of outliers.
Figure 1 illustrates the median ESG risk scores for sector funds versus their peer ETF. We note that the ESG risk median of most sector funds is near that of the ETF, which is considered our sector reference. Nevertheless, we find that the ESG risk median of some sector funds (communications and materials) considerably exceeds that of their ETFs. It seems that fund managers do not place high emphasis on ESG risk when choosing which securities to include in the portfolios of communication and materials funds.
However, equity selection could be a challenging task for some sectors where investors seem more risk averse. Hence, we infer that since the level of risk aversion of investors varies from one sector to another, the sensitivity of sectors to ESG risk can vary from one sector to another. We then consider the median ESG score of the ETF as the reference score from which sector funds are categorized according to their ESG risk level. We divide our sample of sector funds into two groups according to their level of ESG risk: (1) low ESG risk sector funds whose ESG score is lower than that of the correspondent ETFs and (2) high ESG risk sector funds whose ESG score is higher than that of the correspondent ETFs.
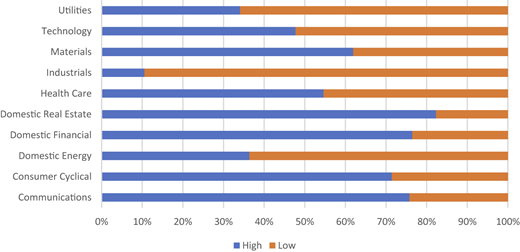
Figure 2 presents the percentage of sector funds classified as high and low ESG risk according to the median score of their peer ETFs used as a sector reference. The sectors that contain the largest number of sector funds characterized by high ESG risk are: Consumer cyclical, communications, domestic real estate, domestic financials, healthcare and materials (more than 50% of funds in these sectors are in the high ESG risk category). However, the remaining sectors (Utilities, Technology, Industrials, and Domestic Energy) contain more funds in the low ESG risk category.
6. Empirical results
6.1 Performance of sector funds versus sector ETFs
Table 4 (Panel A) presents results from a six-factor model for the period between 2015 and 2023. Alpha estimate and IR are reported for both sector mutual funds and sector ETFs. Alpha is a performance measure adjusted by systematic risk factors. IR provides a more accurate performance measure which is also adjusted by non-systematic risk. We find that none of the sector's mutual funds generates a significant positive alpha, except for the technology sector. However, the three sectors' ETFs, Domestic Energy, Domestic Financial and Technology, generate significant positive alphas at the 1% level. The t-test for the differences in alpha between sector's mutual funds and their peer ETF shows significant spreads in eight sectors out of the ten sectors (communications, domestic energy, domestic financial, domestic real estate, technology, consumer cyclical, industrials and utilities). The same results are noted for the differences in information ratios. These sectors' funds significantly underperform their peer ETFs. Meanwhile, only two sector funds (Health Care and Materials) were able to beat their peer ETFs for the period between 2015 and 2023, based on the IR. Besides, we find that the most profitable investments (both in sector funds and ETFs) are in the Technology sector, then Domestic Financial. Moreover, investments in Technology ETF generate much higher alpha than investments in Technology's funds (0.47% against 0.28%).
Overall, we show that total sector funds exhibit lower alpha compared to the benchmark SPY. The significance of the difference between total sectors funds and ETFs is maintained, when we also consider non-systematic risks in the IR, which attests that the performance of sector funds is lower than that of ETFs. This result is consistent with Fan and Lin (2020) who do not show evidence that actively managed sector mutual funds outperform their passive counterparties. Our findings show instead that the passive strategy appears to be more profitable in general.
6.2 ESG risk impact on the sector's fund performance
In this section, we consider ESG risk when comparing between sectors' funds and their peer sector ETFs. Sector funds are divided into two categories according to their ESG risk: (1) low ESG risk sector funds whose ESG risk is lower than the ESG score of the peer ETF and (2) high ESG risk sector funds whose ESG risk is higher than the ESG score of the peer ETF. We test whether the previous findings vary when considering ESG risk in the comparison between sector funds and their peer sector ETFs.
Table 4 (Panel B) presents alpha estimates and IR for both high ESG risk sector funds and sector ETFs. We note that t-test for the differences in alpha and IR between high ESG risk sector funds and their peer ETF shows significant spreads for all sectors, except for the industrial sector. Sector ETFs continues to dominate sector funds in the high-ESG risk category for most sectors except for Health Care and Materials which continue to beat ETF even these specific sector funds are in the high-ESG risk category. These results could be explained by the fact that industries with high pollution levels or high natural resource intensity, like materials, are often less likely to benefit from ESG commitments, mainly because of the high immediate costs of ESG implementation (Chau et al., 2025; Hartzmark and Shue, 2022). Furthermore, our results tend to support those of Agarwal et al. (2023) who find a negative association between ESG and financial performance of healthcare firms (Agarwal et al., 2023). Overall, we show that total high ESG risk sector funds exhibit lower alpha compared with the benchmark SPY. We point out that the performance of overall high ESG risk sector funds is lower than that of ETFs in general.
Table 4 (Panel C) presents alpha estimates and IR for both low ESG risk sector funds and sector ETFs. Results about the difference in alpha show that the majority of low ESG risk sector funds (seven out of ten) significantly underperform their peer ETFs. Besides, based on t-test p-value for the difference in IR, we add that the performance of health Care and materials funds have stopped beating their peer ETFs when we consider the low-ESG risk category. However, we note a loss of significance for the difference in alphas between domestic financial, domestic real estate and technology funds in the low-ESG risk category and their peer ETFs. Unlike our previous finding which shows that these sector funds in the high-ESG risk category underperform their peer ETFs, results in Panel C point out that these sector funds perform like their peer ETF when they are in the low-ESG risk category. Moreover, we show that total low ESG risk sector funds exhibit lower alpha compared with the benchmark SPY. We conclude that the performance of overall sector funds is lower than that of ETFs in general, regardless of their ESG-risk category. Our results in Table 4 are consistent with Fan and Lin (2020) who argue that “active mutual funds may not be a good candidate for sector allocation or rotation. p 176”. Furthermore, as shown by previous authors such as Barras et al. (2010), passive sector ETFs can instead provide a more interesting performance with much lower costs.
Table 4 (Panel D) examines the difference in performance between high and low ESG risk sector funds. Results show insignificant differences in alpha and IR between the two categories of sectors funds for six sectors (communications, domestic energy, domestic real estate, consumer cyclical, industrials and utilities). It seems that ESG risk level does not matter for these sectors' funds. However, we find a positive (negative) and significant impact of ESG commitments to technology and domestic financial (health care and materials) funds. The technology (domestic financial) funds with low ESG risk characteristics present an average performance of 43% (5.7%) against 11.9% (−10.3%) for technology (domestic financial) funds with high ESG risk characteristics. However, we note a negative performance for health care and materials funds, regardless of their ESG risk characteristics, but it seems that high ESG risk funds for these sectors perform less poorly compared to those with low ESG risk. Nevertheless, we show that total low ESG risk sector funds exhibit significant higher alpha and IR compared with high ESG risk sector funds. Overall, this finding leads us to highlight the overperformance of all low ESG risk sector funds analyzed together despite that our results vary according to the sector funds analyzed separately.
6.3 Sector funds versus ETFs' performance across subperiods
This section provides further analysis of sector funds versus ETFs' performance across two subperiods: (1) pre-COVID period between 2015 and 2019, and (2) post-COVID period between 2020 and 2023. We assume that ESG risk impact could have a more important effect after the pandemic crisis period. Since investors are more risk averse during crisis period, they should allocate more attention to less risky financial products such those with low ESG risk levels. Fang and Parida (2022) find that low-sustainable funds outperform high-sustainable ones, and this outperformance increases significantly during the stock market crash caused by the COVID-19 pandemic and the post-crash pandemic. Therefore, we divide our period of study into two sub-periods (before and after COVID-19 crisis) to verify whether sector funds will be able to beat their corresponding sector ETFs after the pandemic crisis, by using the sustainability strategy in the selection of securities in their sector portfolios.
Table 5 (Panel A) presents results for the full sample of sector funds versus sector ETFs for the pre-COVID-19 (2015–2019), while Table 6 (Panel A) reports results for the post-COVID-19 period (2020–2023). We show a little difference in results compared with those reported for overall the period of study. It seems that health care and materials funds dominate their peer ETF only for the post-COVID-19 period (significant p-values are reported for the differences in information ratios). However, communication funds outperform (underperform) its peer ETF in pre (post)-COVID-19 period. We continue to recognize that most sector funds underperform their peer ETFs, either before or after the COVID-19 pandemic. The underperformance of sector funds relative to ETFs remains unchanged for both sub-periods.
Table 5 (Panel B) presents results for high ESG risk sector funds versus sector ETFs for the pre-COVID-19 (2015–2019), while Table 6 (Panel B) reports results for the post-COVID-19 period (2020–2023). The outperformance of health care and materials funds compared with their peer ETF disappears (remains unchanged) when we consider high ESG risk sector funds in pre-(post)-COVID-19 period. Communication funds still outperform (underperform) its peer ETF in pre (post)-COVID-19 period, even in the high ESG risk category. It seems that high ESG risk consumer cyclical, domestic financial and industrials exhibit similar performance with their peer ETFs in post-COVID-19 period. Overall, high ESG risk sector funds underperform ETFs for both subperiods.
Table 5 (Panel C) presents results for low ESG risk sector funds versus sector ETFs for the pre-COVID-19 (2015–2019), while Table 6 (Panel C) reports results for the post-COVID-19 period (2020–2023). We show a notable difference in results for the low ESG risk sample compared with those reported for overall the period of study. We reveal the outperformance of overall fund sectors with the low ESG risk category compared to ETFs only in post-COVID-19 period. This finding is consistent with our assumption that investors tend to allocate more importance to ESG considerations after the pandemic crisis. Hence, the sustainability-based strategy could enhance performance of sector funds to be able to beat passive funds. However, this finding depends on the sector. We find that communication and technology funds with the low ESG risk category dominates their peer ETFs only in pre-COVID-19 period. However, utilities, materials and domestic financials [8] funds with the low ESG risk category dominates their peer ETFs only in post-COVID-19 period. It appears that low ESG risk domestic real estate funds exhibit the same performance than peer ETF either in pre- and post-COVID-19 periods. Low ESG risk Industrial funds also exhibit similar performance relative to peer ETF, but only in post-COVID-19 period. However, domestic energy and health care funds with the low ESG risk category underperform their peer ETF either in pre- and post-COVID-19 periods. We conclude that despite that overall active sector funds with the low ESG risk category seem to outperform passive sector funds in general, the strategy of inclusion of low ESG risk securities in the portfolios' of active sector funds not lead managers to beat passive funds for all sectors.
Table 5 (Panel D) presents results for high versus low ESG risk sector funds for the pre-COVID-19 (2015–2019), while Table 6 (Panel D) reports results for the post-COVID-19 period (2020–2023). When we split the full sample period according to the crash pandemic, we find that the total low (high) ESG risk sector funds significantly outperform the high (low)-ESG risk ones in post (pre)-COVID-19 period. We reveal that the overall dominance of low ESG risk sector funds, shown previously in Table 4 (Panel D), is attributed to the post-COVID-19 period. Nevertheless, our results for each sector separately present mixed evidence. The superior performance of low ESG risk technology funds is highlighted in pre-and post-COVID-19 periods. Domestic financial and utilities funds with low ESG risk category outperform (underperform) the high ESG risk ones in post (pre)-COVID-19 period. Low ESG risk consumer cyclical, domestic real estate and industrials funds exhibit the same performance than correspondent high ESG risk ones in post-COVID-19 period. Although, it appears that communications, domestic energy and health care funds still dominate with the high ESG risk category even in post-COVID-19 period. Some previous studies also do not support the positive impact of ESG considerations for some sectors such as Makridou et al. (2024) who reveal that energy companies' profitability is marginally and negatively affected by their ESG performance.
7. Discussion and implications for investors, fund managers, stockholders and market regulators
First, this study could help investors to select between active and passive strategies in sector investment. It seems that paying more fees to benefit from better performance by investing in sector funds instead of ETFs is not evident for most sectors. Our findings highlight the overperformance of ETFs compared with sector funds in general.
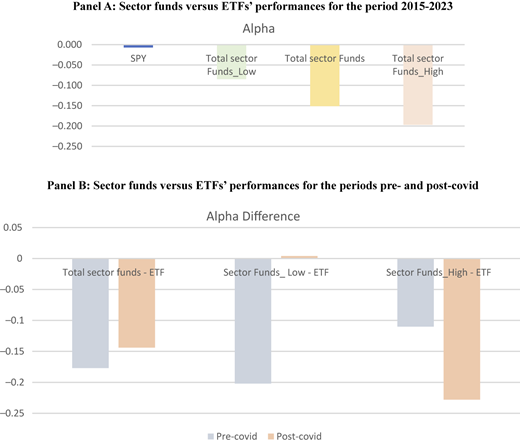
Figure 3 (Panel A) summarized our results for the overall sector (funds and ETFs) performance through alpha estimates. We also consider two categories of sector funds (high and low ESG risk).
We note that despite ESG risk considerations in sector funds, ETFs exhibit the best performance, which attests to the superiority of the passive strategy for sectoral investments. Besides, this general finding is not removed when you use ESG considerations to categorize sector funds. However, we cannot ignore the fact that low ESG risk sector funds generally perform much better than high ESG risk ones, but this is still not enough to beat the passive strategy. This result may lead us to doubt about the ability of fund managers to select the best funds in the sector. This brings us to think about the role of fund managers and strategies adopted to beat the market. We suggest that fund managers should use innovative strategies better adapted for each sector, considering sector specificities.
It appears that although ESG risk considerations attest their positive impact in the sector fund market in general, separate analyses for each sector still present mixed evidence. We infer that the sensitivity magnitude to ESG factors vary across sectors, which is reflected in sector funds.
Figure 3 (Panel B) reports the difference in alpha (proxy of performance measure) between: (1) total sector funds and ETFs, (2) low ESG risk sector funds and ETFs, and (3) high ESG risk sector funds and ETFs, in pre- and post-COVID-19 periods. We find that the magnitude of the negative difference between total sector funds and ETFs is larger in the pre-COVID-19 period compared with the post-COVID-19. It appears that passive sector funds dominate active sectors funds in general, regardless the period, but with a decreasing outperformance in the post-COVID-19 period. In pre-COVID-19 period, we show that the magnitude of the difference is more important when we consider low ESG risk sector funds, whereas, in post-COVID-19 period, this difference is larger for high ESG risk sector funds. Investors seem to penalize high ESG risk sector funds after the pandemic crisis. More importantly, we reveal the change in the sign of the difference in alpha between low ESG risk sector funds and ETFs: it becomes positive, but with thin magnitude. This finding attests the ability of low ESG risk sector funds to beat passive funds in post-COVID-19 period. We recognize that investors' behavior toward risk seems to have changed in post-pandemic crisis. They seem to be more risk-averse and pay more attention to ESG considerations. Although the reward for sustainable sector funds is still low, the penalty for unsustainable sector funds is much higher.
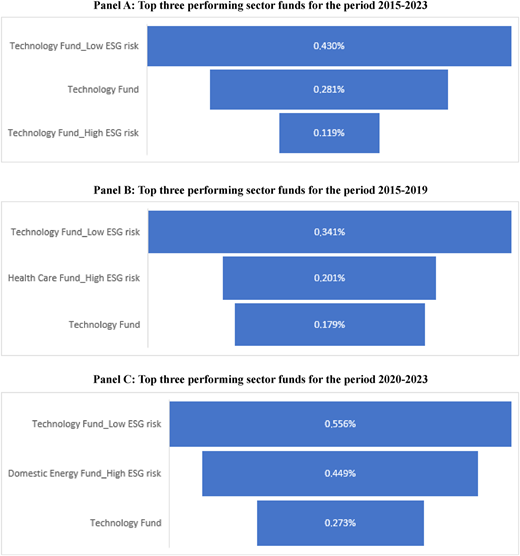
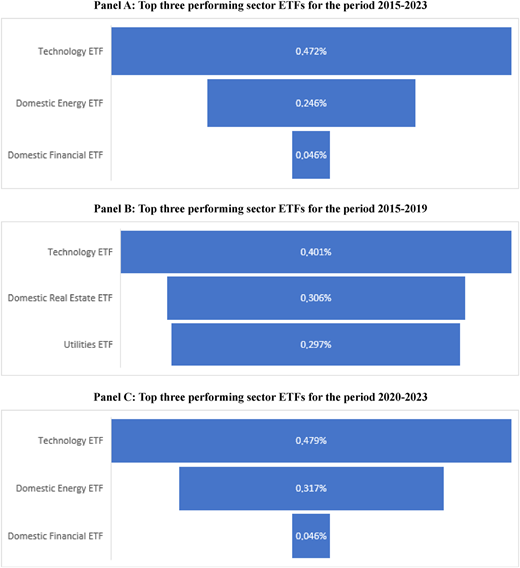
Second, Figures 4 and 5 report the top three performing sector funds and ETFs, for the full sample period (Panel A), the pre-COVID-19 period (Panel B) and the post-COVID-19 period (Panel C) respectively. When we consider the full sample period (Panel A), we note that technology ETF exhibits the best performance (0.472%). Technology funds with low ESG risk take the first place among sector funds' performances (0.43%) and the second after technology ETF. It appears that investment in the technology sector is generally benefit even for the high ESG risk category (but with lower performance). Besides, domestic energy ETF generates a good performance (0.246%) and takes second place. Moreover, we find that the domestic financial sector is ranked in the third place for ETFs. Furthermore, we note that technology funds with low ESG risk keeps its first rank either in pre-(Panel B) and post-(panel C) COVID-19 periods with a performance of 0.341% and 0.556% respectively. However, the second rank is attributed to health care funds with high ESG risk category in pre-COVID-19 and domestic energy with high ESG risk category in post-COVID-19. Technology funds are ranked the third in both periods. For the ETF sector ranking, the top three performing sector ETFs in post-(panel C) COVID-19 period is the same as for the full sample period: (1) technology ETF , (2) domestic energy ETF and (3) domestic financial. However, in pre-COVID-19 period (Panel B), only technology ETF keeps its first rank, the second and the third ranks are attributed to real estate ETF and utilities ETF.
These findings help investors to have an idea about the sector that generates more profits in the mutual fund market, as well as the ETF market on the one hand, and enhance fund managers' strategies based on ESG considerations within and between sectors, on the other hand.
Overall, ESG commitment in mutual funds aims to achieve competitive financial returns while promoting sustainability, risk mitigation (such as regulatory fines or corruption), and alignment with ethical values. This often results in more resilient portfolios, the creation of sustainable long-term value, reduced risk, and increased investor confidence. While long-run prospects are often positive, the short-run impact of ESG on funds' performance can be inconsistent, especially for some specific sectors such materials. Initial costs associated with implementing ESG initiatives may suppress short-term profitability. Nevertheless, the efficiency of this approach is supported over time but requires stockholders to be aware of the limited diversification and current challenges related to the consistency of ESG data. However, due diligence is required to avoid “ ESG washing” and ensure genuine long-term strategies. In summary, while the immediate financial return of ESG scores may be debatable, there is a consensus on significant long-term benefits for stockholders, due to improved operational resilience, optimized risk management, and the ability to attract long-term capital.
Finally, the lack of universal ESG standards and criteria prevents investors from accurately comparing the ESG impact on the performance of different funds and companies. This can lead to subjective assessments and potentially misinformed decisions. Market regulators must therefore collaborate to achieve universal standards for ESG reporting.
8. Conclusion
Given the mixed results in the literature regarding the evidence of outperformance of active strategies compared to passive strategies, this paper tests whether sector funds outperform their ETF peers. Unlike previous research, this study conducts a comparative analysis between active and passive strategies in sector investment, considering the impact of ESG commitments. We examine whether sustainability-based active strategies could help fund managers to beat the passive strategies in the sector market. We use two performance proxies: (1) Alpha estimate from the six-factor model of Fama and French (2018) which is adjusted from systematic risk factors and (2) IR which also considers unsystematic risks.
Our findings show that sector funds fail to beat sector ETFs in general for the full sample period between 2015 and 2023, except for health care and materials sectors (based on IR results). Besides, unlike the other sector funds, health care and materials funds continue to dominate their ETF peers, even in the high ESG risk category. However, it seems that the use of a sustainability-based selection strategy leads some low ESG risk sector funds (domestic financial, domestic real estate, materials and technology) to exhibit similar performances to their peer ETFs (either based on IR or Alpha or both). However, when we split the period of study into two subperiods (before and after the pandemic crisis), we reveal that total active sector funds with low ESG risk category become able to beat passive sector funds in general. Besides, the magnitude of underperformance of total active sector funds with high ESG risk category relative to their peer ETFs increase in the post-COVID-19 period. It appears that investors become more risk-averse after the pandemic crisis and tend to reward (penalize) sustainable (unsustainable) investments which are perceived less (more) risky. We highlight the role of sustainability in slightly improving the performance of some sector funds (utilities, materials and domestic financials) compared to their peer ETFs, especially after the pandemic crisis. Nevertheless, it seems that other low ESG risk sector funds (domestic energy and health care) still underperform their peer ETF either in pre- and post-COVID-19 periods.
Moreover, our results support the overall outperformance of low ESG risk sector funds compared to high ESG risk ones, especially after the pandemic crisis. These findings suggest that fund managers and investors should consider ESG risk of sector funds into their investment decisions, particularly after crises. However, this outperformance is not evident for each sector. Domestic financial and technology sector funds exhibit the highest performance in the low ESG risk category. Meanwhile, it seems that health care and materials sector funds perform better in the high ESG risk category. Otherwise, ESG risk level has no significant effect on other sectors (consumer cyclical and industrials). We infer that although our findings support the superior performance of overall sustainable sector funds relative to unsustainable ones, there is a divergent sensitivity to ESG risk level within the sector funds and across the periods.
Finally, this paper is useful to improve investors and fund managers' decisions around sector investments. Our results could help investor to: (1) select the best performing sectors, either in the mutual fund or ETF market, (2) check whether the high fees paid to benefit from active strategies will be covered by superior performances in the sector fund market, and (3) identify the sectors that are positively affected by sustainability. Furthermore, given the divergent sensitivity of sector funds to ESG commitments, this research could encourage fund managers to improve their company selection strategies into the sector funds' portfolios to beat passive sector funds. Moreover, policymakers should encourage ESG disclosure and support sustainability initiatives. Firms may also need to accelerate ESG commitments after crisis, especially in high-risk sectors. Hence, ESG commitment could be beneficial for stockholders by offering resilience during crises, risk mitigation, and enhance long-run market value.
Future research could investigate whether regulatory regimes toward ESG disclosure affect the performance of sector mutual funds compared to ETFs, since ESG disclosure rules differ across countries. Future avenue could also examine how ESG risk affects sector fund flows compared to their sector ETFs. Understanding these flow dynamics would shed light on how investors reallocate capital across passive sector products while considering ESG risks.
We thank participants at the “SCSE 2025 Annual Meeting” in Oford, Canada.
Notes
Morningstar Direct database defines the Portfolio Corporate Sustainability Scores (PCSS) as follow “it is an asset-weighted average of Sustainalytics' company-level ESG Risk Score. The Sustainalytics' company-level ESG Risk Score measures the degree to which a company's economic value may be at risk driven by ESG factors. Like the ESG Risk Scores, the Portfolio Corporate ESG Risk Score is rendered on a 0–100 scale, where lower scores are better, using an asset-weighted average of all covered securities. Morningstar determines whether each eligible portfolio holding can be classified under the corporate or sovereign framework. Each holding can only contribute an ESG Risk Score or a Country Risk score, not both. To receive a Portfolio Corporate ESG Risk Score, at least 67% of a portfolio's corporate assets under management (long positions only) must have a company ESG Risk Rating.”
Since we focus on the sector classifications used for S&P 500 sector ETFs, funds that do not belong to these categories are excluded from the sample, as they do not follow sector-specific investment strategies according to the “Morningstar Institutional Category” variable. We also exclude the consumer defensive sector and its corresponding ETF due to an insufficient number of funds in this group after applying the filters.
In all our estimation cases, the systems are just identified, meaning that the number of moment conditions equals the number of parameters. Therefore, the GMM estimates are not affected by the choice of the weighting matrix. Although we estimate the alpha parameter separately for each fund, Farnsworth et al. (2002) show that estimating the system one fund at a time yields the same point estimates and standard errors as a system that includes multiple funds. The statistical significance of the parameters is evaluated using the asymptotic properties of GMM as established by Hansen (1982). Our estimation tool (Statistical Analysis System) selects lag length automatically using a standard rule-of-thumb based on sample size. In summary, GMM is a more flexible and powerful tool for addressing common problems in econometrics (endogeneity, panel data) where the strict assumptions of OLS are not supported, leading to more robust and efficient estimates.
The difference in information ratio between sector fund and sector ETF is significant at 10% level, whereas, the difference in alpha is unsignificant.