This paper examines the socio-economic determinants and barriers to financial inclusion in Jordan. This study aims to evaluate how demographics, education and income levels influence the usage of varied financial services, from basic bank accounts to digital mobile money.
Using repeated cross-sectional microdata from the World Bank’s Global Findex surveys across five waves: 2011, 2014, 2017, 2021 and 2025. The empirical analysis is primarily conducted using a Linear Probability Model, with a Probit model employed for robustness.
Identify education as the most potent predictor of inclusion is substantially boosting participation in formal savings and mobile money. While women show a slight lead in basic account ownership, they lag behind men in credit and mobile payment adoption, with no significant gender education difference effect observed. Income remains a critical determinant, with the wealthiest quintile dominating card and account usage. Barrier analysis reveals that women are primarily hindered by distance, the elderly by lack of funds and the less educated by documentation requirements. Notably, a high reliance on family members’ accounts persists as a significant informal substitute for individual formal inclusion across all groups.
This research provides a context-specific evaluation of Jordan’s financial landscape during a critical policy transition. By diagnosing group-specific barriers, it offers actionable evidence to implement targeted interventions, such as free basic accounts, fee-free domestic online transfers and simplified tiered Know Your Customer systems, to enhance equitable financial access and promote a less-cash society.
1. Introduction
Financial inclusion has become a key pillar of economic development, especially in developing countries where access to financial services is still uneven (Mishra et al., 2024). An expanding literature emphasises the role of financial inclusion in fostering economic growth, improving welfare and promoting a more equitable distribution of development gains across society (Demirguç-Kunt et al., 2013; Kim et al., 2018). Increasingly, financial inclusion is no longer viewed as a policy option but as a policy imperative, with evidence showing a strong positive association between financial inclusion and economic development (Sarma and Pais, 2011; Kim et al., 2018; Van et al., 2025). By reducing poverty and inequality, financial inclusion supports inclusive and sustainable economic growth (Beck et al., 2007; Acheampong et al., 2021; Le Quoc, 2025). It also facilitates job creation and raises per capita income (Demirgüç-Kunt and Singer, 2017). Beyond its economic effects, financial inclusion supports human development through greater investment in education, research and skills development (Stein and Yannelis, 2020). Financial inclusion is identified by the United Nations (UN) Sustainable Development Goals (SDGs) as a central mechanism for promoting sustainable development worldwide.
Policymakers often face difficulties formulating practical approaches to advance financial inclusion, particularly given the conflicting theoretical perspectives on the impact of financial inclusion on economic growth. Many developing countries struggle to translate macro-level strategies into equitable access at the micro level (Mader, 2018). Therefore, understanding the socio-economic characteristics that influence individuals’ access to and use of financial services is essential for designing effective, context-specific policies. This study examines how such characteristics influence financial inclusion outcomes in Jordan. In this country, progress remains limited despite policy efforts. According to the Global Findex Database (2021), 47% of adults in Jordan hold an account with a formal financial institution, a widely used indicator of financial inclusion [1]. This figure is substantially lower than in countries of comparable population size, such as the United Arab Emirates and Hungary, where account ownership exceeds 85%. It also falls below the average for lower-middle-income countries, which stands at 62.4%. These highlight a persistent and underexplored gap between national financial inclusion initiatives and household-level access in Jordan, highlighting the need for an empirical investigation into the socio-economic determinants of financial inclusion.
Many countries have implemented targeted strategies and reforms to expand access to financial services. Reflecting this global trend, Jordan launched its second National Financial Inclusion Strategy for 2023–2028, building on the achievements of its first strategy 2018–2020. Spearheaded by the Central Bank of Jordan, this comprehensive roadmap focuses on enhancing access to finance, savings, insurance and payments for priority groups, including the poor, women, youth, refugees and MSMEs. The strategy is closely aligned with Jordan’s economic modernisation vision and the UN SDGs, emphasising digital innovation, consumer protection and inclusive growth as core pillars of national development.
This study draws on repeated cross-sectional data from the World Bank’s Global Findex surveys for Jordan, over five waves (2011, 2014, 2017, 2021 and 2025). Its primary aim is to understand the determinants and barriers to financial inclusion. The contribution of this work is threefold. Firstly, it provides a mapping dynamics of financial inclusion in Jordan over a decade. Secondly, it sheds light on the experience of vulnerable groups, classified by education, income, gender and age, offering a nuanced perspective on who remains excluded and why. Thirdly, in contrast to existing Jordan-focused studies that rely on a single wave of Global Findex data [e.g. Jordan Strategy Forum (JSF), 2017; Shawaqfeh and Al-Nimri, 2020] or small-scale primary surveys with limited sample sizes (Al Khub et al., 2024), this study exploits the full set of available Global Findex waves for Jordan. To the best of our knowledge, no prior study has combined all five waves to conduct a longitudinal comparative analysis of financial inclusion in Jordan. This repeated cross-sectional approach enables the examination of temporal developments and structural shifts that cannot be observed in single-year or cross-sectional analyses.
The study combines descriptive and regression analyses to examine the trends, determinants and barriers to financial inclusion using Linear Probability Model (LPM) as our primary estimation strategy and Probit model as robustness. The results show that individuals with higher incomes, more educational attainment and women are more likely to be financially included, with inclusion increasing at younger ages but declining later in life. Regarding barriers, women are more likely to report that financial institutions are too far away, but less likely to report reliance on a family member’s account as a barrier. Older are more likely to report distance and financial constraints as barriers. Income reduces financial barriers: those in the wealthiest quintile are less likely to cite high costs or lack of money. Individuals with secondary or tertiary schooling are much less likely to identify documentation problems or lack of money as reasons for exclusion.
The remainder of the paper is structured as follows: Section 2 provides a literature review. Section 3 outlines the data description and methodological. Section 4 reports the descriptive statistics and empirical findings. Finally, Section 5 concludes.
2. Literature review
The literature provides a strong theoretical and empirical basis for treating financial inclusion as a cornerstone of economic development. Foundational theories, beginning with Schumpeter (1911), highlight bank credit as the essential fuel for innovation and economic dynamism. This concept was developed by Goldsmith (1959) and Gurley and Shaw (1955), who demonstrated that the development of a country’s financial system, including its savings-investment channels, is closely linked to overall economic growth. Modern empirical studies overwhelmingly confirm this positive association (Levine, 1996; Dahiya and Kumar, 2020). More importantly, financial inclusion is now widely recognised not just as a financial metric but as a key instrument for inclusive development. Research shows that financial development disproportionately benefits the poorest quintiles, helping to reduce poverty (Beck et al., 2007; Zhang and Posso, 2019) and income inequality (Neaime and Gaysset, 2018), while promoting human development (Sarma and Pais, 2011) and national financial stability (Alvi et al., 2020). Recent studies further expand this perspective by linking financial inclusion to the SDGs and to financial stability (Huy and Dinh, 2025; Dinh, 2025). These studies highlight that the role of inclusive financial systems is to achieve broader social and economic objectives while maintaining the sustainability of the banking sector. Similarly, Khoi and Dinh’s (2025) research on digital financial inclusion in ASEAN and other regions demonstrates that the adoption of digital channels can significantly reduce financial exclusion, particularly for marginalised populations, and may also influence income unevenness and economic complexity.
A second stream of literature focuses on the micro-level determinants and barriers influencing individual participation, which directly informs this study. Analyses using individual data, including the Global Findex database, consistently identify socio-economic characteristics as primary drivers of financial inclusion. Education and income (or wealth) are repeatedly cited as the most significant positive determinants of account ownership, savings, borrowing and the use of formal financial services (Zins and Weill, 2016; Sanderson et al., 2018; Kumar and Pradhan, 2024). Age and gender are also critical, with many studies findings that women face persistent inclusion gaps (Demirguc-Kunt et al., 2018; Ba and Dieng, 2025). These disparities are often reinforced by structural barriers, including distance to financial access points, complex documentation requirements and the high cost of financial services (Sanderson et al., 2018). Financial literacy, governance quality and the expansion of digital financial services (FinTech) are identified as key enablers for overcoming these barriers (Akileng et al., 2018; Eldomiaty et al., 2020; Demirguc-Kunt et al., 2018; Le Quoc, 2025).
Building on this literature, our study makes several contributions to the understanding of financial inclusion in Jordan. Firstly, unlike prior studies that typically rely on different countries, a single wave of data or small-scale surveys, we exploit repeated cross-sectional data from five waves of the Global Findex (2011–2025), allowing us to capture temporal dynamics and structural shifts in financial inclusion over a decade. Secondly, we examine the experience of vulnerable groups classified by gender, education, income and age, shedding light on the differential barriers they face. Thirdly, by including insights from recent research on digital financial inclusion and sustainable development, our study highlights the policy relevance of promoting inclusive digital financial services as a strategy to reduce inequality and foster sustainable economic growth. Collectively, these contributions help fill a gap in Jordan-specific research and provide evidence that can inform both national policy and broader discussions on inclusive finance in MENA economies.
3. Methodology
3.1 Data
The research uses data from the World Bank’s Global Findex database, a globally recognised and comprehensive resource for financial inclusion (Demirgüç-Kunt et al., 2022). This data set is compiled from individual-level surveys conducted in 2011, 2014, 2017, 2021 and 2025 (World Bank Publications, 2013). Our analysis focuses on the data for Jordan across all five survey periods. The database provides detailed insights into financial inclusion indicators, including financial account, use of mobile money services, savings, borrowing, debit and credit card use, along with the main barriers to accessing financial services. The data set also includes a range of individual-level socio-economic characteristics.
The Global Findex database is the most appropriate source for analysing financial inclusion in Jordan because it provides individual-level, demand-side indicators of access to and use of financial services, such as account ownership, savings and payments. In contrast, data from national sources, including the Central Bank of Jordan, are largely macro-level and supply-side, focusing on aggregates such as banking penetration or credit volumes and therefore cannot identify which socio-economic groups are financially included or excluded. The consistent methodology of Global Findex across survey waves further enables the analysis of financial inclusion dynamics over time. The Global Findex survey covers the adult resident population of Jordan but does not identify respondents by refugee status. Refugees living in households may therefore be included in the sample. But still, they cannot be analysed as a separate group. Thus, this study examines financial inclusion among the adult population and does not draw refugee-specific conclusions. This includes limitations in the data.
Following Kumar and Pradhan (2024), Balliester Reis (2022) and Zins and Weill (2016) in financial inclusion and barriers measures, we employ six indicators to measure financial inclusion, with the first three regarded as the most critical. Having an account at a financial institution reflects account ownership, while saving captures whether the individual deposited money into such an account in the past 12 months. Borrowing reflects whether the individual obtained a loan from a financial institution during the same period. These three indicators correspond to the core dimensions of financial inclusion, access to formal financial services and their active use. They are widely adopted in the literature as fundamental measures of inclusion. Beyond these, we include more additional indicators. Debit card indicates whether the individual possesses a debit card. Credit card indicates whether the individual holds one; whether an individual uses a mobile phone or any other device for any financial transactions. These additional indicators capture payment functionality and digital engagement, reflecting broader and more advanced dimensions of financial inclusion beyond basic access. All six indicators are binary and serve as dependent variables in the analysis. The independent variables consist of individual characteristics, such as gender, age, income, education and workforce, which are anticipated to affect financial inclusion among Jordanians (Al-Masaeid and Almomani, 2025a, 2025b, 2025c, 2026).
Furthermore, we examine the barriers towards financial inclusion by examining respondents stated barriers for not owning a financial account. Eight reasons were included, and each of them coded as binary variables to indicate whether the respondent reported each reason applied to them: distance to financial institutions, high costs of services, insufficient or missing documentation, low confidence or distrust in institutions, religious considerations, limited financial resources, reliance on a family member’s account and perceived lack of necessity for financial services. These variables allow us to capture both the level of financial inclusion and its barriers constraining access to financial services in Jordan.
All financial inclusion and barriers variables are coded as binary (0 / 1), where 1 indicates the presence of a characteristic or barrier (e.g. owning an account, using a debit card, reporting a barrier), and 0 means its absence. Responses recorded as “don’t know” or “refuse to answer” are treated as missing values.
While cross-country studies offer valuable global benchmarks, a single-country analysis of Jordan is essential to capture the granular socio-economic dynamics and structural nuances that are often obscured by the average effects in large data sets. Jordan shows a case for investigation due to its specific national policy objectives. Specifically, the country has recently transitioned to its second National Financial Inclusion Strategy (NFIS) for 2023–2028, which prioritises narrowing the gender gap, empowering youth and expanding digital payment systems, all of which align directly with the variables examined in this study. Focusing exclusively on Jordan allows us to evaluate these relationships within a stable institutional and regulatory framework, avoiding the omitted variable bias often introduced by the vast cultural and legal heterogeneity of multi-country samples. This targeted approach provides high internal validity and yields actionable, evidence-based insights that enable Jordanian policymakers to monitor the progress of the NFIS and address the persistent barriers to formal financial participation.
3.2 Empirical methodology
This section outlines the econometric framework used to investigate the determinants of financial inclusion and barriers. Following standard practice in the literature (e.g. Angrist and Pischke, 2008), we use a LPM as our primary estimation strategy, supplemented by a Probit model for robustness. To test our research hypotheses regarding the impact of demographics, education and workforce participation on financial inclusion, we estimate the following three specifications.
Specification 1:
to examines the baseline direct effects of individual characteristics.
Specification 2:
to examine an interaction term to test that education moderates the gender gap in financial inclusion.
Specification 3:
extends the model to control for workforce participation, isolating the effect of employment status.
Where represents the financial inclusion of individual i and year which is measured using the indicators mentioned in Section 2. All dependent variables are binary, taking a value 1 if the individual uses the corresponding financial inclusion indicator and 0 otherwise. The explanatory variables are individual characteristics expected to influence financial inclusion, gender, age, education, income and workforce, and is the random error term. The coefficients of interest are to, which show the improvement in the financial inclusion of individuals when their individual-level socio-economic increase. We consider t ∈{2011, 2014, 2017, 2021, 2025} and include a binary variable for the years 2014, 2017, 2021, 2025 in the vector of control variables (with one omitted category to avoid perfect multicollinearity).
While the dependent variable is binary, we employ the Ordinary Least Squares (OLS) estimator, specifically the LPM, as our primary method. While non-linear models like Probit is theoretically constrained to the [0,1] interval, the LPM is preferred in this context for three methodological reasons supported by recent econometric literature. Firstly, second and third specifications of this study involve the interaction between gender and education. In non-linear models (Probit), the marginal effect of an interaction term is not equal to the interaction coefficient, and standard statistical software often reports incorrect significance levels for these terms (Ai and Norton, 2003). The LPM avoids this trap, allowing for a direct and transparent interpretation of. Second, as mentioned by Angrist and Pischke (2008), the LPM often yields estimates of marginal effects indistinguishable from those of the Probit model near the centre of the distribution. The coefficients in our LPM denote percentage point changes, offering clear policy relevance. Finally, with large micro-level data sets and multiple survey waves, the LPM provides a computationally efficient and numerically stable framework, particularly when including time fixed effects (Imai et al., 2023).
Since the dependent variable is binary, the variance of the error term in a LPM depends on the values of the independent variables (heteroskedasticity). To address this, we estimate all specifications using heteroskedasticity robust standard errors (MacKinnon and White, 1985; White, 1980). This correction relaxes the assumption of homoskedasticity, ensuring that standard errors are consistent and hypothesis testing is valid even with the inherent non-constant variance of the LPM.
To validate our findings that predicted probabilities from the LPM may fall outside the interval, we re-estimate all specifications using a Probit model. According to Cameron and Trivedi (2010), the Probit specification is appropriate for binary dependent variables and assumes that the error term follows a standard normal distribution, . The probability that individual in year is financially included is therefore given by:
where denotes the cumulative distribution function of the standard normal distribution, is a vector of individual socio-economic characteristics (gender, age, education, income and workforce status) and is the vector of parameters to be estimated.
The Probit model is based on a latent variable representation in which an unobserved propensity for financial inclusion is determined by:
The observed binary outcome is then defined as:
All Probit specifications include year fixed effects to control for macroeconomic and policy changes across survey waves. The Probit results are reported as robustness checks alongside the LPM estimates and confirm that the sign, significance and relative magnitudes of the key covariates are qualitatively consistent across estimation methods. This indicates that the main conclusions of the study are not driven by the choice of linear versus non-linear probability models.
4. Results
4.1 Descriptive trends
Table 1 reports the descriptive statistics of variables; the repeated cross-section of 5,023 individuals from the Global Findex across the five survey years (2011, 2014, 2017, 2021 and 2025). The socio-economic variables include gender, age, income quintiles, education and workforce participation. On average, approximately 50% of the respondents are female, with a mean age of around 37 years. With respect to income distribution, 16% belong to the poorest quintile, 17% to the poorer quintile, 20% to the middle quintile, 22% to the richer quintile and 25% to the richest quintile. Regarding education, 19% have attained primary education or below, while 65% have completed secondary education and 16% have completed tertiary or higher education. Furthermore, 41% of the respondents are active participants in the workforce.
In terms of financial inclusion, nearly 59% of individuals hold a financial account. In comparison, 66% reported saving and 23% secured a loan from a financial institution over the last year of the time of survey. Around 70% of respondents own a debit card, whereas use of credit cards and mobile payments remains relatively limited at 11% and 7%, respectively. In addition, Table 1 also summarises the barriers to financial inclusion: reasons for not owning an account are too far away 8%, high costs 23%, lack of trust 20%, lack of documentation 10% and religious reasons 18%. Other barriers include a lack of money 66%, reliance on a family member’s account 27% and perceiving no need for financial services 32%.
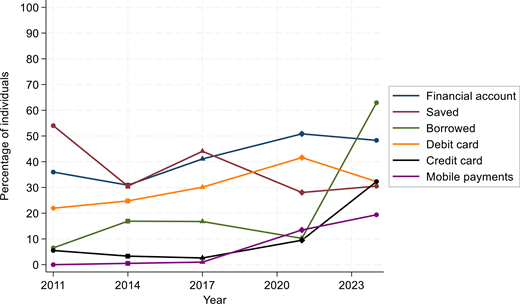
Figure 1 illustrates the trends in financial inclusion (2011–2025) for financial account ownership, saving and borrowing in Jordan. The percentage of individuals with a financial account shows a rise over the decade. While there was a decrease from around 36% in 2011 to a low of approximately 31% in 2014, account ownership recovered significantly, reaching its highest point at about 50% in 2021. In contrast, the use of accounts for saving was highly volatile. It saw a sharp decline from around 54% in 2011 to 31% in 2014 and, after a temporary increase in 2017, it dropped again to its lowest level of roughly 30% in 2025. Borrowing behaviour, however, rose from 6% in 2011 to a stable 16% in both 2014 and 2017, before declining to around 10% in 2021. It then surged sharply in 2025, exceeding 60%.
Figure 1 also highlights the evolving landscape of digital financial services in Jordan, particularly in terms of card ownership and mobile payments. The use of debit cards showed a strong and consistent upward trend, rising steadily from about 22% in 2011 to over 40% in 2021, before slightly declining to around 30% in 2025. This pattern reflects a significant shift towards cashless transactions. Credit card ownership, which was initially low and continued to decline through 2017, rose sharply to nearly 9% in 2021 and further increased to around 30% by 2025. Most notably, mobile payments experienced explosive growth, staying at or near zero until 2017, before surging to over 10% in 2021 and reaching more than 20% by 2025. This rapid adoption of mobile payments reflects a profound shift towards digital financial services in the latter half of the decade, likely accelerated by technological advancements and the convenience of digital transactions.
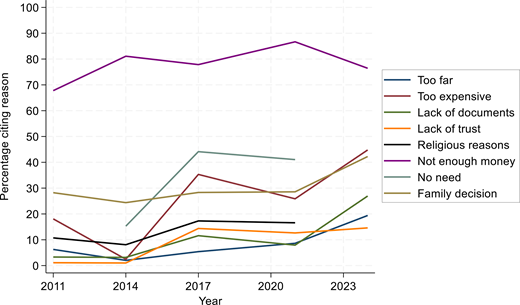
Based on Figure 2, illustrating the barriers to financial accounts, the most dominant and consistently high barrier is the lack of money, which remains the primary reason for not having a financial account throughout the entire period. While this barrier briefly dropped in 2014, it surged to its highest level by 2021, affecting over 80% of individuals. The following two most common barriers, “too expensive” and “no need for financial services”, exhibit significant fluctuations; the former peaked in 2017 before declining, while the latter saw a major increase from 2014 to 2017 and then a slight decrease. Other barriers, such as a lack of documentation, being too far away and religious reasons, remained at consistently low percentages, generally staying below 20%. Interestingly, the perception that a family member already has an account, was an obstacle in 2011, showed a continuous trend over the decade.
4.2 Linear probability model results: financial inclusion indicators
Table 2 presents the LPM estimates of equation (1). The results show that various socio-economic characteristics are significantly associated with financial inclusion. It is observed that being a woman increases the probability of having a formal account and a debit card by 5.2 and 4.1 percentage points, respectively. However, female individuals are less likely to have a credit card and to use mobile payments than male individuals by 2.3 and 4.4 percentage points, respectively. These results are in line with the findings of Zins and Weill (2016) and Kumar and Pradhan (2024). Our analysis reveals that age has a positive influence on five financial inclusion measures. At the same time, its squared term shows a negative effect, indicating an inverted U-shaped relationship. This pattern implies that engagement with formal financial services increases with age up to a certain point, after which it begins to taper off. The finding highlights that older adults appear less inclined to adopt or maintain formal financial service use. This could also reflect limited outreach efforts by financial institutions towards senior populations, a similar finding by Allen et al. (2016).
Furthermore, higher income is strongly linked to greater financial inclusion, suggesting that income is a key determinant of access to and use of financial services. The coefficients for income quintiles are positive across five financial inclusion indicators relative to the lowest income group. For instance, compared to the poorest group, the individuals in the richest quintile are 21.9 percentage points more likely to own a financial account and 23.5 percentage points more likely to have a debit card. However, income has little effect on borrowing, indicating that higher-income individuals are not necessarily more likely to borrow from formal sources.
Education stands out as a particularly influential factor in determining financial inclusion, with a consistently positive association across all panels. Individuals with secondary education are 11.7 percentage points (pp) more likely to have an account, 7.7 pp more likely to save, 12.2 pp more likely to hold a debit card, 4.0 pp more likely to have a credit card and 1.7 pp more likely to use mobile financial services compared to those with only primary education. This trend is even more pronounced for individuals with tertiary education, who are 36.2 pp more likely to have an account, 24.9 pp more likely to save, 6.1 pp more likely to borrow, 37.4 pp more likely to hold a debit card, 16.2 pp more likely to have a credit card and 7.3 pp more likely to use mobile financial services. These results suggest that higher levels of education are strongly linked with high financial utilisation.
Table 3 presents the results of the LPM estimations for financial inclusion indicators, account ownership, savings, borrowing, debit card, credit card and mobile payment use, with interaction terms between education and gender. The results indicate that education and income remain strong predictors of financial inclusion. Individuals with higher income levels, particularly those in the richest quintile, are significantly more likely to hold accounts, save formally and use debit and credit cards compared to those in the lowest income group. Similarly, higher education levels, especially tertiary education, are positively associated with all financial inclusion indicators, reflecting the importance of education in promoting financial awareness and engagement.
To examine gender differences in the impact of education, we included interaction terms between education and gender. The coefficients for secondary and tertiary education among females are largely insignificant across all indicators, indicating that while education increases financial inclusion overall, its effect does not differ meaningfully between males and females. This suggests that higher education alone does not fully explain why women are slightly more likely to hold accounts and debit cards, and an increase in labour force participation, digital literacy, social norms or national policies may also play a role in shaping women’s engagement with formal financial services. Overall, there is no strong evidence of gender inequality in financial inclusion in Jordan.
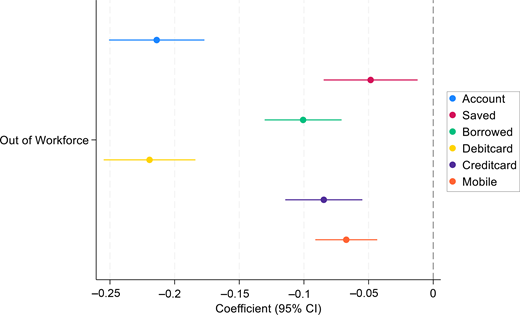
Figure 3 presents the impact of being outside the workforce on various indicators of financial inclusion for the years 2017, 2021 and 2025, the only survey periods that included data on workforce participation. The findings consistently reveal that individuals not part of the labour force are less likely to enjoy financial inclusion across all examined indicators. The negative effects are particularly evident in account ownership and debit card usage, highlighting the impact that employment status has on access to and use of formal financial services. While the negative impacts on saving, borrowing, credit card ownership and mobile payments are smaller, they still indicate that those outside the workforce encounter significant barriers to financial participation, likely due to income. These results emphasise the crucial role of labour market engagement in fostering inclusive financial systems.
4.3 Linear probability model results: financial inclusion barriers
Table 4 presents the relationship between demographic and income factors and the barriers to financial inclusion. The decision not to hold a financial account can stem from either voluntary or involuntary factors (Allen et al., 2016). Voluntary reasons reflect personal choice, such as religious beliefs, no need for financial services, insufficient funds, or reliance on a family member’s account. In contrast, involuntary reasons arise from market or supply-side constraints, including extended distances to financial institutions, high transaction costs, stringent documentation requirements, or lack of trust in financial providers. Distinguishing between these voluntary and involuntary factors is crucial for designing targeted policies that address the specific barriers to financial inclusion.
Based on the estimation results in Table 4, gender is associated with specific barriers to financial inclusion. Women are significantly more likely to report being “too far away” from financial institutions and cite “religious reasons” as barriers to account ownership. In contrast, the coefficient for “a family member has an account” is negative, suggesting that women are less likely to open an account when another household member already does. However, as shown in Table 5, when considering the interaction between gender and education, the barriers “a family member has an account” and “no need for financial services” become particularly important for women. These results indicate that for women, the main reasons for not having an account are voluntary, reflecting personal or household preferences, rather than supply-side constraints or market failures. This finding aligns with the Zins and Weill (2016). While distance, cost and documentation requirements remain barriers, they are insignificant in explaining why women do not hold accounts.
In addition, age shows in Tables 4 and 5 a non-linear relationship to several barriers to financial inclusion. The coefficients for age and age squared are positive and negative, respectively, and statistically significant for the “lack of money” barrier. This indicates an inverted U-shaped relationship, suggesting that middle-aged individuals are more likely to cite a lack of money as a reason for not having an account. At the same time, this effect declines at older ages. In contrast, “lack of documentation” and “family member has an account” display a U-shaped relationship with age. This implies that younger and older individuals are more affected by these barriers compared to middle-aged people. These patterns suggest that financial barriers evolve over the life cycle, with economic constraints more relevant for younger adults and institutional or family-related factors becoming more important at older ages.
Tables 4 and 5 show that income level is significantly associated with several barriers to financial inclusion. Individuals from higher-income groups are less likely to report barriers such as “too expensive” and “lack of money” compared to the poorest groups. Specifically, the coefficients for “too expensive” and “lack of money” are negative for richer and richest groups, suggesting that as income increases, these barriers become less relevant. Similarly, the poorest individuals are less likely to report “a family member has an account” as a barrier, while this reason becomes more pronounced among middle- and higher-income groups.
In Tables 4 and 5, the results show that higher levels of education, specifically secondary and tertiary education compared to primary, are negatively associated with barriers such as “lack of documentation” and “lack of money” (Table 5). This suggests that as individuals attain higher education, these barriers to financial inclusion become less significant. Conversely, suppose a family member has an account. In that case, it is positively associated with education, indicating that even among more educated individuals, Jordanian household are less likely to open their own account when another family member already possesses one.
The interaction terms in Table 5 between education and female are positively associated with the barriers “a family member has an account” and “no need for financial services”, indicating that educated women, particularly at the secondary level, are more likely than educated men to cite these reasons for not having an account. For the other barriers, the interaction terms are not statistically significant, suggesting that gender differences in financial inclusion among educated individuals are primarily observed in household account ownership and perceived lack of need, while other barriers affect men and women similarly.
Finally, Table 6 illustrates how being outside the workforce affects various barriers to financial inclusion for 2017, 2021 and 2025, the only survey periods that captured data on workforce participation. The findings reveal that those not in the labour force are much more likely to cite “a family member has an account” as their primary reason for not owning an account. This points to a dependence on other household members for financial access, highlighting indirect involvement in the financial system rather than direct participation. Other barriers do not show significant relationships, suggesting that the main challenge for individuals outside the workforce is not so much about access or trust, but more about the substitution effect within their households. These insights emphasise how employment status impacts individual financial independence and illustrate the vital role of labour market participation in promoting broader financial inclusion.
4.4 Robustness check
Table 7 presents the marginal effects derived from the Probit model estimates of equation (1), as a robustness check to Table 2’s LPM results. Overall, the direction, size and statistical significance of the coefficients remain consistent across both models, bolstering the reliability of our main findings. The marginal effects of gender, age, income and education on financial inclusion indicators show stability. For example, individuals with tertiary education are 36.2 pp more likely to own an account in the LPM and 35.8 pp more likely in the Probit model, while those in the richest income quintile are 21.9 pp more likely to own an account (LPM) and 22.2 pp more likely (Probit). Gender effects are smaller and vary by indicator: females are more likely to have an account and a debit card but less likely to own a credit card or use mobile services, with magnitudes similar across both models. Age has positive effects on account ownership, borrowing and debit card use, with diminishing returns at older ages (captured by the negative Age2 term). Overall, the Probit marginal effects confirm the magnitude and economic significance of the LPM results, demonstrating that education and income are key drivers of financial inclusion in Jordan, while gender and age have more nuanced effects and borrowing is less sensitive to socio-economic characteristics.
5. Conclusion
Financial inclusion plays a vital role in fostering economic growth and promoting inclusive development by reducing poverty and inequality while integrating marginalised groups into the financial system (Demirgüç-Kunt and Singer, 2017; Polloni-Silva et al., 2021). Building on earlier studies, such as Shaheen (2025) and Le Quoc (2025). Also, despite ongoing efforts, recent evidence indicates that Jordan still lags behind comparable countries in both access to and use of financial services [Central Bank of Jordan (CBJ), 2023]. To address this gap, this paper provides a comprehensive analysis of financial inclusion in Jordan, exploiting repeated cross-sectional data from the World Bank’s Global Findex surveys over five waves (2011, 2014, 2017, 2021 and 2025). Its contribution is threefold. Firstly, it maps the dynamics of financial inclusion and barriers in Jordan over a decade, showing trends in account ownership, savings, borrowing and the use of digital financial services. Secondly, it highlights the experiences of vulnerable groups, including differences by education, income, gender and age, offering insights into who remains excluded and why. Thirdly, unlike previous studies that rely on a single wave or small-scale surveys, this research uses the full set of available Findex waves for Jordan, enabling temporal comparisons and identification of structural shifts in financial inclusion.
According to our analysis, 41% of Jordanians hold a financial account. However, Figure 1 shows that account ownership increased steadily from 2011 to 2021 but stalled thereafter, suggesting that recent progress in financial inclusion has slowed. While more people now have access to basic financial services, many still struggle to use them effectively. Saving and borrowing patterns remain weak and unstable, reflecting a limited ability or willingness to engage with formal financial systems. Although digital financial services, such as debit cards and mobile payments, have grown notably in recent years, these improvements have not fully translated into widespread inclusion across all income and education levels. Figure 2 further highlights that the main reason for financial exclusion remains a lack of money, followed by high costs and a perceived lack of need for financial services. Other barriers, such as distance, documentation and religious concerns, remain less significant but persist among specific groups. Altogether, these findings indicate that while Jordan has made progress in expanding financial access, the benefits remain uneven. Strengthening financial literacy, promoting affordable and inclusive financial products and integrating digital solutions for low-income and rural populations are crucial steps to sustain and deepen financial inclusion in the coming years.
Our analysis shows that socio-economic characteristics play a central role in financial inclusion. Women are slightly more likely to hold accounts and debit cards, but interaction terms show that the positive effects of education do not differ significantly between men and women. Age has a positive but diminishing effect. Income strongly predicts inclusion, with the richest quintile far more likely to own accounts, save and use cards compared to the poorest. Education is the strongest determinant, as secondary and tertiary levels substantially boost financial participation across all indicators, including mobile money.
Barriers also vary women mention distance, wealthier groups rely on family accounts, older people note issues with money and distance and the less educated face challenges with documentation. Tertiary education reduces affordability and documentation barriers, highlighting its role in overcoming structural barriers. Policymakers should promote digital adoption among women, expand outreach to rural and older populations and address cost and documentation barriers for poorer groups. Strengthening financial literacy, expanding digital infrastructure and simplifying requirements can ensure more equitable financial inclusion and contribute to Jordan’s development.
To effectively address stalled progress, Jordanian policymakers should align interventions with the Central Bank of Jordan’s (CBJ) instructions for the basic bank account (No. 1 / 2019). Specifically, the CBJ should strengthen the enforcement of mandated “no-frills” accounts by strictly capping or eliminating monthly maintenance fees and minimum balance requirements. Critically, to align with global best practices in developed economies and promote a “less-cash” society, Jordan should implement a policy of zero-rated domestic online transfers. Eliminating fees for peer-to-peer and digital payments reduces the incentive to withdraw cash, thereby increasing the frequency of interactions with formal financial institutions and deepening the domestic financial ecosystem. To support this, Jordan should move towards a more robust tiered Know Your Customer (KYC) system that allows low-risk individuals to open basic accounts using only a national ID, bypassing the traditional requirement for formal salary slips. Furthermore, to bridge the distance barrier, the government should leverage the National Financial Inclusion Strategy (2023–2028) to expand the agent banking network, allowing local merchants and post offices to serve as cash-in/cash-out points. Finally, to ensure these tools are utilised by less educated segments, all financial contracts should be simplified into plain-language Arabic, supplemented with visual aids, so that all Jordanians can navigate the formal system with confidence.
While the study identifies actionable policy interventions, such as promoting digital literacy among women, expanding agent banking in rural areas and simplifying documentation requirements, it also recognises structural limitations. Labour market constraints, digital inequality and limited access for refugee populations constrain the reach and effectiveness of policy measures, underscoring that improving financial inclusion requires coordinated, context-aware strategies beyond banking reforms alone. As well as data on the number of ATMs or the availability of bank branches at the neighbourhood level, these measures are not available in the Findex surveys. Future research could include them to better assess the role of physical access in shaping financial inclusion.
Overall, this study provides a clear picture of the current state, trends and barriers to financial inclusion in Jordan. The evidence highlights the need for targeted, data-driven policies that address the diverse challenges faced by different population groups, predominantly low-income, less educated and vulnerable individuals. To effectively promote inclusive financial participation.
Note
See Our world in Data for more details Link to ourworldindataLink to the cited article”