This paper aims to expand the emerging literature on COVID-19 and the financial markets by searching for a relationship between the uncertainty of the first phase of the COVID-19 pandemic experienced through social media and the extreme volatility of the Italian stock market.
The authors analyze the relationship between social media and stock market trends during the first phase of the COVID-19 pandemic through the lens of social theory and Baudrillard's simulacra and hyperreality theory. The authors conducted the data analysis in two phases: the emotional and Granger correlation analysis by using the KPI6 software to analyze 3,275,588 tweets for the predominant emotion on each day and observe its relationship with the stock market.
The research results show a significant Granger causality relation between tweets on a particular day and the closing price of the FTSE MIB during the first phase of the COVID-19 epidemic. The results highlight a strong relationship between social media hyperreality and the real world. The study confirms the role of social media in predicting stock market volatility.
The findings have theoretical and practical implications as they reveal the relevance of social media in our society and its relationship with businesses and economies. In an emergency, social media, as an expression of users' feelings and emotions, can generate a state of hyperreality that is strong correlated with reality. Since social media allows users to publish and share messages without any filter and mediation, the hyperreality generated is affected by highly subjective elements.
This research is different from the previous ones on the same topic because unlike previous studies, conducted under normal or simulated scenarios, this study is focused on the first phase of an unpredictable and unforeseen emergency event: the COVID-19 pandemic. This research adopts a multidisciplinary approach and integrates previous studies on the economic and financial effects generated by social media by applying well-known theories to a new and unexplored context. The study reveals the significant impact generated by social media on stock markets during a global pandemic.
1. Introduction
On January 30, 2020, the Spallanzani Institute in Rome officially confirmed the first two cases of COVID-19 in Italy: a couple of Chinese tourists coming from the Wuhan Province. The day after, January 31, the Government of Italy declared a state of emergency and the World Health Organization (WHO) declared a public health emergency of international interest. However, it was only on March 11 that COVID-19 was declared a pandemic by the WHO. In Italy, the first official case of secondary transmission was confirmed on February 18, 2020 (Italian Higher Institute of Health, 2020). In a short time, the virus spread to the rest of the country. On February 22, the government launched a decree to counter the transmission of COVID-19, initially limited to some hotbed areas. In a few days, the epidemic spread to Northern Italy, the production and economic center of the country. By March 9, 2020, more than 8,342 people in Italy had contracted COVID-19, creating great difficulties for the national health system (Italian Higher Institute of Health, 2020). To limit the spread of the infection, the Government of Italy imposed strict restrictions on the movement of individuals in the entire national territory from March 10 until May 3 (Italian Ministry of Health, 2020). During this period, severe social isolation regulations were imposed, and people were allowed to leave their homes only for limited and documented purposes. In Italy, the economic and psychological impact of the epidemic has been enormous. Numerous activity centers, including schools, universities, museums, cinemas, theaters and shops selling non-essential goods, were temporarily closed and companies and public institutions were invited, whenever possible, to authorize work from home. While the productive life of the country stood still, the Milan stock exchange never stopped trading.
After China, Italy was the first country to face this health emergency shattering the widespread belief among Western countries that the virus was and would remain far from their borders. This caused immense social tension, fear and uncertainty in Italy. On March 9, riots broke out in prisons in different cities leading to deaths, hospitalizations and even escapes. Within a few days, the whole country was catapulted into a kind of hyperreality where the media were the only tool for information and contact for the people. Fear and anxiety were the predominant feelings in the first few days of the lockdown (Mazza et al., 2020).
During the first phase of the pandemic, the term infodemic was frequently used. The WHO (2020) defined the infodemic as an overabundance of information – some accurate and some not – during an epidemic. Infodemic makes it hard for people to find trustworthy sources and reliable guidance, since misinformation, like pathogens in epidemics, spread further and faster making health emergency responses more complex. The WHO declared that they are currently fighting not only an international epidemic but also the social media infodemic (Hao and Basu, 2020). Social media has accelerated the reach of information – and misinformation – worldwide, fueling panic and fear among people because users of social media can use the platforms to express their emotions, feelings and thoughts.
In extant prior literature, limited attention has been paid to how epidemics, let alone pandemics, impact financial markets (Goodell, 2020). The COVID-19 pandemic offers a lot of stimulating insights to study many market phenomena (Okorie and Lin, 2020) in a real, unforeseen and “suggestive” scenario. This study contributes to both the literature on financial markets in crisis period and on social media, by studying – using a multidisciplinary approach – the impact of the COVID-19 pandemic, interpreted through the social media, on the stock market and financial decisions. More specifically, the paper adopts the lens of social theory, Baudrillard's simulacra and hyperreality theory to establish the extent of social media impact, particularly Twitter, on financial decisions and thus, stock market performance in the first phase of the COVID-19 pandemic. The hypothesis underlying the study is that during the first phase of the COVID-19 pandemic, a sort of hyperreality was created through social media, generating a social impact that influenced feelings, thoughts, behaviors and consequently produced real actions and reactions. Since Twitter is considered one of the most influential platforms for capturing public sentiments (Bollen et al., 2011; Nisar and Yeung, 2018), this study correlates the trend of conversations on Twitter to the value of the stock market. The study uses sentiment analysis (Guijarro et al., 2019; Daniel et al., 2017; Duz and Tan, 2020) to understand the emerging moods in the first period of the pandemic.
This study is structured as follows. In sections 2 and 3, a literature review and a theoretical framework, respectively, are proposed and defined, followed by a presentation of the research method in section 4. Subsequently, in section 5, the study illustrates the use of Twitter and the sentiments of users in the first phase of the lockdown in Italy. The last section discusses the findings and proposes the final considerations.
2. Literature review
The literature has widely demonstrated that investors' decisions are influenced by news (Barber and Odean, 2008), media (Engelberg and Parsons, 2011) as well as past performances. Studies have shown that the stock market is influenced by the predominant sentiment in news or media (Ruan et al., 2018) and that news media content could predict movements in market prices (Yu et al., 2013; Cade, 2018). While Shiller (2000) argues the market sentiment is driven by news content, Nofsinger (2005) proves that financial decisions are driven significantly by emotions demonstrating that public mood and feelings play an equally important role as news in influencing stock market trends (Bollen et al., 2011). Content of emotions is also crucial in determining whether people engage in systematic or heuristic processing (Tiedens and Linton, 2001), and negative sentiments (i.e. sadness, anxiety, fear) and anxiety are associated with a greater sense of uncertainty (changing the decision-making capacities of the subjects). Emotions play a significant role in human decision-making as well as the news (Loewenstein, 2000; Taffler et al., 2017). Both neo-institutional sociology (Fogarty and Rogers, 2005; Chen et al., 2014) and behavioral finance (Macintosh et al., 2000) argue that analysts arrive at recommendations as a result of institutional pressures rather than calculative practices (Imam and Spence, 2016). Garcia (2013) suggests that investors' sensitivity to news is most pronounced when they are going through hard times. A growing number of studies have focused on the role of social media in influencing investors and financial markets (Cade, 2018; Gomez-Carrasco and Michelon, 2017) demonstrating that sentiment on social media is negatively correlated to the stock market indexes (e.g. Zhang et al., 2011). Recent studies suggest that social media can be used to predict changes in economic indicators and the stock market (Bollen et al., 2011; Mittal and Goel, 2013; Duz and Tan, 2020) and used in disasters or emergencies (Castillo, 2016). Studies indicate that the stock market is influenced by emotion in social media (Ge et al., 2020), confirming that emotionally charged content, especially the negative ones (Berger and Milkman, 2012), tends to elicit more tweets (Stieglitz and Dang-Xuan, 2013), highlighting that the risk sentiment has a negative prediction on stock returns (Li et al., 2014).
Social media is characterized by a dynamic and bidirectional exchange of different types of content among users that provides the ability to publicly express questions, spread news, exchange sensations, emotions and ideas (Kaplan and Haenlein, 2010). As argued by Enzensberger (1970, p. 13), “the media make possible a mass participation in a productive process at once social and socialized, a participation whose practical means are in the hands of the masses themselves”. Social media creates what Baudrillard (1968, 1994) calls a hyperreality state, where binary oppositions, real/unreal, subject/object, private/public, human/machine, implode and a world of simulacra becomes the reality for participants (Dahlberg, 2001). According to Baudrillard, hyperreality is “a question of substituting the signs of the real for the real” (Baudrillard, 1983, p. 4), and hyperreality is characterized by the omission of metaphysical representation (Baudrillard, 1983). Simulacra and hyperreality are proposed by Baudrillard as a radical description of postmodern society (Baudrillard, 1994). Baudrillard remarks that “the everydayness of the terrestrial habitat hypostatized in the space marks the end of the metaphysic, and signals the beginning of the era of hyperreality: that […] is from now on projected, entirely without metaphor, into the absolute space of simulation” (Baudrillard, 1994, p. 43). Baudrillard (1994) suggests that the world is accelerating toward a fourth order of simulacra (the fractal order) in which the virtual would completely colonize the real. In complex environments, such as a pandemic where emotions are predominant, the observation of a phenomenon by an observer, even if real, perturbs reality itself and creates a sort of hyperreality. Such hyperreality is the transposition of the real perturbated by the emotions of the observer.
3. Theoretical framework
According to Baudrillard's (1968, 1994) concept of “simulacrum,” people interpret reality through words and images swapped via media. During the critical phase of the health emergency – lockdown – social media represented a fundamental aspect of social cohesion. When the health authorities and the government imposed social isolation and all gatherings in public spaces were forbidden, social networks were the primary object and space of communication (Lefebvre, 1991).
The COVID-19 pandemic has been defined as the first social media pandemic (Guynn, 2020). In this context, it is even more evident how profoundly social media has changed the way information is published and consumed. On social media, people could create and publish real-time material around the world without any kind of filter or moderation. The economic, cultural and social life of the whole country was conducted through the web making social media a great virtual square in which exchange of ideas, information, news, moods, hopes, fears and concerns takes place.
Through Twitter, users can transmit, in real-time, messages that became a subjective representation of reality via signs. Although each individual user post is limited to 280 characters, the aggregate of millions of tweets may provide an accurate representation of public mood and sentiment (Bollen et al., 2011). Each tweet embodies all three fundamental dimensions of language – syntactic, semantic and pragmatic – so that all the meanings transmitted are intersubjective, namely each “sign can be exhaustively determined by another person” (Morris, 1937, p. 66). Each tweet can be understood as a simulacrum, that is, representations of reality through signs: social media narrates a reality filtered through users' eyes and emotions. During the lockdown, the consequences of such a transposition have gained attention; the social life of Italy moved into a sort of hyperreality, making the image of Anderson's imaginary community (1983) come alive. As in Anderson's imagined community, it is impossible to be on Twitter without knowing and “meeting” other residents of this virtual place. This is true even though people use Twitter to promote their ideas, swap information, convey what they are doing or feeling, or follow others (Signorini et al., 2011). Social media generates, what Latané (1981) defines as a social impact that influences feelings, thoughts, or behaviors through real, implicit, or imagined actions or reactions of others.
4. Methodology
Volume and sentiment analysis of user-generated content (UGC) is gaining interest in different areas of study. In literature, these methods have been used to predict the results and successes of political elections (Jungherr, 2016), films, books, music albums (Wallach, 2014) and even financial market movements (Yang et al., 2015). Studies have shown a correlation between high levels of social media activity and abnormal market returns (Bollen et al., 2011). Accordingly, this study is based on the hypothesis that during the first phase of the COVID-19 pandemic, a sort of hyperreality was created through social media, generating a social impact that influenced feelings, thoughts, behaviors and consequently produced real actions and reactions. Therefore, we used Twitter to understand if a state of hyperreality has been created through social media and then to look for a relationship between the state of hyperreality and real action on stock market performance. Specifically, our research has been conducted by analyzing tweets using the KPI6 software through which Twitter data corresponding to specific queries were collected and analyzed. This software allows us to estimate the sentiment of the tweets collected through its proprietary algorithm of emotional analysis based on artificial intelligence.
A total of 3,275,588 tweets in the Italian language were collected from January 13 to April 9, 2020. January 13 was chosen as the start date as it is one of the first days in which the number of tweets related to COVID-19 spiked. The final date was chosen as April 9 because the number of tweets generated daily during the previous week had reduced significantly. The software used to compose the queries provides a preview of the most relevant and related words and hashtags. This feature is useful to improve the quality of the query.
For this study, the following hashtags were selected and mined:
#covid19;
#coronavirus;
#iorestoacasa (#Istayathome);
#covid;
#coronavirusitalia (#coronavirusItaly);
#covid 2019;
#CoronaVirusChallenge;
#restateacasa (#stayathome);
#covid19italia (#covid19Italy);
#Covid_19.
As noted above, this study only considers tweets in the Italian language. The language (lang) parameter is provided by Twitter and returns only the tweets posted in the selected language. For this purpose, the lang parameter “it” (Italian) was set to filter the tweet collection. While previous studies (e.g. Nisar and Yeung, 2018) analyzed only posts containing hashtags, in this study, it was decided to include words without hashtags, such as Covid, coronavirus and COVID-19, making the analysis more extensive.
The data analysis was conducted in two phases: the emotional analysis and the correlation analysis. The first phase (emotional analysis) aims to understand the emerging moods in the first period of the pandemic. This analysis allows us to understand if a state of hyperreality (Baudrillard, 1983) has been created during the lockdown period. The emotional analysis considers reality and its perception by users. It has been proven that when we conceptualize, specific areas of the brain are activated, and completely different areas are activated when we feel pain, pleasure, or anything else. Consequently, it is necessary to distinguish between reality and our perception – including the representation of reality (Mattessich, 2003). Emotions often push the perception of risk beyond concrete information. At the same time, the information being spread can strongly influence people's behavior (Sharot and Sunstein, 2020). To extrapolate moods related to particularly significant events and news, the emotional analysis was conducted on a sub-period. The sub-period (January 31 to March 11) was selected according to the peaks observed in the number of tweets on COVID-19-related topics. The sentiment analysis algorithm was trained on 1.3 million tweets, using the representations of the bidirectional encoders of Transformers BERT and Wide Convolutional Neural Network – Wide CNN. BERT is a Google language model used to better understand the complete context of texts, while CNN has a convolutional layer to extract information from texts to better understand the content of a sentence and allow the algorithm to analyze emotions.
The emotional analysis was conducted by adopting an eight-label scale representing the emotional range: admiration, joy, sadness, fear, surprise, anger, disapproval, smile and boredom. The labels are automatically established using KPI6 software taking advantage of DeepMoji model (Felbo et al., 2017). The DeepMoji model used performs supervised machine learning on tweets with emojis as noisy labels and is able to project each word into a vector space and to capture text using a two bidirectional long short-term memory (LSTM) layers (Hochreiter and Schmidhuber, 1997). The emotion contained in each sentence was extracted and then classified according to a predefined classification of emotions. The model used is able to automatically recognize which emoji are included in a tweet by using an attention mechanism that let the model determine the importance of each word for the prediction task by weighing them when constructing the representation of the text. According to Felbo et al. (2017) if the model used is able to understand which emoji is included in a given tweet, then it will have a good understanding of the emotional content of the sentence.
Based on the analysis of tweets, the second phase (correlation phase) aims to look for a relationship between the state of hyperreality and financial decisions and thus on stock market performance. The analysis is based on the correlation between the Financial Times Stock Exchange of Milan (FTSE MIB) closing price and the volume of tweets related to COVID-19 from January 13 to April 9. The FTSE MIB index has been chosen since it measures the performance of the 40 most-traded stock classes of the Italian stock market and, thus, is considered a benchmark for Borsa Italiana SpA. Finally, we chose Investing.com to collect the daily closing price of FTSE MIB.
5. Data analysis
5.1 Emotional analysis
To collect evidence of the public mood during the lockdown, the emotional analysis was run in conjunction with the most relevant events related to COVID-19 reported by the National Associated Press Agency (ANSA). Five significant dates were selected:
January 31: authorities reported the first two cases of people with COVID-19 in Italy;
February 21: COVID-19 outbreak in Codogno (Lombardy);
February 24: Italy recorded the third-highest infected people in the world, over 150 cases and 3 deaths;
March 9: entire Italy is red zone;
March 11: OMS declares SARS-CoV-2 pandemic.
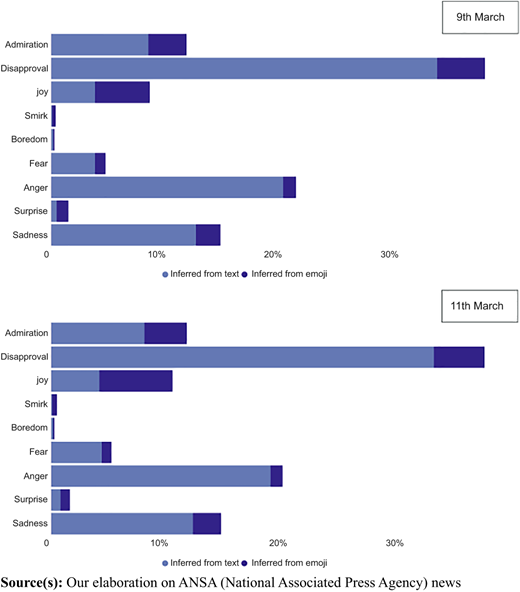
In Figure 1, the events are automatically ranked using KPI6 software, according to the type of emotions and the respective degrees. For each of them, the degree has been obtained by the sum between the value inferred from text and the value inferred from emoji. The graph was obtained by classifying each tweet, on each of the five selected dates, using the emotion analysis algorithm DeepMoji. For each emotion included in the spectrum was assigned a confidence level between 0 and 100. When an emotion related to a tweet exceeded the confidence level of 40, the tweet has been automatically assigned that specific emotion. Finally, the sum of tweets related to each emotion was converted into the percentage represented in the graph.
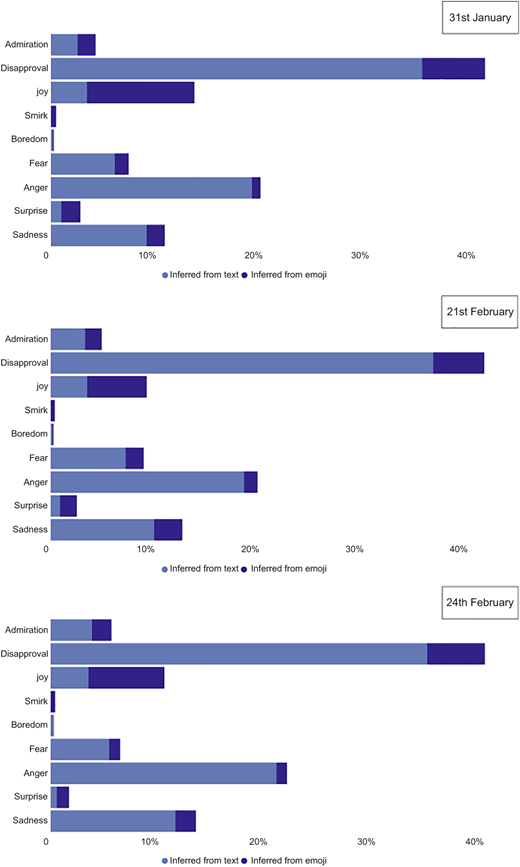
Value inferred from text indicates the percentage of tweets associated with emotion inferred through text, while the second one indicates the percentage of tweets associated with emotion inferred through emojis. As shown in Figure 1, negative emotions such as fear, disapproval, anger and sadness maintain high levels during each event. These findings, considering the high number of tweets analyzed, can be used as a proxy of the type of mood and changes in feelings that occurred in Italy during the first phase of the blockade. The hyper-use of social media, including Twitter, created through each tweet (simulacrum) a sort of hyperreality in which the social life of the country was thrown into the initial phase of the pandemic. The results show that the level of disapproval, the main emotion that emerges, slightly decreased in March. This is probably due to the increase in admiration expressed in the tweets regarding doctors' work and the measures taken to limit the spread of the epidemic. Except for sadness and fear, other emotions maintained a constant level during all the events analyzed.
5.2 Correlation and Granger causality analysis
After establishing both types of feeling and mood shown by Twitter users during the most critical days of the initial phase of the COVID-19 pandemic, we focus on the question of whether the volume of tweets concerning the pandemic is related to changes in the stock market, in particular the closing price of the FTSE MIB. To answer this question, we first look for a correlation between FTSE MIB closing price and the volume of tweets related to COVID-19 for a given day and then apply the technique of Granger causality suitable to study if the lagged values of a variable X (i.e. the stock market close value) exhibit a statistically significant correlation with a second variable Y (tweets' volume). Correlation, however, does not prove causation. We, therefore, use Granger causality analysis (Bollen et al., 2011) not for testing actual causation but to verify whether one time series has predictive information about the other or not. As already noted, the Tweets time series has been obtained from 3,275,588 tweets published in that period (88 days), while the FTSE MIB closing prices have been collected from Investing.com.
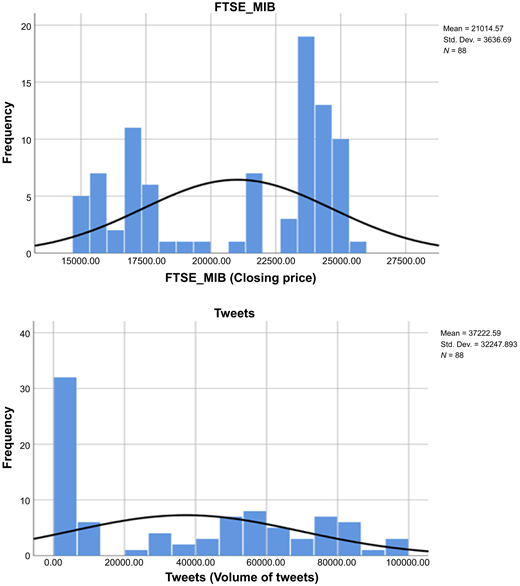
In Table 1 are presented the descriptive statistical parameters of Tweets and FTSE MIB distributions used in the study and in Figure 2 the distribution of the variables analyzed.
Descriptive statistical parameters
| FTSE MIB (closing price) | Tweets (volume of Tweets) | |
|---|---|---|
| N (days) | 88 | 88 |
| Mean | 21,014.5716 | 37,222.5909 |
| Median | 23,163.7350 | 39,035.5000 |
| Mode | 14,894.44a | 10.00a |
| Std. deviation | 3,636.68981 | 32,247.89310 |
| Variance | 13,225,512.81 | 1,039,926,609.00 |
| Range | 10,583.11 | 97,347.00 |
| Minimum | 14,894.44 | 10.00 |
| Maximum | 25,477.55 | 97,357.00 |
Note(s): aMultiple modes exist. The smallest value is shown
5.2.1 Correlation analysis
To correlate the FTSE MIB closing prices and the volume of tweets related to COVID-19, each variable has been normalized using z-scores. The z-score is defined as:
In the formula, x is the value of the series to be normalized, the mean, and is the SD. Z-score enables us to compare, on the same scale, the two series even though they have two different normal distributions.
Since the stock exchange does not operate on public holidays and weekends, it was necessary to determine the missing values. Considering that stock exchange data usually follow a concave function, to maintain the validity of the study, the missing values were approximated by applying a concave function (Mittal and Goel, 2013). Consequently, if the closing price of the FTSE MIB for a given day was x and the next available closing price was y with n missing days in between, the missing data were approximated by estimating that the value of the first day after x is (y + x)/2. The same method was used to determine the other missing values. By normalizing the data, the Pearson's correlation can be applied to determine the intensity of the relationship between FTSE MIB closing price and tweets related to COVID-19 for a given day.
The results showed in Table 2 show a negative correlation between tweets related to COVID-19 and FTSE MIB closing price.
Correlation matrix
| Tweets | FTSE_MIB | ||
|---|---|---|---|
| Tweets | Pearson correlation | 1 | −0.891** |
| Sig. (2-Tailed) | 0.000 | ||
| N | 88 | ||
| FTSE_MIB | Pearson correlation | −0.891** | 1 |
| Sig. (2-Tailed) | 0.000 | ||
| N | 88 | 88 |
Note(s): **Correlation is significant at the 0.01 level (2-tailed)
These findings imply that for a high volume of tweets, a low closing price can be seen correspondingly (see Figure 3). As the correlation observed (−0.891) is significantly high, it is possible to argue that the relationship between tweets and FTSE MIB closing price, during the first phase of the COVID-19 lockdown, is strong and statistically significant as the significance values observed are below the threshold p < 0.05.
5.2.2 Granger causality analysis
In our analysis, the values in the Tweets time series (Tt) are defined by the delta between day t and day t−1: Tt = Tweetst−Tweetst−1. Equally, the values in the FTSE MIB time series (FMt) are defined as FMt = FTSE_MIBt−FTSE_MIBt−1.
As previously, to maintain the same scale, we used normalized values.
To test whether Tt predicts changes in the FMt, a linear model (L1) is adopted that uses the n lagged value of both Tt and FMt as follows:
Granger's causality analysis was performed according to the L1 model for the period from January 13 to April 9, 2020. The findings (Table 3) show a high Granger causality relation between Tt and FMt with the highest significance for a lag of three days (p-value < 0.05). This allows rejection of the null hypothesis that the Tt does not predict the FMt value, accepting the alternative hypothesis that Tt has a Granger causal relationship with the FMt variations.
Granger causality analysis between Tweets and FTSE_MIB
| Lag | F | Tweets (Tt) |
|---|---|---|
| 1 day | 8.6088 | 0.004325 |
| 2 days | 4.5179 | 0.01384 |
| 3 days | 8.6457 | 5.145*10–5 |
| 4 days | 7.1773 | 6.12*10–5 |
| 5 days | 5.725 | 0.0001709 |
| 6 days | 4.7817 | 0.0004026 |
| 7 days | 5.2804 | 8.242*10–5 |
Note(s): **p < 0.05
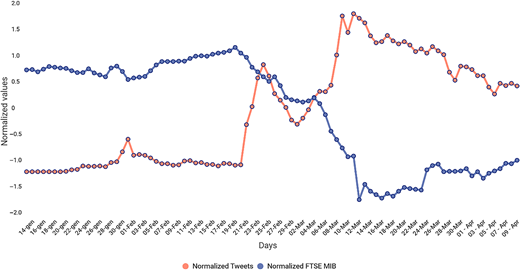
To better visualize the Granger causality correlation between Tt and FMt, the two series have been plotted (Figure 4).
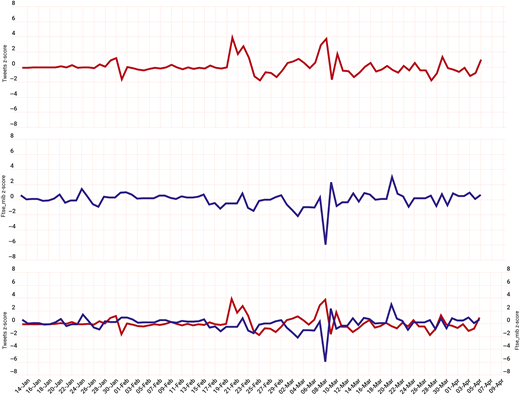
Figure 4 shows several points of overlap between the two-time series. The upper and middle graphs outline the separate Tweets and FTSE MIB time series. The third graph reveals a clear overlap between the daily differences of the Tweets values (red line), delayed by three days and the FTSE MIB values (blue line). The overlap suggests that during the period analyzed, the Tweets time series had a good predictive value for changes in the FTSE MIB closing prices that would occur three days later. The result shows that changes in the past values of Tweets (t−3) predict changes in the FTSE MIB value (t−0) as underlined by a low p-value (lagn−3, p-value = 5.145*10–5). Therefore, the analysis shows that the lagged value of Tt has a statistically significant Granger causal relation with FMt.
These findings seem to be consistent with the idea of a state of hyperreality created through social media during the first phase of COVID-19.
6. Discussion and conclusions
The use of social media characterizes many aspects of our society: consumer habits and behavior, the choice of political leaders, the formation of public opinion and more generally people's decision-making processes (Kaplan and Haenlein, 2010). Extant literature shows that social media can influence investors and financial markets (Bollen et al., 2011; Gomez-Carrasco and Michelon, 2017), demonstrating that moods and sentiments on social media are correlated to the stock market indexes (Zhang et al., 2011). Furthermore, it has been suggested that social media can be used to predict changes in economic indicators and the stock market (Mittal and Goel, 2013; Duz and Tan, 2020).
This study inspired by Baudrillard's hyperreality (1968, 1994) proposes an innovative reading of the economic and financial effects of pandemic aiming to advance the understanding of the relationships between emotions, social media and the financial market in a particular context. We adopted the very abstract concept of hyperreality to characterize the setting of the first phase of the COVID-19 pandemic.
During the lockdown, Italy's social life moved into a kind of hyperreality, fueled by social media, which contributed to make alive the image of Anderson's (1983) imaginary community. Through social media, and Twitter in particular, users can transmit, in real time, messages that become a subjective representation of reality through signs. Furthermore, in literature (Sharot and Sunstein, 2020) have been proven that emotions often push the perception of risk more than concrete information and the information spreading can strongly influence people behavior. Consequently, social media by narrating a reality filtered through the eyes and emotions of the users generated, in the emergency context of the first phase of the COVID-19 pandemic, what Latané (1981) defines as a social impact that influenced feelings, thoughts or behavior through real, implicit or imagined actions or reactions of others.
The first phase of the COVID-19 pandemic – the first social media pandemic – and subsequent lockdown acted as powerful multipliers of the role of social media, blurring the boundary between the real and the virtual. People interpreted reality through words, sentiments, moods and images. During the critical phase of lockdown, social media symbolized a fundamental aspect of social cohesion becoming the main, if not unique, channel of relationships between people; a place where real and virtual have suddenly overlapped. Considering each tweet exchanged between users as a simulacrum, the set of tweets has given rise to a hyperreality that has characterized and influenced the lives of millions of people.
First, our findings illustrate the typology of emotions and mood expressed by Twitter users on particularly critical dates for pandemic developments, identifying that negative ones like fear, disapproval, anger and sadness have been considerably high during each event. During the first phase characterized by a high degree of uncertainty – due to the unpredictability and novelty of the situation – disapproval was the main emotion that emerged. A growing feeling of admiration for the work of healthcare staff highlighted in March. The analysis performed highlights a strong emotional distress experienced by people suddenly deprived by the pandemic, of their usual sociality. The life of the whole country has been catapulted on the web in a few days, in a sort of hyperreality lived by exchanging and making their own feelings, emotions, words and images exchanged through social media.
Second, our results indicate, through the correlation and Granger's analysis, a strong relationship can be found between the intensity, in terms of frequency, of use of Twitter and the stock market trend. The study shows a negative correlation that is justified by the fact that the feelings and emotions transmitted by the users, evident expression of an extremely critical situation, were mostly negative (disapproval, anger, fear). The results obtained are consistent with previous studies that have shown that social media can be used to predict stock market volatility (Duz and Tan, 2020; Ge et al., 2020). The high degree of correlation found in the analysis can be traced back to the fact that as never before, social media has been the main tool for interaction between people. The particular and exceptional nature of the situation has created the conditions for the development, through social media, of an enhanced state of hyperreality that has made real Anderson's image of an imaginary community.
Definitively, this study contributes to a better understanding of the role played by social media during an emergency event suggesting implications for using social media to predict stock market trends. The novelty of the study is the analysis and research of the relationship between two variables: social media and the stock market, in a context difficult to replicate and repeat: a pandemic event.
Our research has some limitations related to its approach. The first limitation is that our study has been conducted only in the Italian context. Further analyses could add greater validation by extending the analysis to other countries to understand whether the influence of social media may be related to ethnocentric variables. The second limitation is that the emotional analysis has been performed just on five selected dates, corresponding to the most relevant events related to COVID-19. While we used the emotional analysis only in the first phase of our research basically to support the idea that a state of hyperreality was created during the first phase of the pandemic, further research could evaluate a possible effect of social media user's mood and sentiment, during critical and emergency events, on the stock market by researching a correlation between the volume of tweets, their emotional value and the stock market prices.