Skip to article sections
Purpose

One of the fundamental challenges in hospitality marketing is decoding the unstructured voice of the customer to predict revisit intention across diverse economic segments. Therefore, understanding how dining attributes shift in importance across price tiers is critical for practitioners to optimize service delivery. This study investigates the determinants of restaurant service quality and their impact on customer satisfaction by analyzing large-scale online reviews.

Design/methodology/approach

his study analyzed a massive corpus of 300,784 online reviews from top-ranked restaurants across six major Asian culinary destinations employing a high-recall zero-shot classification calibration to capture sparse linguistic signals despite known precision trade-offs. By operating at an unprecedented empirical scale and bypassing the biases of manual surveys, this big-data approach fundamentally shifts the research paradigm beyond traditional DINESERV constraints, empirically validating the chef as an orthogonal loyalty driver.

Findings

The results show that while food quality remains the universal baseline for satisfaction, the role of service quality is asymmetric, thus acting as a critical failure point for dissatisfied guests, but a hygiene factor for satisfied ones. Furthermore, price and value emerged as the primary “Concentrate Here” priorities for Midrange and Fine Dining segments, thereby indicating a tension between cost and perceived authenticity.

Originality/value

The findings also validated the chef as a distinct dimension that is separate from general food quality. The results provide a data-driven framework for operators to tailor their resource allocation based on their specific price positioning to enhance customer retention.

The global food service sector remains a vital economic force and has demonstrated marked recovery since the pandemic. In 2024, its value reached USD 3.74 trillion with forecasts suggesting that it will climb to USD 6.45 trillion by 2032, thus reflecting a compound annual growth rate (CAGR) of 7.8% (Fortune Business Insights, 2025; Restrowork, 2025). Full-service restaurants also continue to expand: this segment anticipates increasing from USD 1.65 trillion in 2025 at a CAGR of 2.6% through 2032. The Asia-Pacific region dominates with more than 42% of the market share, which is propelled by rapid urban development and a surge in culinary tourism (Fortune Business Insights, 2025). As the economy grows, restaurant sustainability, which includes environmental methods, financial strength, and long-term operations, has become critical.

Scholars have developed frameworks to assess restaurant quality and its impact on customer revisit intentions. A widely used model in hospitality and tourism is Servicescape, which emphasizes key service environment factors, such as ambiance, space/function, and signs/symbols/artifacts (Bitner, 1992; García-Fernández et al., 2020). This concept was refined into the DINESCAPE framework, which reflects the nature of the restaurant context, especially restaurants' dining environments, including facility aesthetics, ambient, lighting, table setting, layout, and service staff (Abdien, 2019). Meanwhile, SERVQUAL (Service quality) was introduced to specify that service quality can be evaluated through tangibles, reliability, responsiveness, assurance, and empathy demonstrated by staff (Basle, 2023; Parasuraman & Zeithaml, 1988). Stevens, Knutson, and Patton (1995) and Akdere, Top, and Tekingündüz (2020) suggested that the DINESERV (Dining service quality) model has five factors for restaurant evaluation, namely, food quality, service quality, price, atmosphere, and convenience. However, previous dining evaluation has shifted beyond these functional attributes toward experiential and cultural dimensions.

Diners increasingly evaluate experiences through the lens of authenticity rather than just taste or service quality (Choi, Jung, & Na, 2025; Goffi, Osti, King, Osti, & King, 2025; Liu, Li, Dipietro, & Levitt, 2018; Paunić et al., 2024). Customers' preferences become crucial to evaluate the business and inspect whether the food quality, the atmosphere (Choi et al., 2025; Ha & Jang, 2010), food recipe (Song, Yang, & Sthapit, 2025), or even the chef's performance (Angelini, Castellani, & Pattitoni, 2023, 2025) reflects their cultural heritage. Research indicates that the perceived quality of restaurants significantly enhances customer self-expansion and is a stronger predictor of revisit intention than price or convenience, especially in ethnic restaurants (Kim, Hanqun, & Youn, 2019; Lee & Lee, 2023). However, pinpointing key evaluation frameworks across price ranges remains complex and warrants additional study.

Although small surveys or focus groups have previously been used to understand satisfaction drivers, these methods could not provide global insights. User-generated content (UGC) on social media offers a broader solution than previous approaches (Karadağ, Tosun, & Ayan, 2024; Mariani & Baggio, 2022; Nawawi, Ilmawan, Maarif, & Syafrudin, 2024; Nguyen & Tong, 2023). Travel social media platforms, such Tripadvisor, which hosts over 1 billion reviews, serve as a massive, real-time data warehouse of diner sentiments (Ferries, 2025). These reviews provide firsthand accounts of diners' experiences with authentic or modified flavors. Analyzing this unstructured global data helps identify what makes restaurants successful and resilient.

Extracting complex concepts from millions of reviews is challenging because keyword-based methods miss context and supervised machine learning requires costly manual labeling. This study applies the zero-shot classification, which is a deep learning approach that identifies nuanced dimensions without prelabeled data and can handle previously unseen classes (Gera, Halfon, Ein-dor, & Slonim, 2022; Kar, Xia, Chen, & Artetxe, 2022). Zero-shot outperforms text mining by skipping training needs, thus enabling fast adaptation through pretrained models. This approach is different from mining's data-heavy requirements, thus making it ideal for detecting emerging consumer trends in the data across diverse linguistic contexts (Kar et al., 2022). Moreover, the current research aims to conduct the importance-performance analysis (IPA) through online reviews. Specifically, utilizing Text Analytics-based Importance-Performance Analysis (TAIPA) offers managers a highly convenient method to assess customer satisfaction, benchmark competitors, and craft strategies over time using readily available data (Bi et al., 2019; Chen, Becken, & Stantic, 2022; Nam & Lee, 2019). However, few studies in hospitality and tourism have employed this method (Bi, Liu, Fan, & Zhang, 2019).

This research revisits DINESERV frameworks, which were originally designed for functional services. However, these frameworks overlook modern diners' demand for experiential cues. Furthermore, basic text mining studies often rely on keyword frequency, thus missing semantic context or fails to account for the distinct structural differences among Cheap Eats, Midrange, and Fine Dining categories. Therefore, this work applies zero-shot classification and TAIPA to Tripadvisor's top-rated global restaurants in the Asia-Pacific region, selected from the “Travelers' Choice Awards: Best of the Best Destinations for Food-World”. As such, this work applies zero-shot classification to Tripadvisor's top-rated global restaurants in the Asia-Pacific region according to the Travelers' Choice Awards, Best of the Best Destinations for Food-World. It addresses two questions: (1) Which specific dimensions of the DINESERV framework are crucial across different price ranges? (2) How important are these dimensions, and how do they perform? The findings offer a data-driven framework for operators to craft experience-driven and future-ready dining experiences.

The assessment of restaurant quality has evolved significantly from general service evaluations to specific, multidimensional frameworks that are tailored to the hospitality context. Early research often relied on Servicescape, which is a concept introduced by Bitner (1992) that emphasized the impact of the physical environment, such as ambience, space and layout, and signs, on customer behavior and satisfaction. This framework established the foundation for understanding how tangible elements influence intangible service perceptions (Mari & Poggesi, 2013). Building on this notion, the DINESCAPE scale was developed to address the unique atmospheric needs of dining establishments by focusing on aesthetic factors, such as lighting, table settings, and facility layout (Abdien, 2019).

Parallel to physical environment models, the SERVQUAL instrument provided a broad measure of service quality across five dimensions, namely, reliability, assurance, tangibles, empathy, and responsiveness (Ayvaz-Çavdaroğlu, Iyanna, & Foster, 2024; Basle, 2023; Parasuraman, Berry, & Zeithaml, 1991). Stevens et al. (1995) recognized the need for a restaurant-specific tool and adapted SERVQUAL into DINESERV to evaluate dining quality across five key dimensions, namely, food quality, service quality, price, atmosphere, and convenience. DINESERV has since become a standard in hospitality research and validated across various cultural contexts (Akdere et al., 2020). However, the applicability and weighting of these DINESERV dimensions vary significantly across restaurant segments, thus necessitating a segmented approach to quality evaluation. This research classified restaurants into three categories, namely, Cheap Eats (quick service or fast food), Midrange, and Fine dining, following the recommended types on Tripadvisor.

This study employs the DINESERV model as a foundational baseline to assess the overall dining experience, while simultaneously applying large language modeling to isolate service quality as one distinct evaluating dimension among many. This combined approach identifies hidden factors and provides deep insights into the varied determinants of customer satisfaction in accordance with the experience economy. Specifically, we isolate chef as a sixth, orthogonal dimension, distinct from general food quality, to capture the commodification of culinary authorship. This conceptual deviation resolves DINESERV's historical limitation in measuring hedonic, persona-driven brand equity, ensuring the framework remains empirically consistent with contemporary high-tier dining behaviors.

2.1.1 Cheap eats or quick service restaurants

In the Cheap Eats or quick service restaurant (QSR) segment (fast food, street food etc.), the evaluation framework is dominated by utilitarian attributes (Chompupor, Ghuangpeng, Oğuz, & Zerman, 2024; Ozcelik & Akova, 2021). Research indicates that food quality remains the primary driver of behavioral intentions but is closely followed by price and value and convenience. In this context, service quality is often interpreted through the lens of efficiency and speed rather than empathy or personalization. Chompupor et al. (2024) found that while food quality and physical environment significantly determine customers' perceived value in fast-food settings, employees' service quality (assurance and empathy) often plays a less significant role than reliability. Thus, frameworks for QSRs prioritize functional attributes, such as the cleanliness of the physical environment and the consistency of the food, over the social interaction components that are found in traditional service models (Zhong & Moon, 2020).

2.1.2 Midrange and casual dining

The evaluation of midrange restaurants requires a balanced framework that integrates the efficiency of QSRs and the experiential elements of fine dining. Slack et al. (2021) emphasized that for mid-to-upper-scale restaurants, satisfaction is driven by a combination of food presentation, tasty food, and reliable service. Unlike diners in QSRs, where speed is vital, midrange diners place high importance on consistent food execution and attentive staff interactions, which are the core components of DINESERV's service quality and food quality dimensions. Furthermore, (Carrasco & Dias, 2024; Zhong & Moon, 2020). Slack et al. (2021) noted that while food quality remains the top attribute, the service encounter becomes a critical differentiator in this segment. Diners expect a level of competence and spatial comfort (seating arrangement) that exceeds basic functionality. This expectation suggests that the atmosphere and service quality dimensions of DINESERV hold moderate but essential weight in forming revisit intentions.

2.1.3 Fine dining and luxury restaurants

In the Fine Dining and luxury segment, the evaluation framework shifts from functional to experiential and emotional. Angelini et al. (2023, 2025) argued that consumption in luxury restaurants is driven by hedonic needs, where the environment serves as a stimulus that extracts specific emotional responses (pleasure and arousal) that lead to behavioral loyalty. The Servicescape expands to include the social Servicescape, which encompasses the influence of other customers and their compatibility with the diner's self-image (Line, Hanks, & Kim, 2018).

In this context, standard DINESERV dimensions are reconfigured. Atmosphere becomes the dominant nonfood predictor, where fascinating interior design and music ambience are prerequisites for high satisfaction (Namkung & Jang, 2008). Service quality shifts from reliability to empathy and assurance, where staff knowledge and behavior must align with the luxury brand promise. Tangibles and chef image or the reputation of the chef becomes a tangible quality cue that significantly influences perceived value and behavioral intentions, thus acting as a marker of authenticity and prestige (Angelini et al., 2023; Chen, Raab, & Chen, 2017).

Additionally, in the fine dining restaurant context, various scholars address the chef aspect as an essential antecedent that influences overall experiences among diners (Angelini et al., 2023, 2025). Consequently, scholars argue that while DINESERV provides a foundational tool, modern research must extend these frameworks to capture segment-specific drivers, such as authenticity, cultural connection, and social identification, particularly in experience-centric dining sectors (Kim et al., 2019; Sithole, Roux, & Retief, 2025).

Revisit intention, which is a key indicator of customer loyalty, is heavily influenced by the dimensions that are outlined in the DINESERV model. While food quality remains the primary predictor of return visits, recent studies have indicated that these dimensions increasingly serve as antecedents to a holistic customer experience rather than direct drivers. Sithole et al. (2025) found that functional service qualities (reliability, responsiveness) must be translated into memorable experiences to generate loyalty. Even in high-tech environments, such as in robotic restaurants, assurance and perceived value remain critical for satisfaction and revisit intention, thus proving that DINESERV principles apply beyond traditional service models (Seo & Lee, 2025).

The role of atmosphere has also evolved to drive social dynamics. In the post-pandemic era, human crowding negatively impacts emotions, whereas well-managed spatial density fosters a sustainable dining culture (Choi et al., 2025). In ethnic and authentic contexts, this relationship is further moderated by place attachment (Choi et al., 2025; Line et al., 2018). Hung et al. (2018) highlighted that for time-honored restaurants, the impact of objective authenticity on revisit intention is improved when customers feel a deep emotional bond with the location.

Price and value acts as a dynamic moderator. While price sensitivity drives value perception in utilitarian segments, experience-driven customers are willing to trade high prices for superior authentic experiences (Slack et al., 2021). This trend suggests that DINESERV's dimensions interact dynamically; authenticity and emotional connection often surpass price fairness as determinants of loyalty in specialized dining contexts (Kau & Lim, 2005; Martín, Gremler, Washburn, & Cepeda, 2008).

Finally, while DINESERV incorporates culinary skills under the general category of food quality, recent scholarship suggests that the chef functions as a distinct antecedent of revisit intention particularly in experience-driven dining. A chef's reputation and image act as tangible quality cues that enhance perceived value and stimulate the flow experience, thus directly influencing customer loyalty. Therefore, this study posits that the chef dimension exerts a unique and significant influence on revisit intention that is separate from the physical attributes of the food itself (Angelini et al., 2023). While the chef dimension is traditionally associated with fine dining reputation, contemporary culinary tourism increasingly applies this evaluation to lower-tier establishments. In Cheap Eats and Midrange ethnic restaurants, the individual cook or street food vendor embodies culinary craftsmanship and cultural heritage (Graham, Ali, & Tajeddini, 2020). Recent literature on authentic dining experiences highlights that diners seek a direct connection to the staff interaction, which includes both service staff and the creator of the food (Slack et al., 2021). The vendor's persona and visible cooking process serve as critical markers of objective authenticity, making the chef dimension a relevant driver of loyalty even in highly affordable, casual dining segments (Anas et al., 2023; Graham et al., 2020; Slack et al., 2021).

This study employs the DINESERV model to assess quality in restaurants and applies large language modeling for data analysis. This combined approach identifies hidden factors and provides deep insights into service quality determinants.

The proliferation of Web 2.0 has shifted restaurant evaluation from professional critics to everyday diners through UGC. UGC on online platforms, particularly experience sharing on social media, is a key communication and decision-making tool known as electronic word-of-mouth (EWOM) (Karadağ et al., 2024; Mariani & Baggio, 2022; Nawawi et al., 2024; Nguyen & Tong, 2023). Platforms such as TripAdvisor act as global sensors of real-time sentiment by providing massive, unstructured datasets that capture unprompted consumer feedback (Pop, Săplăcan, Dabija, & Alt, 2022; Rasoolimanesh, Seyfi, Hall, & Hatamifar, 2021). Recent research has shown that simply browsing this content can influence how people perceive destinations and their intentions because of psychological effects, such as envy (Dwivedi et al., 2021; Pop et al., 2022). This research uses review data from Tripadvisor because it holds the largest number of active users, properties, and reviews (Ferries, 2025).

Aspect-based sentiment analysis and zero-shot learning are increasingly essential to disentangle mixed sentiments within a single review (e.g. praising food but criticizing price), thus allowing for the precise extraction of service dimensions that traditional models miss (Mariani & Baggio, 2022; Nawawi et al., 2024). Zero-shot learning can map input text (e.g. “The Pad Thai was authentic”) to a target label (e.g. “food quality”) based on semantic similarity rather than memorized examples by leveraging semantic embeddings and external knowledge graphs (Gera et al., 2022). This capability allows researchers to detect complex, emerging restaurant attributes and provides topics that are suitable to structure a set of attributes and attribute importance. The set is presented in the form of the probabilities of specific words in a topic. This method helps researchers pinpoint key attributes in the restaurant sector by analyzing user reviews. It organizes topics from large volumes of text, ranks attribute importance using word probabilities, and offers a systematic way to interpret factors that shape customer perceptions in dining.

Despite the popularity of the Natural Language Processing (NLP), contemporary NLP literature identifies critical vulnerabilities in zero-shot classification when applied to highly imbalanced domain corpora. Without domain adaptation or few-shot prompting, zero-shot architectures systematically struggle with semantic boundary resolution, often defaulting to overprediction to maximize recall in sparse classes (Halder, Akbik, Krapac, & Vollgraf, 2020). Consequently, this approach inherently introduces false-positive noise, necessitating careful threshold calibration when applied to downstream diagnostic models like TAIPA.

Leveraging this wisdom of crowds has allowed researchers to conduct IPA directly from review text by inferring attribute importance and performance without the limitations of traditional surveys (Bi et al., 2019; Chen et al., 2022). The IPA technique was initially developed as a visual tool to assess a firm's market position, highlight areas for improvement, and support strategic planning (Ai-Hsuan & Trimi, 2020; Bi et al., 2019; Lee & Jan, 2019; Martilla and dan, 1977). The graph illustrates the values that are associated with prescribing recommendations, such as Quadrant 1: “keep up the good work” or Quadrant 3: “low priority.” Meanwhile, a negative correlation may lead to overprescribing in categories, such as Quadrant 2: “possible overkill” or Quadrant 4: “concentrate here” (Karnreungsiri, 2022; Nam & Lee, 2019). In general, IPA research studies employ the survey and quantitative approach, while the traditional IPA was developed to select attributes of the target product or service explicitly.

However, traditional survey-based IPA has well-known methodological limitations. Specifically, traditional models rely on explicit, self-reported assessments of importance, which are highly vulnerable to recall bias, survey fatigue, and ceiling effects where respondents rate all attributes as “highly important” (Azzopardi & Nash, 2013). Furthermore, traditional explicit approaches often assume a linear relationship between attribute performance and satisfaction, failing to capture the asymmetric nature of service evaluation (Bi et al., 2019). Nonetheless, explicit approaches present certain limitations, thus leading to the development of numerous implicit methods for attribute composition (Bi et al., 2019; Nam & Lee, 2019). The current technique of text analytics-based importance-performance analysis (TAIPA) offers a more rigorous alternative. By deriving importance from the actual behavioral footprint of diners, specifically, the semantic weight and frequency of topics in unstructured reviews, TAIPA bypasses the self-selection and response biases of questionnaires. This robust approach offers managers an effective means to evaluate customer satisfaction, benchmark competitors, and formulate strategic plans across multiple time periods utilizing readily available online data (Bi et al., 2019; Chen et al., 2022; Nam & Lee, 2019).

This study applies a review analytics pipeline to identify dining attributes that significantly differentiate tourist evaluations of restaurants in emerging destinations. The methodology utilizes individual reviews (narrative text and ratings) to transform unstructured data into attribute-specific sentiment measures. The process is followed by TAIPA to generate prioritization maps. This approach is pertinent in tourism destination contexts in Asia, where small and medium operators, informal service ecosystems, and inconsistent service standardization contribute to substantial performance variability across establishments.

The conceptual framework integrates three primary streams. First, tourism and hospitality research increasingly uses UGC as behavioral evidence of experience evaluation and post-consumption sensemaking particularly in contexts that are characterized by provider heterogeneity and information asymmetries (Karadağ et al., 2024; Nguyen & Tong, 2023). This information is especially relevant in Asian destinations, where travelers rely on reviews to navigate complex dining environments that range from iconic to informal venues. While broader Servicescape theories inform the general dining context, this study's methodology is explicitly anchored in the DINESERV framework. By operationalizing DINESERV's core dimensions (Food Quality, Service Quality, Price and Value, Atmosphere, and Convenience) alongside the newly isolated chef dimension, the analytical pipeline ensures strict theoretical alignment between the established determinants of restaurant quality and the text-derived attributes extracted from the reviews. Third, TAIPA serves as a managerial diagnostic tool that translates these DINESERV-aligned signals into actionable priority zones; importance is operationalized through empirically derived associations with overall ratings or, in fixed-rating strata, through mention or coverage as a proxy for salience (Nam & Lee, 2019). This methodology aligns with the practical constraints of destination management in Asia, where limited managerial resources necessitate defensible and operationally straightforward prioritization.

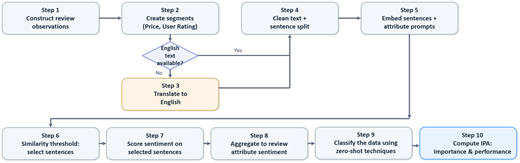
The implemented workflow comprises six primary stages, namely, (1) labeling reviews and segments by price tier and rating group, (2) standardizing text through language detection and translation to English, (3) mapping sentences to dining attributes using semantic similarity, (4) calculating attribute sentiment for each review by aggregating sentence-level polarity, (5) performing zero-shot classification, and (6) generating TAIPA tables and quadrant plots for prioritization. This process is illustrated in Figure 1.

Figure 1 presents a framework that encompasses data construction and segmentation, multilingual harmonization, semantic attribute extraction, sentiment aggregation, zero-shot, and TAIPA outputs. The resulting quadrant maps support a targeted service design for ethnic dining in emerging destinations, such as those in Asia, where service and digital capabilities are heterogeneous.

This research follows the recommendations of Tripadvisor's Travelers' Choice Awards, Best of the Best Destinations for Food-World, which highlight global hotspots that are ideal for culinary exploration. These elite rankings emerged from a thorough analysis of traveler reviews over a 12-month period, which crowned fewer than 1% of 8 million listings for exceptional quality and volume of praise. Area information was explicitly collected to capture the nuances of the most competitive culinary markets in the most voted region. Only six cities in Asia were ranked in top 25 lists. Bangkok, Thailand, was ranked 14th, which was followed by Kyoto, Japan (16th), Chiang Mai, Thailand (20th), Mumbai, India (21th), Hong Kong, SAR China (24th), and Penang, Malaysia (25th). By focusing on these specific areas, the study ensures the dataset reflects dense, high-traffic culinary destinations where online reviews are highly influential. The sample restaurants that had been selected from those cities were categorized into three groups according to their price groups, namely, Cheap Eats, Midrange, and Fine Dining. A total of 30 top-ranked restaurants from each category were selected, thus totaling 540 restaurants. The data were scraped from Tripadvisor using DataforSEO API and Python in Kaggle.

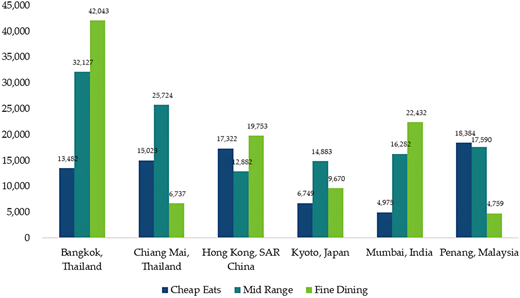
A total of 300,784 records of reviews were collected. The distributions of reviews shown in Figure 2 illustrate the distribution of restaurant review records in each destination (Bangkok, Chiang Mai, Hong Kong, Kyoto, Mumbai, and Penang), which are segmented by price group. The majority of the reviews are in the Midrange group (39.72%), followed by the Fine Dining (35.04%) and Cheap Eats (25.34%) groups. Table 1 exhibits the dataset segmented by rating and price with the total records of 300,784. The distribution is skewed toward high ratings. Rating 5 consists of 228,178 records, followed by ratings 4 (50,500), 3 (13,678), 2 (4,550), and 1 (3,875). The majority of the population is in the Midrange group (n = 119,483), followed by the Fine Dining (n = 105,366) and Cheap Eats (n = 75,935) groups.

The analytic dataset is organized at the review level, which is consistent with tourism UGC analytics, where each review constitutes a postconsumption evaluation that incorporates functional, hedonic, and contextual elements (Karadağ et al., 2024; Nguyen & Tong, 2023). Each observation includes (1) a free-text review narrative, (2) an overall rating on a 1–5 integer scale, and (3) when available, a platform price-range indicator that is recoded into three price tiers. Reviews may also include language metadata. If the information is absent or unreliable, language is inferred from the text to facilitate multilingual processing. This design is particularly important for Asian destinations, where reviews are often multilingual and code-mixed.

This study uses two segmentation schemes to address the diversity of Asian dining experiences. Price-tier segmentation accounts for variations in service resources and tourist expectations, while rating-stratum segmentation analyzes attribute mentions and sentiment in detractor and promoter reviews. This information provides insights into recovery service and experience redesign particularly in destinations that are susceptible to rapid negative word-of-mouth. Furthermore, TAIPA maps address the unique constraints of Asian culinary destinations, which are dominated by resource-constrained small and medium operators for whom traditional surveys are impractical. By transforming unstructured user-generated content into straightforward quadrant maps, this framework provides a cost-free, data-driven tool. This allows local management to efficiently allocate limited capital toward food quality, service refinements, or price-value suggestions.

The pipeline standardizes multilingual tourism UGC from Asian destinations to English to ensure consistent natural language processing with English-oriented components. The workflow detects the language of each review and applies automated machine translation to non-English text. Prior to modeling, the text is cleaned to reduce noise and segmented into sentences. This sentence-level strategy is essential because attribute extraction and sentiment analysis operate at this level, thus facilitating the analysis of reviews that combine multiple experience components.

The pipeline operationalizes the dining experience using six predefined attributes. In Asian destinations, these constructs are also practically meaningful because price and value is often evaluated not only monetarily but relative to perceived authenticity, portioning norms, and destination-context expectations.

The measurement approach is computational and derived from text rather than survey based. Each review is split into sentences. Sentences are embedded using a pretrained sentence-transformer model (a Sentence-BERT family representation) (Reimers & Gurevych, 2019). Semantic similarity is computed between each sentence and each attribute's descriptive prompt. A sentence is treated as attribute-relevant if its similarity exceeds a fixed threshold. This process yields an attribute-specific sentence subset per review. Then, attribute sentiment is computed by scoring each selected sentence with a lexicon- and rule-based sentiment model (VADER) and averaging the resulting polarity values to produce a review-level attribute sentiment score (Gera et al., 2022; Halder et al., 2020).

This design addresses the sparse and uneven attribute coverage that is typical of tourism dining reviews, where reviewers often focus on specific components, such as food, while omitting others. The pipeline tracks attribute coverage, which is defined as the proportion of reviews that contain at least one attribute-relevant sentence. The coverage is used as a salience indicator when correlation-based importance cannot be determined. This approach is relevant in UGC, where short reviews, informal language, and cultural references often lead reviewers to highlight only one or two prominent aspects of their experience.

TAIPA is the central analytic model for translating extracted attribute signals into prioritization guidance from online reviews (Nam & Lee, 2019). Following the IPA tradition, performance is defined as the mean attribute sentiment within a segment, which represents how positively (or negatively) tourists discuss that attribute (Martilla and dan, 1977; Oh, 2001). Importance is operationalized in two ways, which are selected to remain consistent with the available data structure and the segmentation logic used in practice. This research uses derived importance based on the association with the overall rating within each price tier. Importance is calculated as the correlation between attribute sentiment and the overall rating provided that the sample size and rating variation are sufficient. Because the overall rating acts as a summary evaluation, the strength of its empirical linkage serves as a highly rigorous, data-driven proxy for importance, entirely avoiding the explicit response biases found in traditional surveys (Nam, Lee, & Lee, 2019; Nam & Lee, 2019; Zeithaml, Berry, & Parasuraman, 1996). When correlation is mathematically unstable, the workflow falls back to coverage-based importance (mention frequency). In emerging-destination contexts, where platform data can be unevenly distributed across establishments and time, this computational approach ensures a resilient, bias-resistant mechanism for prioritizing managerial action.

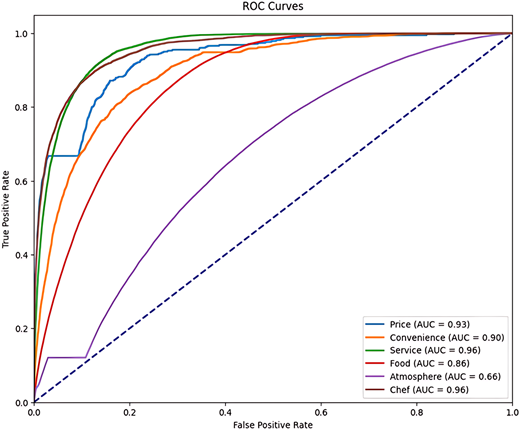
Figure 3 presents the receiver operating characteristic curves, which demonstrate the diagnostic ability of the zero-shot model across six attributes. Diagnostic performance is measured using the Area Under the Curve (AUC), a metric where 1.0 indicates perfect classification and 0.5 represents random guessing. The model extracts these classifications using a probability cutoff of 0.25 (Halder et al., 2020). This specific threshold was selected as it is an established practice in multi-label zero-shot classification for imbalanced domain corpora, purposefully calibrated to prioritize the recall of sparse, minority linguistic classes over strict precision. The model achieved optimal discrimination for service quality and chef (AUC = 0.96), followed by price and value (AUC = 0.93). Atmosphere demonstrated the lowest performance (AUC = 0.66) because of subjective variation.

Table 2 is the Performance Metrics, presenting a tabulation of accuracy, precision, recall, F1-score, and AUC validated against ground-truth labels. The model prioritizes recall to capture sparse signals. Only food demonstrates robust performance, which achieves a strong F1-score of 0.827, balanced precision and recall, and an AUC of 0.862. The model successfully captures sparse culinary authorship (Chef recall: 0.990) at the severe expense of class precision (0.033), necessitating strict threshold management for subsequent IPA mapping. Price and value and convenience show misleadingly high accuracy (>0.98) and AUC, but extremely low F1-scores (<0.12) because of poor precision, which is typical of rare class detection issues. Meanwhile, service and chef achieve near-perfect recall (>0.98), but negligible precision, thus indicating a substantial overprediction of these categories. Conversely, the model fails to detect atmosphere, which is evidenced by an extremely low recall of 0.036.

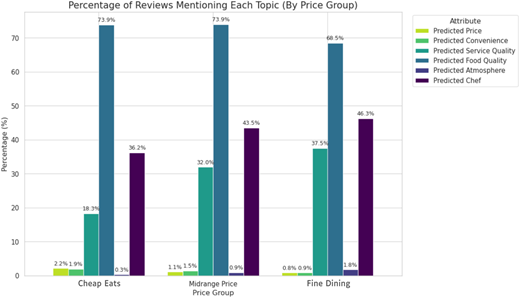
A grouped bar chart in Figure 4 shows the percentage of reviews within each price tier that mentions specific attributes. The structural differences can be observed across attributes, where food quality is the most crucial for all price groups. Meanwhile, atmosphere occurred more frequently in the Fine Dining group (1.8%) than in the Cheap Eats group (0.3%).

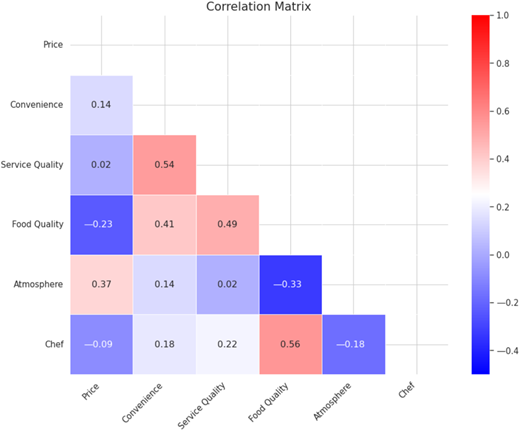
Figure 5 illustrates a heatmap that visualizes the Pearson correlation coefficients between attribute probability scores across the entire dataset. The heatmap indicates that chef and food quality (0.56), service quality and convenience (0.54), and food quality and service quality (0.49) frequently occurred simultaneously in customer reviews

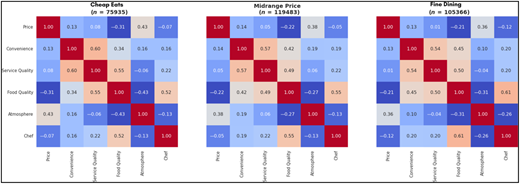
Faceted heatmaps illustrate how attribute relationships shift with price aspects. In the Cheap Eats segment, service quality and convenience are strongly correlated (r = 0.60), thus indicating an efficiency-focused view of service. This correlation weakens in the Fine Dining segment (r = 0.54), thus suggesting a shift toward personalized service. Additionally, the correlation between food quality and chef strengthens (r = 0.61) in the Fine Dining segment (Figure 6).

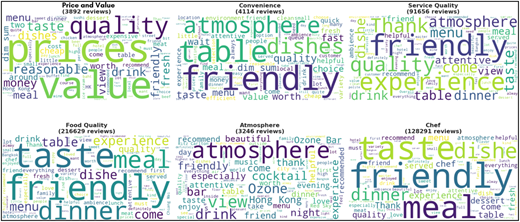
The word clouds in Figure 7 identify three key dichotomies in customer reviews. First, value and taste separate the transactional vocabulary of price (e.g. “value,” “reasonable”) from the instinctive descriptors of food quality (e.g. “taste,” “fresh”). Second, the human element is split between staff and skill: service keywords focus on interpersonal staff interactions (“friendly,” “helpful”), whereas keywords for chef attribute quality to specific craftsmanship and culinary skill (“distinct,” “experience”). Third, the environment is viewed through an aesthetic or functional lens: atmosphere is judged by emotional ambiance (“view,” “vibe”), while convenience is strictly logistical, which focuses on friction points, such as “parking” and “location.”

The analysis of keyword frequency in Table 3 reveals distinct cognitive structures, where reported percentages represent the relative semantic dominance of each term within its specific attribute group. The price category displays a highly concentrated vocabulary, which is anchored by “price” (35.12%) and “value” (10.56%). This outcome confirms that cost discourse revolves around core transactional concepts. By contrast, convenience is semantically fragmented. No single word dominates. Instead, weight is distributed across terms, such as “location” (19.59%), “convenient” (18.26%), and “easy” 15.85%), thus suggesting a multifaceted construct that involves proximity and access.

A clear distinction emerges in the human elements. Service quality is defined by “front-of-house” interactions, such as “service” (47.32%) and “friendly” (11.08%). Conversely, the chef category focuses on “back-of-house” expertise. While “chef” (44.38%) is the anchor, technical terms, such as “prepared” (10.49%) and “kitchen” (10.10%), highlight craftsmanship rather than general hospitality. Finally, atmosphere is driven by ambient details, such as “view” (17.09%) and “music” (4.87%).

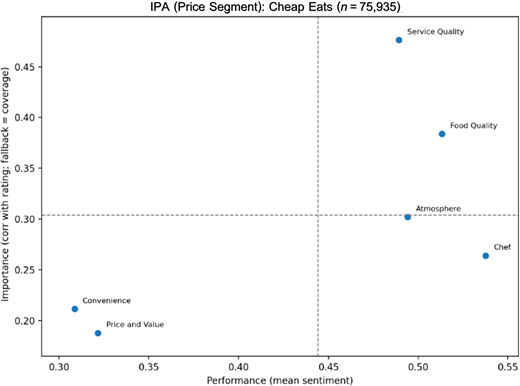
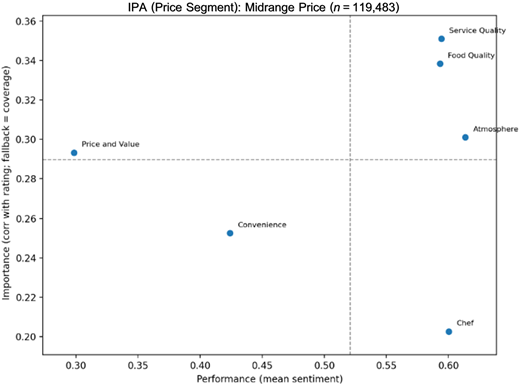
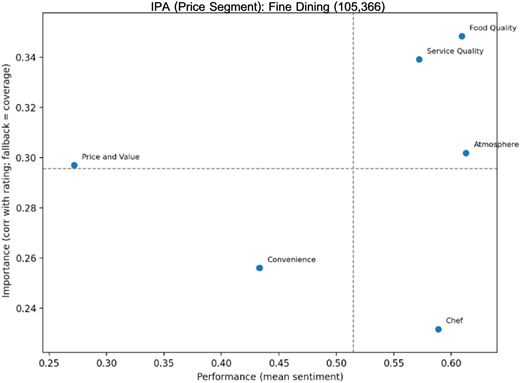
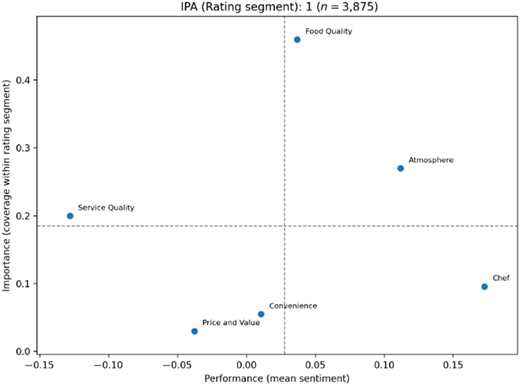
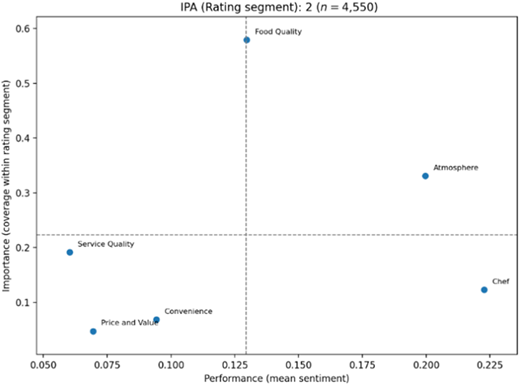
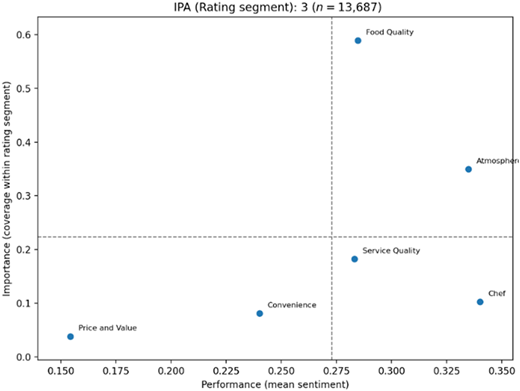
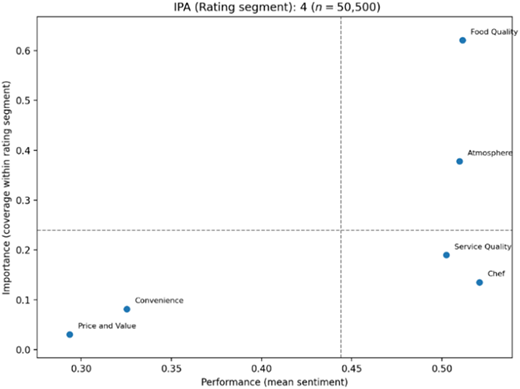
In IPA, performance (x-axis) is defined as the segment-level mean sentiment score for detected aspects. To determine quadrant placement, the threshold crosshairs (the intersecting axes) are dynamically established using the average mean sentiment and average importance score specific to that segment. This segment-specific mean split ensures that the classification of attributes into quadrants is relative to the normative expectations of that specific group (e.g. fine dining diners), rather than an arbitrary, dataset-wide fixed point. Importance (y-axis) varies by segmentation: for price-stratified TAIPA, it is the Pearson correlation between aspect sentiment and overall rating (falling back to coverage if needed). For rating-stratified TAIPA, it is aspect coverage due to fixed rating strata. Quadrant crosshairs are based on the segment's mean performance and importance. They use within-segment logic to highlight relatively high importance but underperforming aspects in the “Concentrate Here” quadrant.

The analysis is stratified by price tier to account for changing expectations and perceptions of value as spending increases, which is a characteristic feature of the region's diverse dining ecosystems. In this framework, performance reflects the degree to which an aspect is discussed positively or negatively, while importance measures the strength of the aspect's association with the overall evaluation in the same group. Table 4 summarizes the aspects assigned to each IPA quadrant (“Keep Up the Good Work,” “Concentrate Here,” “Low Priority,” and “Possible Overkill”) for each price group based on segment-specific mean splits of importance and performance. The accompanying scatter plots visually represent each aspect's position relative to the crosshairs for its price segment.

For Cheap Eats restaurants (Figure 8), food quality and service quality fall into “Keep Up the Good Work,” which means these aspects are relatively important (in the derived-importance sense) and relatively strong in performance within the segment. This trend is consistent with a budget dining logic where customers may tolerate few “extras” but still respond strongly to core delivery (taste, consistency, and frontline interaction). Atmosphere and chef appear as “Possible Overkill,” thus suggesting that these features are comparatively performing well but less tightly linked to overall evaluation in this price stratum. Price and value sit in “Low Priority,” which can occur when price expectations are already anchored. Once diners select a budget option, value concerns may become less diagnostic than the basics.

In the Midrange segment (Figure 9), price and value moves into “Concentrate Here,” while food quality, atmosphere, and service quality remain in the “Keep Up the Good Work” quadrant. This pattern implies that customers under the Midrange tier are evaluative about whether the experience feels “worth it” and not only whether it is cheap. In many Asian markets, where price points can vary sharply within the same destination and quality signals are mixed, perceived value becomes a salient experience integrator. It links what was paid to what was received especially for tourists who benchmark against prior trips.

For Fine Dininng restaurants (Figure 10), price and value is again flagged as “Concentrate Here,” while food quality, atmosphere, and service quality remain in “Keep Up the Good Work.” This outcome is a fairly classic premium-service tension. High prices raise expectations and reduce tolerance for mismatches between promise and delivery. In this segment, the managerial message is not necessarily to “cut prices” but rather make the value story coherent with portioning, authenticity cues, service choreography, and tangible experience signals that justify the premium in the eyes of tourists and upmarket diners.

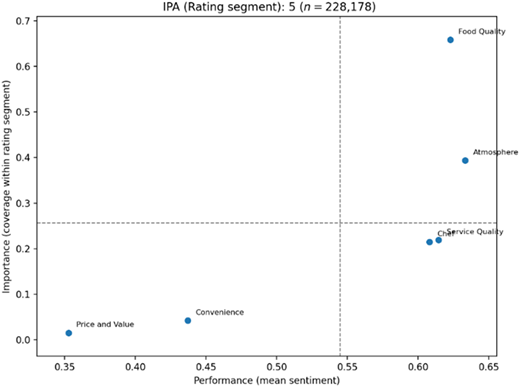
We capture heterogeneity in guest experiences by further stratifying the TAIPA by rating level (1–5). This approach is straightforward yet informative in comparing the narratives of dissatisfied and satisfied guests. Table 5 summarizes quadrant membership by rating group (1–5) (Figures 11–15). Importance is operationalized as aspect coverage (mentioned prevalence) within each rating stratum, which is consistent with the executed workflow.

The key contrast is that service quality becomes a “Concentrate Here” priority in rating 1 reviews, while food quality and atmosphere remain in the “Keep Up the Good Work” quadrant. When guests give the lowest ratings, service breakdowns become disproportionately prominent in what they discuss and how negatively they express their experience. This outcome aligns with a service failure/recovery intuition that frontline issues are often the trigger for strongly negative evaluations, especially in tourism settings where guests face time pressure, unfamiliar norms, and language friction.

For the transitional ratings of 2 and 3, the analysis reveals a stabilizing effect. Food quality and atmosphere maintain their position in the “Keep Up the Good Work” quadrant, underscoring their role as universal baselines. Notably, service quality transitions from a critical failure point (“Concentrate Here” in rating 1) to ‘Low Priority’ in rating 2, and eventually shifts into ‘Possible Overkill’ by rating 3. This trajectory empirically illustrates the shifting role of service from an active dissatisfier to a neutralized hygiene factor as overall satisfaction marginally improves.

For ratings 4–5, food quality and atmosphere remain consistently in the “Keep Up the Good Work” range, thus indicating that high ratings are anchored in the core product and experiential environment. Meanwhile, service quality shifts into the “Possible Overkill” segment, which means that it performs strongly but is less frequently foregrounded relative to the mean coverage benchmark. Customers notice it less when it is “as expected,” which is common in practice. The service becomes a hygiene factor for promoters but a failure factor for detractors. Convenience and price and value remain in the “Low Priority” across the rating strata, thus suggesting that (within-rating) they are comparatively less central in what reviewers mention even though value concerns can still emerge strongly when we stratify by price segment.

In conclusion, food quality and atmosphere are stable across all rating groups (always “Keep Up the Good Work” in Table 5). Meanwhile, service quality is a volatile aspect. It appears in the “Concentrate Here” segment only at the lowest rating and shifts to “Possible Overkill” at high ratings. This within-platform asymmetry is managerially useful because it suggests different levels for preventing one-star outcomes versus sustaining five-star outcomes.

Digital reviews function as aggressive expectation amplifiers within the modern experience economy (Pop et al., 2022; Rasoolimanesh et al., 2021). Constant exposure to hyper-curated dining narratives inflates pre-arrival expectations, effectively commodifying the luxury dining experience. Consequently, fine-dining establishments exhibit severe price and value vulnerabilities; the physical service delivery frequently struggles to match the artificially inflated, digitized baseline set by eWOM, stripping away the perceived premium and shifting value into the ‘Concentrate Here’ quadrant.

Methodologically, this work follows the TAIPA tradition of prioritizing managerial action based on the simultaneous consideration of performance and importance (Martilla & dan, 1977; Oh, 2001). Meanwhile, it aligns with tourism-focused guidance that IPA is most useful when its operational definitions are made transparent and fitted to the data-generating process. In our case, importance is not collected via survey self-reports. Instead, it is derived from review signals. The correlation-based derived importance for price strata and coverage-based salience for rating strata is consistent with the direction of recent tourism analytics that adapts IPA logic to online review corpora; behavioral text at scale can be a substitute for questionnaire importance as long as the inferential limits are stated clearly (Bi et al., 2019).

Substantively, the results are consistent with a common hospitality pattern. Food quality and atmosphere persist as core experience drivers. This outcome is compatible with the research on Servicescapes and dining experiences, which shows that the physical and sensory environment (atmosphere) and the core product (food) jointly shape satisfaction and behavioral responses (e.g. revisit intention and recommendations) especially in hedonic consumption settings (Carneiro, Eusébio, Caldeira, & Santos, 2019). In platform-mediated tourism markets, such cues are also easy for consumers to narrate and compare, thereby increasing their prominence in EWOM and trust formation (Dwivedi et al., 2021; Pop et al., 2022; Rasoolimanesh et al., 2021).

A central theoretical contribution of this study is the empirical isolation of the chef as a sixth, standalone dimension within the DINESERV framework. Traditionally, culinary skills have been subsumed under general food quality. However, our zero-shot classification reveals that modern diners evaluate the chef as a distinct entity. In the contemporary experience economy, the chef functions not merely as a producer of food, but as a cultural mediator and a tangible marker of objective authenticity (Angelini et al., 2023, 2025). This distinct dimension captures the commodification of culinary authorship, where the vendor's persona, technical craftsmanship, and storytelling become primary assets for brand equity. Consequently, while general food quality satisfies baseline functional needs, the chef dimension addresses the diner's hedonic desire for prestige, cultural connection, and experiential authenticity.

The price-stratified findings highlight a particularly practical managerial tension. price and value are flagged as “Concentrate Here” for Midrange and Fine Dining restaurants. This outcome aligns with perceived value theory, which holds that consumers evaluate experiences as a trade-off between what is received and what is given; price serves as a sacrifice and a quality signal (Parasuraman & Zeithaml, 1988). In tourism contexts, especially in emerging destinations where quality variance can be high within the same neighborhood, tourists may be sensitive to perceived fairness and “worth it” judgments at Midrange to Fine Dining points. The implication is not merely to discount but to reduce ambiguity in value cues, provide clear portion/quality signals, ensure consistent service choreography, and offer credible authenticity markers that help visitors calibrate expectations.

The rating-stratified results point to a service failure asymmetry. Service quality is in the “Concentrate Here” segment only for the lowest-rated group and shifts to “Possible Overkill” for higher-rated groups. This outcome is consistent with the broad service literature. Good service is often a baseline expectation (hence less frequently narrated when satisfactory), while service failures disproportionately drive dissatisfaction and negative word-of-mouth (Smith & Bolton, 2002). In operational terms, preventing the tail risk of one-star outcomes may require different investments from sustaining five-star outcomes, namely, failure-proofing frontline processes (queues, order accuracy, complaint handling) rather than adding premium “chef storytelling” elements that may not move the needle for most guests.

While the chef dimension is theoretically significant as an isolated marker of culinary authorship, its consistent placement in the “Possible Overkill” quadrant requires careful interpretation. In the TAIPA framework, this placement does not imply that the chef is a non-critical attribute. Instead, it indicates that chef reputation and craftsmanship are high-performing, expected baselines, particularly in higher price tiers. Diners frequently and positively narrate their experiences regarding the chef; however, this attribute does not drive the variance in the overall summary rating as strongly as core operational factors like price and value or baseline food quality. Consequently, the chef dimension functions as a necessary cultural and aesthetic premium that enhances brand identity and objective authenticity, rather than a primary lever for shifting overall satisfaction scores.

Interpretive caution is necessary. First, the importance derived from correlations is associational, not causal. Platform review samples can be skewed (e.g. positivity bias and self-selection). Second, rating-stratified importance is coverage based. It captures what reviewers opt to talk about and not necessarily what they privately value. To this end, as a diagnostic tool for managers, this review-grounded TAIPA remains useful because it provides segment-specific prioritization signals that can be monitored over time and compared across properties.

Theoretically, this study extends DINESERV by empirically validating the chef as a standalone antecedent of loyalty, which is distinct from food quality. It also supports the asymmetry of service attributes: service quality functions as a “dissatisfier” (critical when failed) rather than a linear “satisfier” in high-rating segments. Practically, the findings offer segmented strategies. For Midrange and Fine Dining groups, managers must not merely lower prices but improve value signaling (authenticity cues, portioning) to resolve the “Concentrate Here” status of price and value. For Cheap eats, resources should focus on error-proofing frontline services rather than “overkill” attributes, such as elaborate atmosphere.

This study relies on TripAdvisor data, which inherently contains a positivity bias (skewed toward 5-star ratings) and self-selection bias. Additionally, the zero-shot model showed low recall for atmosphere because of subjective descriptors. Future research should integrate multimodal analysis (analyzing review images alongside text) and apply causal modeling to move beyond correlation-based importance to establish the drivers of revisit intention definitively. The extreme precision-recall asymmetry (e.g. Chef precision 0.033 vs. recall 0.990) represents a deliberate calibration trade-off designed to eliminate Type II errors in sparse linguistic classes. Within unstructured UGC, failing to detect a genuine service failure structurally degrades the TAIPA matrix more than capturing a false positive. While this false-positive noise mathematically dilutes sentiment extremity toward the neutral mean, rendering our IPA placements highly conservative, it guarantees the capture of critical failure signals. To resolve this empirical noise and achieve high-fidelity quadrant mapping, future iterations should replace the baseline zero-shot pipeline with a few-shot architecture, utilizing domain-annotated anchor samples to strictly regulate precision prior to matrix generation.

This research was partially supported by Chiang Mai University. This study is conducted as part of the Innovative Regenerative Tourism Research Group: Data-Driven Sustainable Revival.
Abdien
,
M. K.
(
2019
).
An assessment of dinescape and customers’ behavioral intentions in fast food restaurants
.
Journal of Tourism Research
,
23
.
Available from:
 Link to the website
Ai-Hsuan
,
C.
, &
Trimi
,
S.
(
2020
).
Impacts of service robots on service quality
.
Service Business
,
14
(
3
),
439
–
459
. doi: .
Akdere
,
M.
,
Top
,
M.
, &
Tekingündüz
,
S.
(
2020
).
Examining patient perceptions of service quality in Turkish hospitals: The SERVPERF model
.
Total Quality Management and Business Excellence
,
31
(
3-4
),
342
–
352
. doi: .
Anas
,
A. M.
,
Abdou
,
A. H.
,
Hassan
,
T. H.
,
Alrefae
,
W. M. M.
,
Daradkeh
,
F. M.
,
El-Amin
,
M. A. M. M.
, …
Alboray
,
H. M. M.
(
2023
).
Satisfaction on the driving seat: Exploring the influence of social media marketing activities on followers’ purchase intention in the restaurant industry context
.
Sustainability
,
15
(
9
),
7207
. doi: .
Angelini
,
F.
,
Castellani
,
M.
, &
Pattitoni
,
P.
(
2023
).
Fine dining as a cultural good. An inquiry on chef’s creativity, restaurant quality, and gastronomic guides
.
An Inquiry on Chef’s Creativity, Restaurant Quality, and Gastronomic Guides
. doi: .
Angelini
,
F.
,
Castellani
,
M.
, &
Pattitoni
,
P.
(
2025
).
Evaluating chef’s creativity and restaurant quality: An empirical analysis of the role of gastronomic guides in the Italian fine-dining market
.
Kyklos
,
78
(
3
),
852
–
873
. doi: .
Ayvaz-Çavdaroğlu
,
N.
,
Iyanna
,
S.
, &
Foster
,
M.
(
2024
).
Smart service quality in hospitality – a quantitative assessment using MCDM and clustering methods
.
International Journal of Hospitality Management
,
123
(
September
), 103931. doi: .
Azzopardi
,
E.
, &
Nash
,
R.
(
2013
).
A critical evaluation of importance–performance analysis
.
Tourism Management
,
35
,
222
–
233
.
Basle
,
N.
(
2023
).
Evaluating gastronomic destination competitiveness through upscale gastronomy
.
Sustainability
,
15
(
14
),
11157
. doi: .
Bi
,
J. W.
,
Liu
,
Y.
,
Fan
,
Z. P.
, &
Zhang
,
J.
(
2019
).
Wisdom of crowds: Conducting importance-performance analysis (IPA) through online reviews
.
Tourism Management
,
70
(
March 2018
),
460
–
478
. doi: .
Bitner
,
M. J.
(
1992
).
Servicescapes: The impact of physical surroundings on customers and employees
.
Journal of Marketing
,
56
(
22
),
57
–
71
. doi: .
Carneiro
,
M. J.
,
Eusébio
,
C.
,
Caldeira
,
A.
, &
Santos
,
A. C.
(
2019
).
The influence of eventscape on emotions, satisfaction and loyalty: The case of re-enactment events
.
International Journal of Hospitality Management
,
82
(
April 2018
),
112
–
124
. doi: .
Carrasco
,
P.
, &
Dias
,
S.
(
2024
).
Enhancing restaurant management through aspect-based sentiment analysis and NLP techniques
.
Procedia Computer Science
,
237
(
2021
),
129
–
137
. doi: .
Chen
,
Y. S.
,
Raab
,
C.
, &
Chen
,
C. C.
(
2017
).
The influence of celebrity chefs on restaurant customers’ behavior
.
Journal of Hospitality Marketing & Management
,
26
(
5
),
489
–
510
. doi: .
Chen
,
J.
,
Becken
,
S.
, &
Stantic
,
B.
(
2022
).
Assessing destination satisfaction by social media: An innovative approach using Importance-Performance Analysis
.
Annals of Tourism Research
,
93
, 103371. doi: .
Choi
,
Y. J.
,
Jung
,
I. Y.
, &
Na
,
T. K.
(
2025
).
How place attachment moderates the relationship between perceived authenticity and revisit intention to time-honored restaurants
.
Sustainability
,
17
(
19
),
1
–
20
. doi: .
Chompupor
,
P.
,
Ghuangpeng
,
S.
,
Oğuz
,
U. K.
, &
Zerman
,
S.
(
2024
).
Thai street food as authentic tourism experience: The theory of consumption perspective
.
Journal of Foodservice Business Research
,
29
(
4
),
1
–
28
. doi: .
Dwivedi
,
Y. K.
,
Ismagilova
,
E.
,
Hughes
,
D. L.
,
Carlson
,
J.
,
Filieri
,
R.
,
Jacobson
,
J.
, …
Wang
,
Y.
(
2021
).
Setting the future of digital and social media marketing research: Perspectives and research propositions
.
International Journal of Information Management
,
59
(
June
), 102168. doi: .
Ferries
,
C.
(
2025
).
TripAdvisor statistics 2024
.
Available from:
 Link to the website
Fortune Business Insights
(
2025
).
Food service market size, share & industry analysis, by type (full service restaurants, quick service restaurants, institutes, and others), by restaurant type (chained, and independent), by service type (Dine-In, takeaway, and delivery), and regional fore
,
230
.
Available from:
 Link to the website
García-Fernández
,
J.
,
Fernández-Gavira
,
J.
,
Sánchez-Oliver
,
A. J.
,
Gálvez-Ruíz
,
P.
,
Grimaldi-Puyana
,
M.
, &
Cepeda-Carrión
,
G.
(
2020
).
Importance-performance matrix analysis (Ipma) to evaluate servicescape fitness consumer by gender and age
.
International Journal of Environmental Research and Public Health
,
17
(
18
),
1
–
19
. doi: .
Gera
,
A.
,
Halfon
,
A.
,
Ein-dor
,
L.
, &
Slonim
,
N.
(
2022
).
Zero-shot text classification with self-training
.
1107
–
1119
.
Goffi
,
G.
,
Osti
,
L.
,
King
,
B.
,
Osti
,
L.
, &
King
,
B.
(
2025
).
From plate to place : How authentic dining experiences in ethnic restaurants enhance national image and motivate travel ABSTRACT
.
Tourism Recreation Research
,
0
(
0
),
1
–
14
. doi: .
Graham
,
D.
,
Ali
,
A.
, &
Tajeddini
,
K.
(
2020
).
Open kitchens: Customers’ influence on chefs’ working practices
.
Journal of Hospitality and Tourism Management
,
45
,
27
–
36
. doi: .
Ha
,
J.
, &
Jang
,
S. C. S.
(
2010
).
Effects of service quality and food quality: The moderating role of atmospherics in an ethnic restaurant segment
.
International Journal of Hospitality Management
,
29
(
3
),
520
–
529
. doi: .
Halder
,
K.
,
Akbik
,
A.
,
Krapac
,
J.
, &
Vollgraf
,
R.
(
2020
).
Task-aware representation of sentences for generic text classification
. In
COLING 2020 - 28th International Conference on Computational Linguistics, Proceedings of the Conference
(pp. 
3202
–
3213
). doi: .
Hung
,
K.
,
Guillet
,
B. D.
, &
Zhang
,
H. Q.
(
2018
).
Understanding luxury shopping destination preference using conjoint analysis and traditional item-based measurement
,
58
(
3
),
411
–
426
. doi: .
Kar
,
M. V. D.
,
Xia
,
M.
,
Chen
,
D.
, &
Artetxe
,
M.
(
2022
).
Don’t prompt, search! Mining-Based zero-shot learning with language models
. In
Proceedings of the 2022 Conference on Empirical Methods in Natural Language Processing, EMNLP 2022
(pp. 
7508
–
7520
). doi: .
Karadağ
,
H.
,
Tosun
,
P.
, &
Ayan
,
B.
(
2024
).
User-generated and brand-generated content as indicators of university brand personality and business strategy
.
Journal of Marketing for Higher Education
,
34
(
2
),
646
–
668
. doi: .
Karnreungsiri
,
I.
(
2022
).
Applying importance-performance analysis for developing a model of quick service restaurant innovation strategies in downtown bangkok
.
ABAC Journal
,
42
(
2
),
27
–
51
.
Kau
,
A. K.
, &
Lim
,
P. S.
(
2005
).
Clustering of Chinese tourists to Singapore: an analysis of their motivations, values and satisfaction
.
International Journal of Tourism Research
,
7
(
4-5
),
231
–
248
. doi: .
Kim
,
J.-H.
,
Song
,
H.
,
Youn
,
H.
(
2019
).
The chain of effects from authenticity cues to purchase intention: The role of emotions and restaurant image
.
International Journal of Hospitality Management
,
8
(
5
),
55
.
Lee
,
T. H.
, &
Jan
,
F. H.
(
2019
).
Can community-based tourism contribute to sustainable development? Evidence from residents’ perceptions of the sustainability
.
Tourism Management
,
70
(
September 2017
),
368
–
380
. doi: .
Lee
,
R. S.
, &
Lee
,
S. Y.
(
2023
).
Analysis of relationship between service quality of food and beverage and customer behaviors for sustainable golf course management
.
Sustainability (Switzerland)
,
15
(
14
),
11207
. doi: .
Line
,
N. D.
,
Hanks
,
L.
, &
Kim
,
W. G.
(
2018
).
An expanded servicescape framework as the driver of place attachment and word of mouth
.
Journal of Hospitality & Tourism Research
,
42
(
3
),
476
–
499
. doi: .
Liu
,
H.
,
Li
,
H.
,
Dipietro
,
R. B.
, &
Levitt
,
J. A.
(
2018
).
The role of authenticity in mainstream ethnic restaurants Evidence from an independent full-service Italian restaurant
,
30
(
2
),
1035
–
1053
. doi: .
Mari
,
M.
, &
Poggesi
,
S.
(
2013
).
Servicescape cues and customer behavior: A systematic literature review and research agenda
.
Service Industries Journal
,
33
(
2
),
171
–
199
. doi: .
Mariani
,
M.
, &
Baggio
,
R.
(
2022
).
Big data and analytics in hospitality and tourism: A systematic literature review
.
International Journal of Contemporary Hospitality Management
,
34
(
1
),
231
–
278
. doi: .
Martilla
,
J. A.
, &
dan
,
J. C. J.
(
1977
).
Importance-per analysis
.
Journal of Marketing
,
41
(
1
),
77
–
79
.
Martín
,
D.
,
Gremler
,
D. D.
,
Washburn
,
J. H.
, &
Cepeda
,
G.
(
2008
).
Service value revisited: Specifying a higher-order, formative measure
.
Journal of Business Research
,
61
(
12
),
1278
–
1291
. doi: .
Nam
,
S.
, &
Lee
,
H. C.
(
2019
).
A text analytics-based importance performance analysis and its application to airline service
.
Sustainability
,
11
(
21
),
6153
. doi: .
Nam
,
D.
,
Lee
,
J.
, &
Lee
,
H.
(
2019
).
Business analytics adoption process: An innovation diffusion perspective
.
International Journal of Information Management
,
49
(
October 2018
),
411
–
423
. doi: .
Namkung
,
Y.
, &
Jang
,
S. C.
(
2008
).
Are highly satisfied restaurant customers really different? A quality perception perspective
.
International Journal of Contemporary Hospitality Management
,
20
(
2
),
142
–
155
. doi: .
Nawawi
,
I.
,
Ilmawan
,
K. F.
,
Maarif
,
M. R.
, &
Syafrudin
,
M.
(
2024
).
Exploring tourist experience through online reviews using aspect-based sentiment analysis with zero-shot learning for hospitality service enhancement
.
Information
,
15
(
8
),
499
. doi: .
Nguyen
,
T. T. T.
, &
Tong
,
S.
(
2023
).
The impact of user-generated content on intention to select a travel destination
.
Journal of Marketing Analytics
,
11
(
3
),
443
–
457
. doi: .
Oh
,
H.
(
2001
).
Revisiting importance – performance analysis
.
Tourism Management
,
22
(
September 2000
),
617
–
627
. doi: .
Ozcelik
,
A.
, &
Akova
,
O.
(
2021
).
The impact of street food experience on behavioural intention
.
British Food Journal
,
123
(
12
),
4175
–
4193
. doi: .
Parasuraman
,
A.
, &
Zeithaml
,
V.
(
1988
).
SERVQUAL: A multiple-item scale for measuring consumer perceptions of service quality
.
Journal of Retailing
,
64
(
1
),
12
–
40
.
Parasuraman
,
A. P.
,
Berry
,
L. L.
, &
Zeithaml
,
V. A.
(
1991
).
Understanding customer expectations of service understanding customer expectations of service
.
Sloan Management Review
,
32
(
3
),
39
–
48
.
Paunić
,
M.
,
Kalenjuk Pivarski
,
B.
,
Tešanović
,
D.
,
Novaković
,
D.
,
Šmugović
,
S.
,
Šarenac
,
N.
, …
Marjanović
,
J.
(
2024
).
Gastronomic identity factors in the function of sustainable gastronomy: A case study of tourist destinations in the republic of Serbia and Bosnia and Herzegovina
.
Sustainability
,
16
(
19
),
8493
. doi: .
Pop
,
R. A.
,
Săplăcan
,
Z.
,
Dabija
,
D. C.
, &
Alt
,
M. A.
(
2022
).
The impact of social media influencers on travel decisions: The role of trust in consumer decision journey
.
Current Issues in Tourism
,
25
(
5
),
823
–
843
. doi: .
Rasoolimanesh
,
S. M.
,
Seyfi
,
S.
,
Hall
,
C. M.
, &
Hatamifar
,
P.
(
2021
).
Understanding memorable tourism experiences and behavioural intentions of heritage tourists
.
Journal of Destination Marketing & Management
,
21
(
September
), 100621. doi: .
Reimers
,
N.
, &
Gurevych
,
I.
(
2019
).
Sentence-BERT: Sentence embeddings using siamese BERT-networks
. In
EMNLP-IJCNLP 2019 - 2019 Conference on Empirical Methods in Natural Language Processing and 9th International Joint Conference on Natural Language Processing, Proceedings of the Conference
(pp. 
3982
–
3992
). doi: .
Restrowork
(
2025
).
Global restaurant industry statistics 2025: Market size, growth trends & key data
.
Available from:
 Link to the website
Seo
,
K. H.
, &
Lee
,
J. H.
(
2025
).
The impact of service quality on perceived value, image, satisfaction, and revisit intention in robotic restaurants for sustainability
.
Sustainability
,
17
(
16
),
1
–
16
. doi: .
Sithole
,
M. V.
,
Roux
,
T.
, &
Retief
,
M.
(
2025
).
Experiential marketing through service quality antecedents: Customer experience as a driver of satisfaction and revisit intentions in South African restaurants
.
Tourism and Hospitality
,
6
(
5
),
227
. doi: .
Slack
,
N. J.
,
Singh
,
G.
,
Ali
,
J.
,
Lata
,
R.
,
Mudaliar
,
K.
, &
Swamy
,
Y.
(
2021
).
Influence of fast-food restaurant service quality and its dimensions on customer perceived value, satisfaction and behavioural intentions
.
British Food Journal
,
123
(
4
),
1324
–
1344
. doi: .
Smith
,
A. K.
, &
Bolton
,
R. N.
(
2002
).
The effect of customers’ emotional responses to service failures on their recovery effort evaluations and satisfaction judgments
.
Journal of the Academy of Marketing Science
,
30
(
1
),
5
–
23
. doi: .
Song
,
H.
,
Yang
,
H.
, &
Sthapit
,
E.
(
2025
).
Robotic service quality, authenticity, and revisit intention to restaurants in China: Extending cognitive appraisal theory
.
International Journal of Contemporary Hospitality Management
,
37
(
5
),
1497
–
1515
. doi: .
Stevens
,
P.
,
Knutson
,
B.
, &
Patton
,
M.
(
1995
).
Dineserv: A tool for measuring service quality in restaurants
.
Cornell Hotel and Restaurant Administration Quarterly
,
36
(
2
),
56
–
60
. doi: .
Zeithaml
,
V. A.
,
Berry
,
L. L.
, &
Parasuraman
,
A.
(
1996
).
The behavioral consequences of service quality
.
Journal OfMarketing
,
60
(
2
),
31
–
46
. doi: .
Zhong
,
Y.
, &
Moon
,
H. C.
(
2020
).
What drives customer satisfaction, loyalty, and happiness in fast-food restaurants in China? Perceived price, service quality, food quality, physical environment quality, and the moderating role of gender
.
Foods
,
9
(
4
),
1
–
16
. doi: .
Keller
,
K. L.
(
2013
).
Conceptualizing, measuring, and managing customer-based brand equity
.
Journal of Marketing
,
57
(
1
),
1
–
22
.
Keyt
,
J. C.
,
Yavas
,
U.
, &
Riecken
,
G.
(
1994
).
Importance-performance analysis: A case study in restaurant positioning
.
International Journal of Retail & Distribution Management
,
22
(
5
),
35
–
40
. doi: .
Lane
,
C.
(
2013
).
Taste makers in the ‘fine-dining’ restaurant industry: The attribution of aesthetic and economic value by gastronomic guides
.
Poetics
,
41
(
4
),
342
–
365
. doi: .
Marković
,
S.
,
Raspor
,
S.
, &
Šegarić
,
K.
(
2010
).
Does restaurant performance meet customers’ expectations? An assessment of restaurant service quality using a modified DINESERV approach
.
Tourism and Hospitality Management
,
16
(
2
),
181
–
195
. doi: .
Ryu
,
K.
, &
Shawn Jang
,
S.
(
2008
).
DINESCAPE: A scale for customers’ perception of dining environments
.
Journal of Foodservice Business Research
,
11
(
1
),
2
–
22
. doi: .
Published in ABAC Journal. Published by Emerald Publishing Limited. This article is published under the Creative Commons Attribution (CC BY 4.0) licence. Anyone may reproduce, distribute, translate and create derivative works of this article (for both commercial and non-commercial purposes), subject to full attribution to the original publication and authors. The full terms of this licence may be seen at Link to the terms of the CC BY 4.0 licence.

Data & Figures

Figure 1
A flowchart illustrating the stages of a methodological framework linking tourism context, data, modeling, and evaluation.The flowchart begins with Step 1, Construct review observations. Step 2 involves creating segments based on Price and User Rating. A decision point follows, checking if English text is available. If yes, proceed to Step 4, Clean text and sentence split. If no, proceed to Step 3, Translate to English, then return to Step 4. Step 5 involves embedding sentences and attribute prompts. Step 6 sets a similarity threshold to select sentences. Step 7 scores sentiment on selected sentences. Step 8 aggregates to review attribute sentiment. Step 9 classifies the data using zero-shot techniques. Finally, Step 10 computes IPA, importance, and performance.

Overall methodological framework linking tourism context, data, modeling, and evaluation

Figure 1
A flowchart illustrating the stages of a methodological framework linking tourism context, data, modeling, and evaluation.The flowchart begins with Step 1, Construct review observations. Step 2 involves creating segments based on Price and User Rating. A decision point follows, checking if English text is available. If yes, proceed to Step 4, Clean text and sentence split. If no, proceed to Step 3, Translate to English, then return to Step 4. Step 5 involves embedding sentences and attribute prompts. Step 6 sets a similarity threshold to select sentences. Step 7 scores sentiment on selected sentences. Step 8 aggregates to review attribute sentiment. Step 9 classifies the data using zero-shot techniques. Finally, Step 10 computes IPA, importance, and performance.

Overall methodological framework linking tourism context, data, modeling, and evaluation

Close Figure 1
Figure 2
A bar graph comparing the count of restaurant review records in various destinations by price group.The bar graph compares the count of restaurant review records in six destinations categorized by price group. The destinations are Bangkok, Thailand; Chiang Mai, Thailand; Hong Kong, SAR China; Kyoto, Japan; Mumbai, India; and Penang, Malaysia. The price groups are Cheap Eats, Mid Range, and Fine Dining, represented by dark blue, teal, and green bars respectively. The x-axis lists the destinations, and the y-axis shows the count of review records ranging from 0 to 45,000. Bangkok, Thailand has the highest count in the Fine Dining category with 42,043 records, while Penang, Malaysia has the lowest count in the same category with 4,759 records. All values are approximated.

Count of restaurant review records in each destination categorized by price group

Figure 2
A bar graph comparing the count of restaurant review records in various destinations by price group.The bar graph compares the count of restaurant review records in six destinations categorized by price group. The destinations are Bangkok, Thailand; Chiang Mai, Thailand; Hong Kong, SAR China; Kyoto, Japan; Mumbai, India; and Penang, Malaysia. The price groups are Cheap Eats, Mid Range, and Fine Dining, represented by dark blue, teal, and green bars respectively. The x-axis lists the destinations, and the y-axis shows the count of review records ranging from 0 to 45,000. Bangkok, Thailand has the highest count in the Fine Dining category with 42,043 records, while Penang, Malaysia has the lowest count in the same category with 4,759 records. All values are approximated.

Count of restaurant review records in each destination categorized by price group

Close Figure 2
Figure 3
A line graph titled ROC Curves showing the performance of different classifiers.A line graph titled ROC Curves with the horizontal axis labeled False Positive Rate ranging from 0.0 to 1.0 and the vertical axis labeled True Positive Rate ranging from 0.0 to 1.0. The graph includes six lines representing different classifiers: Price in blue, Convenience in orange, Service in green, Food in red, Atmosphere in purple, and Chef in brown. Each line shows the performance of the classifier with varying false positive rates. The Area Under the Curve (AUC) values are provided in the legend: Price (AUC = 0.93), Convenience (AUC = 0.90), Service (AUC = 0.96), Food (AUC = 0.86), Atmosphere (AUC = 0.66), and Chef (AUC = 0.96). The lines generally trend upwards, indicating the true positive rate increases with the false positive rate. The Service and Chef lines are the highest, indicating the best performance, while the Atmosphere line is the lowest, indicating the poorest performance.

Receiver operating characteristic curves for zero-shot classification

Figure 3
A line graph titled ROC Curves showing the performance of different classifiers.A line graph titled ROC Curves with the horizontal axis labeled False Positive Rate ranging from 0.0 to 1.0 and the vertical axis labeled True Positive Rate ranging from 0.0 to 1.0. The graph includes six lines representing different classifiers: Price in blue, Convenience in orange, Service in green, Food in red, Atmosphere in purple, and Chef in brown. Each line shows the performance of the classifier with varying false positive rates. The Area Under the Curve (AUC) values are provided in the legend: Price (AUC = 0.93), Convenience (AUC = 0.90), Service (AUC = 0.96), Food (AUC = 0.86), Atmosphere (AUC = 0.66), and Chef (AUC = 0.96). The lines generally trend upwards, indicating the true positive rate increases with the false positive rate. The Service and Chef lines are the highest, indicating the best performance, while the Atmosphere line is the lowest, indicating the poorest performance.

Receiver operating characteristic curves for zero-shot classification

Close Figure 3
Figure 4
A bar graph comparing the percentage of reviews mentioning each topic by price group.The bar graph compares the percentage of reviews mentioning each topic by price group. The x-axis lists three price groups: Cheap Eats, Midrange Price, and Fine Dining. The y-axis represents the percentage of reviews, ranging from 0 to 80 percent. There are five data series represented by different colors: Predicted Price in yellow, Predicted Convenience in green, Predicted Service Quality in teal, Predicted Food Quality in blue, and Predicted Chef in purple. For Cheap Eats, Predicted Food Quality is the highest at 73.9 percent, followed by Predicted Chef at 36.2 percent, Predicted Service Quality at 18.3 percent, Predicted Convenience at 2.2 percent, and Predicted Price at 1.9 percent. For Midrange Price, Predicted Food Quality is again the highest at 73.9 percent, followed by Predicted Chef at 43.5 percent, Predicted Service Quality at 32 percent, Predicted Convenience at 1.1 percent, and Predicted Price at 1.5 percent. All values are approximated.

Comparative frequency of discussion topics categorized by price groups

Figure 4
A bar graph comparing the percentage of reviews mentioning each topic by price group.The bar graph compares the percentage of reviews mentioning each topic by price group. The x-axis lists three price groups: Cheap Eats, Midrange Price, and Fine Dining. The y-axis represents the percentage of reviews, ranging from 0 to 80 percent. There are five data series represented by different colors: Predicted Price in yellow, Predicted Convenience in green, Predicted Service Quality in teal, Predicted Food Quality in blue, and Predicted Chef in purple. For Cheap Eats, Predicted Food Quality is the highest at 73.9 percent, followed by Predicted Chef at 36.2 percent, Predicted Service Quality at 18.3 percent, Predicted Convenience at 2.2 percent, and Predicted Price at 1.9 percent. For Midrange Price, Predicted Food Quality is again the highest at 73.9 percent, followed by Predicted Chef at 43.5 percent, Predicted Service Quality at 32 percent, Predicted Convenience at 1.1 percent, and Predicted Price at 1.5 percent. All values are approximated.

Comparative frequency of discussion topics categorized by price groups

Close Figure 4
Figure 5
A correlation matrix showing relationships between different dining attributes.A correlation matrix with six rows and six columns, displaying the relationships between different dining attributes. The attributes listed along both the rows and columns are Price, Convenience, Service Quality, Food Quality, Atmosphere, and Chef. The matrix is symmetrical with correlation coefficients ranging from -0.4 to 1.0. The diagonal elements all show a correlation of 1.0, indicating perfect correlation of each attribute with itself. Notable trends include a strong positive correlation between Service Quality and Food Quality at 0.54, and between Food Quality and Chef at 0.56. There is a moderate positive correlation between Price and Atmosphere at 0.37. Negative correlations are observed between Food Quality and Atmosphere at -0.33, and between Atmosphere and Chef at -0.18. The color gradient from blue to red indicates the strength and direction of the correlations, with blue representing negative correlations and red representing positive correlations.

Pearson correlation matrix of dining attributes

Figure 5
A correlation matrix showing relationships between different dining attributes.A correlation matrix with six rows and six columns, displaying the relationships between different dining attributes. The attributes listed along both the rows and columns are Price, Convenience, Service Quality, Food Quality, Atmosphere, and Chef. The matrix is symmetrical with correlation coefficients ranging from -0.4 to 1.0. The diagonal elements all show a correlation of 1.0, indicating perfect correlation of each attribute with itself. Notable trends include a strong positive correlation between Service Quality and Food Quality at 0.54, and between Food Quality and Chef at 0.56. There is a moderate positive correlation between Price and Atmosphere at 0.37. Negative correlations are observed between Food Quality and Atmosphere at -0.33, and between Atmosphere and Chef at -0.18. The color gradient from blue to red indicates the strength and direction of the correlations, with blue representing negative correlations and red representing positive correlations.

Pearson correlation matrix of dining attributes

Close Figure 5
Figure 6
A matrix showing correlation values between different attributes across three price tiers: Cheap Eats, Midrange Price, and Fine Dining.The matrix displays correlation values between attributes such as Price, Convenience, Service Quality, Food Quality, Atmosphere, and Chef across three price tiers: Cheap Eats, Midrange Price, and Fine Dining. Each tier has a separate matrix with six rows and six columns. The diagonal elements are all 1.0, indicating perfect correlation of each attribute with itself. Notable trends include strong positive correlations between Convenience and Service Quality, and between Food Quality and Chef across all tiers. Negative correlations are observed between Price and Food Quality in the Cheap Eats tier, and between Atmosphere and Food Quality in the Fine Dining tier.

Attribute correlations across price tiers

Figure 6
A matrix showing correlation values between different attributes across three price tiers: Cheap Eats, Midrange Price, and Fine Dining.The matrix displays correlation values between attributes such as Price, Convenience, Service Quality, Food Quality, Atmosphere, and Chef across three price tiers: Cheap Eats, Midrange Price, and Fine Dining. Each tier has a separate matrix with six rows and six columns. The diagonal elements are all 1.0, indicating perfect correlation of each attribute with itself. Notable trends include strong positive correlations between Convenience and Service Quality, and between Food Quality and Chef across all tiers. Negative correlations are observed between Price and Food Quality in the Cheap Eats tier, and between Atmosphere and Food Quality in the Fine Dining tier.

Attribute correlations across price tiers

Close Figure 6
Figure 7
Six word clouds representing keywords related to various restaurant attributes.Six word clouds side by side representing keywords related to various restaurant attributes. Panel A shows Price and Value with words like quality, prices, and value prominently displayed. Panel B shows Convenience with words like atmosphere, table, and friendly highlighted. Panel C shows Service Quality with words like friendly, quality, and experience emphasized. Panel D shows Food Quality with words like taste, meal, and friendly in large fonts. Panel E shows Atmosphere with words like atmosphere, friendly, and beautiful standing out. Panel F shows Chef with words like tasted, dishes, and friendly prominently displayed.

Word clouds of keywords related to restaurant attributes

Figure 7
Six word clouds representing keywords related to various restaurant attributes.Six word clouds side by side representing keywords related to various restaurant attributes. Panel A shows Price and Value with words like quality, prices, and value prominently displayed. Panel B shows Convenience with words like atmosphere, table, and friendly highlighted. Panel C shows Service Quality with words like friendly, quality, and experience emphasized. Panel D shows Food Quality with words like taste, meal, and friendly in large fonts. Panel E shows Atmosphere with words like atmosphere, friendly, and beautiful standing out. Panel F shows Chef with words like tasted, dishes, and friendly prominently displayed.

Word clouds of keywords related to restaurant attributes

Close Figure 7
Figure 8
A scatter plot of importance versus performance for the cheap eats group.A scatter plot with six data points representing different factors in the cheap eats group. The x-axis represents performance measured by mean sentiment, ranging from 0.30 to 0.55. The y-axis represents importance measured by correlation with rating, ranging from 0.20 to 0.45. The data points are labeled as Service Quality, Food Quality, Atmosphere, Chef, Convenience, and Price and Value. Service Quality has the highest performance and importance, while Price and Value has the lowest performance and importance. All values are approximated.

TAIPA scatter plot for the Cheap Eats group

Figure 8
A scatter plot of importance versus performance for the cheap eats group.A scatter plot with six data points representing different factors in the cheap eats group. The x-axis represents performance measured by mean sentiment, ranging from 0.30 to 0.55. The y-axis represents importance measured by correlation with rating, ranging from 0.20 to 0.45. The data points are labeled as Service Quality, Food Quality, Atmosphere, Chef, Convenience, and Price and Value. Service Quality has the highest performance and importance, while Price and Value has the lowest performance and importance. All values are approximated.

TAIPA scatter plot for the Cheap Eats group

Close Figure 8
Figure 9
A scatter plot showing the relationship between performance and importance for various attributes in the midrange price segment.A scatter plot titled IPA (Price segment): Midrange Price (n = 119,483) representing the relationship between performance (mean sentiment) on the horizontal axis and importance (correlation with rating and fallback coverage) on the vertical axis. The plot includes six data points labeled as Service Quality, Food Quality, Price and Value, Convenience, Atmosphere, and Chef. Service Quality and Food Quality are positioned high on the importance axis but vary in performance. Price and Value is centrally located, while Convenience is lower in importance. Atmosphere shows high performance but moderate importance, and Chef has the highest performance but the lowest importance. The plot indicates varying degrees of correlation between performance and importance for different attributes.

TAIPA scatter plot for the Midrange group

Figure 9
A scatter plot showing the relationship between performance and importance for various attributes in the midrange price segment.A scatter plot titled IPA (Price segment): Midrange Price (n = 119,483) representing the relationship between performance (mean sentiment) on the horizontal axis and importance (correlation with rating and fallback coverage) on the vertical axis. The plot includes six data points labeled as Service Quality, Food Quality, Price and Value, Convenience, Atmosphere, and Chef. Service Quality and Food Quality are positioned high on the importance axis but vary in performance. Price and Value is centrally located, while Convenience is lower in importance. Atmosphere shows high performance but moderate importance, and Chef has the highest performance but the lowest importance. The plot indicates varying degrees of correlation between performance and importance for different attributes.

TAIPA scatter plot for the Midrange group

Close Figure 9
Figure 10
A scatter plot of fine dining group performance and importance.A scatter plot representing the relationship between performance and importance for the fine dining group. The x-axis represents performance measured by mean sentiment, ranging from 0.25 to 0.60. The y-axis represents importance measured by correlation with rating, ranging from 0.24 to 0.34. The plot includes six labeled data points: Food Quality, Service Quality, Atmosphere, Price and Value, Convenience, and Chef. Food Quality and Service Quality are positioned in the upper right quadrant, indicating high performance and high importance. Atmosphere is in the upper middle, showing high importance but moderate performance. Price and Value is in the middle left, indicating moderate importance and performance. Convenience is in the lower middle, showing low importance and moderate performance. Chef is in the lower right, indicating low importance but high performance. All values are approximated.

TAIPA scatter plot for the Fine Dining group

Figure 10
A scatter plot of fine dining group performance and importance.A scatter plot representing the relationship between performance and importance for the fine dining group. The x-axis represents performance measured by mean sentiment, ranging from 0.25 to 0.60. The y-axis represents importance measured by correlation with rating, ranging from 0.24 to 0.34. The plot includes six labeled data points: Food Quality, Service Quality, Atmosphere, Price and Value, Convenience, and Chef. Food Quality and Service Quality are positioned in the upper right quadrant, indicating high performance and high importance. Atmosphere is in the upper middle, showing high importance but moderate performance. Price and Value is in the middle left, indicating moderate importance and performance. Convenience is in the lower middle, showing low importance and moderate performance. Chef is in the lower right, indicating low importance but high performance. All values are approximated.

TAIPA scatter plot for the Fine Dining group

Close Figure 10
Figure 11
A scatter plot showing the importance and performance of various factors in a rating segment.A scatter plot representing the relationship between the performance (mean sentiment) and importance (coverage within rating segment) of various factors. The horizontal axis represents performance with a range from -0.15 to 0.15, and the vertical axis represents importance with a range from 0.0 to 0.4. The plot includes six data points labeled as Food Quality, Atmosphere, Service Quality, Chef, Convenience, and Price and Value. Food Quality has the highest importance and positive performance. Atmosphere shows high importance but lower performance. Service Quality has moderate importance and negative performance. Chef has low importance but positive performance. Convenience and Price and Value have low importance and negative performance. The plot shows a reference line at the origin (0,0) for both axes.

TAIPA scatter plot for rating 1

Figure 11
A scatter plot showing the importance and performance of various factors in a rating segment.A scatter plot representing the relationship between the performance (mean sentiment) and importance (coverage within rating segment) of various factors. The horizontal axis represents performance with a range from -0.15 to 0.15, and the vertical axis represents importance with a range from 0.0 to 0.4. The plot includes six data points labeled as Food Quality, Atmosphere, Service Quality, Chef, Convenience, and Price and Value. Food Quality has the highest importance and positive performance. Atmosphere shows high importance but lower performance. Service Quality has moderate importance and negative performance. Chef has low importance but positive performance. Convenience and Price and Value have low importance and negative performance. The plot shows a reference line at the origin (0,0) for both axes.

TAIPA scatter plot for rating 1

Close Figure 11
Figure 12
A scatter plot of importance versus performance for rating segment 2.A scatter plot with several data points representing different factors affecting rating segment 2. The x-axis represents performance measured by mean sentiment, ranging from 0.050 to 0.225. The y-axis represents importance measured by coverage within the rating segment, ranging from 0.1 to 0.6. Key labeled data points include Food Quality, Atmosphere, Service Quality, Chef, Convenience, and Price and Value. Food Quality has the highest importance and moderate performance, while Chef has high performance but lower importance. Service Quality, Convenience, and Price and Value cluster together with lower performance and importance. Atmosphere shows moderate performance and importance. All values are approximated.

TAIPA scatter plot for rating 2

Figure 12
A scatter plot of importance versus performance for rating segment 2.A scatter plot with several data points representing different factors affecting rating segment 2. The x-axis represents performance measured by mean sentiment, ranging from 0.050 to 0.225. The y-axis represents importance measured by coverage within the rating segment, ranging from 0.1 to 0.6. Key labeled data points include Food Quality, Atmosphere, Service Quality, Chef, Convenience, and Price and Value. Food Quality has the highest importance and moderate performance, while Chef has high performance but lower importance. Service Quality, Convenience, and Price and Value cluster together with lower performance and importance. Atmosphere shows moderate performance and importance. All values are approximated.

TAIPA scatter plot for rating 2

Close Figure 12
Figure 13
A scatter plot showing the relationship between performance and importance for various factors in a rating segment.A scatter plot titled IPA (Rating segment): 3 (n = 13,687) represents the relationship between performance (mean sentiment) on the horizontal axis and importance (coverage within rating segment) on the vertical axis. The plot includes six data points labeled as Food Quality, Atmosphere, Service Quality, Chef, Convenience, and Price and Value. Food Quality has the highest importance and a high performance value, while Price and Value has the lowest importance and performance value. Atmosphere and Service Quality have high performance values but moderate importance. Chef has a moderate performance value and importance. Convenience has a low performance value and importance. The plot shows a positive correlation between performance and importance, with a reference line dividing the plot into four quadrants.

TAIPA scatter plot for rating 3

Figure 13
A scatter plot showing the relationship between performance and importance for various factors in a rating segment.A scatter plot titled IPA (Rating segment): 3 (n = 13,687) represents the relationship between performance (mean sentiment) on the horizontal axis and importance (coverage within rating segment) on the vertical axis. The plot includes six data points labeled as Food Quality, Atmosphere, Service Quality, Chef, Convenience, and Price and Value. Food Quality has the highest importance and a high performance value, while Price and Value has the lowest importance and performance value. Atmosphere and Service Quality have high performance values but moderate importance. Chef has a moderate performance value and importance. Convenience has a low performance value and importance. The plot shows a positive correlation between performance and importance, with a reference line dividing the plot into four quadrants.

TAIPA scatter plot for rating 3

Close Figure 13
Figure 14
A scatter plot showing performance versus importance for different factors.A scatter plot with the x-axis labeled 'Performance (mean sentiment)' and the y-axis labeled 'Importance (coverage within rating segment)'. The plot includes several data points representing different factors: Food Quality, Atmosphere, Service Quality, Chef, Convenience, and Price and Value. Food Quality has the highest importance and performance, while Price and Value has the lowest. The plot shows a positive correlation between performance and importance. All values are approximated.

TAIPA scatter plot for rating 4

Figure 14
A scatter plot showing performance versus importance for different factors.A scatter plot with the x-axis labeled 'Performance (mean sentiment)' and the y-axis labeled 'Importance (coverage within rating segment)'. The plot includes several data points representing different factors: Food Quality, Atmosphere, Service Quality, Chef, Convenience, and Price and Value. Food Quality has the highest importance and performance, while Price and Value has the lowest. The plot shows a positive correlation between performance and importance. All values are approximated.

TAIPA scatter plot for rating 4

Close Figure 14
Figure 15
A scatter plot showing the relationship between performance and importance for various factors.A scatter plot titled IPA (Rating segment): 5 (n = 228,178) represents the relationship between performance (mean sentiment) on the horizontal axis and importance (coverage within rating segment) on the vertical axis. The plot includes six data points labeled as Food Quality, Atmosphere, Service Quality, Cleanliness, Convenience, and Price and Value. Food Quality has the highest importance and performance, while Price and Value has the lowest importance and performance. Atmosphere and Service Quality show high performance but moderate importance. Cleanliness and Convenience are clustered together with moderate performance and importance. The plot features dashed reference lines at approximately 0.55 on the horizontal axis and 0.3 on the vertical axis.

TAIPA scatter plot for rating 5

Figure 15
A scatter plot showing the relationship between performance and importance for various factors.A scatter plot titled IPA (Rating segment): 5 (n = 228,178) represents the relationship between performance (mean sentiment) on the horizontal axis and importance (coverage within rating segment) on the vertical axis. The plot includes six data points labeled as Food Quality, Atmosphere, Service Quality, Cleanliness, Convenience, and Price and Value. Food Quality has the highest importance and performance, while Price and Value has the lowest importance and performance. Atmosphere and Service Quality show high performance but moderate importance. Cleanliness and Convenience are clustered together with moderate performance and importance. The plot features dashed reference lines at approximately 0.55 on the horizontal axis and 0.3 on the vertical axis.

TAIPA scatter plot for rating 5

Close Figure 15
Table 1

Dataset and segmentation summary categorized by rating and price group (N = 300,784)

Segmentation dimensionGroupNumber of records
Rating13,875
24,550
313,678
450,500
5228,178
Price GroupsFine Dining105,366
Midrange Price119,483
Cheap Eats75,935
Table 2

Performance metrics for zero-shot classification

AttributeAccuracyPrecisionRecallF1-scoreAUC
Price and value0.9870.0540.550.0980.931
Convenience0.9840.0750.2430.1140.897
Service0.7120.0540.9880.1030.956
Food0.7810.7240.9630.8270.862
Atmosphere0.7990.6870.0360.0690.657
Chef0.5870.0330.990.0630.956
Table 3

Recommended corpus frequency

PriceConvenienceService quality
KeywordCountFrequency (%)KeywordCountFrequency (%)KeywordCountFrequency (%)
price1,68635.12location23619.59service70,44547.32
value50710.56convenient22018.26staff30,46520.46
reasonable4729.83easy19115.85friendly16,50011.08
worth3727.75find16013.28attentive7,3204.92
money3477.23parking988.13helpful6,0324.05
cheap3016.27near584.81wait2,9762.00
expensive2705.62walk564.65waiter2,8311.90
cost2114.39close473.90fast2,8231.90
baht1873.90far373.07manager2,6111.75
pay1402.92access332.74waitress1,8781.26
paid931.94car241.99welcome1,8081.21
affordable891.85park201.66serving1,6581.11
bill771.60distance100.83slow9090.61
overpriced310.65traffic90.75rude4660.31
budget180.37map60.50greet1540.10
Total4,801 Total1,205 Total148,876 
Food qualityAtmosphereChef
KeywordCountFrequency (%)KeywordCountFrequency (%)KeywordCountFrequency (%)
food179,91345.81atmosphere2,22146.64chef16,32544.38
delicious50,23812.79nice84217.68prepared3,85910.49
taste28,6597.30view81417.09kitchen3,71610.10
menu27,5787.02beautiful2815.90owner3,67810.00
fresh22,4925.73music2324.87cooking2,7907.59
tasty17,4064.43environment871.83cook1,8915.14%
dish16,9134.31clean531.11culinary1,3803.75
sweet11,7753.00decor450.94hand1,0922.97
spicy8,5572.18vibe410.86prepare7071.92
hot7,0191.79quiet380.80master6231.69
flavor6,6811.70ambiance330.69omakase4591.25
yummy4,3411.11seating250.52skill2620.71
portion4,2931.09design220.46   
cold4,1141.05loud200.42   
salty1,7230.44noise80.17   
bland1,0660.27      
Total392,768 Total4,762 Total36,782 
Table 4

TAIPA quadrant membership summary by price group

Price groupN records (segment_n)Keep up the good workConcentrate hereLow priorityPossible overkill
Cheap Eats75,935Food Quality; Service Quality Convenience; Price and ValueAtmosphere; Chef
Midrange119,483Food Quality; Atmosphere; Service QualityPrice and ValueConvenienceChef
Fine Dining105,366Food Quality; Atmosphere; Service QualityPrice and ValueConvenienceChef
Table 5

TAIPA quadrant membership summary by rating group (1–5)

Rating groupN records (segment_n)Keep up the good workConcentrate hereLow priorityPossible overkill
13,875Food Quality; AtmosphereService QualityConvenience; Price and ValueChef
24,550Food Quality; Atmosphere Service Quality; Convenience; Price and ValueChef
313,678Food Quality; Atmosphere Convenience; Price and ValueService Quality; Chef
450,500Food Quality; Atmosphere Convenience; Price and ValueService Quality; Chef
5228,178Food Quality; Atmosphere Convenience; Price and ValueService Quality; Chef

Supplements

References

Abdien
,
M. K.
(
2019
).
An assessment of dinescape and customers’ behavioral intentions in fast food restaurants
.
Journal of Tourism Research
,
23
.
Available from:
 Link to the website
Ai-Hsuan
,
C.
, &
Trimi
,
S.
(
2020
).
Impacts of service robots on service quality
.
Service Business
,
14
(
3
),
439
–
459
. doi: .
Akdere
,
M.
,
Top
,
M.
, &
Tekingündüz
,
S.
(
2020
).
Examining patient perceptions of service quality in Turkish hospitals: The SERVPERF model
.
Total Quality Management and Business Excellence
,
31
(
3-4
),
342
–
352
. doi: .
Anas
,
A. M.
,
Abdou
,
A. H.
,
Hassan
,
T. H.
,
Alrefae
,
W. M. M.
,
Daradkeh
,
F. M.
,
El-Amin
,
M. A. M. M.
, …
Alboray
,
H. M. M.
(
2023
).
Satisfaction on the driving seat: Exploring the influence of social media marketing activities on followers’ purchase intention in the restaurant industry context
.
Sustainability
,
15
(
9
),
7207
. doi: .
Angelini
,
F.
,
Castellani
,
M.
, &
Pattitoni
,
P.
(
2023
).
Fine dining as a cultural good. An inquiry on chef’s creativity, restaurant quality, and gastronomic guides
.
An Inquiry on Chef’s Creativity, Restaurant Quality, and Gastronomic Guides
. doi: .
Angelini
,
F.
,
Castellani
,
M.
, &
Pattitoni
,
P.
(
2025
).
Evaluating chef’s creativity and restaurant quality: An empirical analysis of the role of gastronomic guides in the Italian fine-dining market
.
Kyklos
,
78
(
3
),
852
–
873
. doi: .
Ayvaz-Çavdaroğlu
,
N.
,
Iyanna
,
S.
, &
Foster
,
M.
(
2024
).
Smart service quality in hospitality – a quantitative assessment using MCDM and clustering methods
.
International Journal of Hospitality Management
,
123
(
September
), 103931. doi: .
Azzopardi
,
E.
, &
Nash
,
R.
(
2013
).
A critical evaluation of importance–performance analysis
.
Tourism Management
,
35
,
222
–
233
.
Basle
,
N.
(
2023
).
Evaluating gastronomic destination competitiveness through upscale gastronomy
.
Sustainability
,
15
(
14
),
11157
. doi: .
Bi
,
J. W.
,
Liu
,
Y.
,
Fan
,
Z. P.
, &
Zhang
,
J.
(
2019
).
Wisdom of crowds: Conducting importance-performance analysis (IPA) through online reviews
.
Tourism Management
,
70
(
March 2018
),
460
–
478
. doi: .
Bitner
,
M. J.
(
1992
).
Servicescapes: The impact of physical surroundings on customers and employees
.
Journal of Marketing
,
56
(
22
),
57
–
71
. doi: .
Carneiro
,
M. J.
,
Eusébio
,
C.
,
Caldeira
,
A.
, &
Santos
,
A. C.
(
2019
).
The influence of eventscape on emotions, satisfaction and loyalty: The case of re-enactment events
.
International Journal of Hospitality Management
,
82
(
April 2018
),
112
–
124
. doi: .
Carrasco
,
P.
, &
Dias
,
S.
(
2024
).
Enhancing restaurant management through aspect-based sentiment analysis and NLP techniques
.
Procedia Computer Science
,
237
(
2021
),
129
–
137
. doi: .
Chen
,
Y. S.
,
Raab
,
C.
, &
Chen
,
C. C.
(
2017
).
The influence of celebrity chefs on restaurant customers’ behavior
.
Journal of Hospitality Marketing & Management
,
26
(
5
),
489
–
510
. doi: .
Chen
,
J.
,
Becken
,
S.
, &
Stantic
,
B.
(
2022
).
Assessing destination satisfaction by social media: An innovative approach using Importance-Performance Analysis
.
Annals of Tourism Research
,
93
, 103371. doi: .
Choi
,
Y. J.
,
Jung
,
I. Y.
, &
Na
,
T. K.
(
2025
).
How place attachment moderates the relationship between perceived authenticity and revisit intention to time-honored restaurants
.
Sustainability
,
17
(
19
),
1
–
20
. doi: .
Chompupor
,
P.
,
Ghuangpeng
,
S.
,
Oğuz
,
U. K.
, &
Zerman
,
S.
(
2024
).
Thai street food as authentic tourism experience: The theory of consumption perspective
.
Journal of Foodservice Business Research
,
29
(
4
),
1
–
28
. doi: .
Dwivedi
,
Y. K.
,
Ismagilova
,
E.
,
Hughes
,
D. L.
,
Carlson
,
J.
,
Filieri
,
R.
,
Jacobson
,
J.
, …
Wang
,
Y.
(
2021
).
Setting the future of digital and social media marketing research: Perspectives and research propositions
.
International Journal of Information Management
,
59
(
June
), 102168. doi: .
Ferries
,
C.
(
2025
).
TripAdvisor statistics 2024
.
Available from:
 Link to the website
Fortune Business Insights
(
2025
).
Food service market size, share & industry analysis, by type (full service restaurants, quick service restaurants, institutes, and others), by restaurant type (chained, and independent), by service type (Dine-In, takeaway, and delivery), and regional fore
,
230
.
Available from:
 Link to the website
García-Fernández
,
J.
,
Fernández-Gavira
,
J.
,
Sánchez-Oliver
,
A. J.
,
Gálvez-Ruíz
,
P.
,
Grimaldi-Puyana
,
M.
, &
Cepeda-Carrión
,
G.
(
2020
).
Importance-performance matrix analysis (Ipma) to evaluate servicescape fitness consumer by gender and age
.
International Journal of Environmental Research and Public Health
,
17
(
18
),
1
–
19
. doi: .
Gera
,
A.
,
Halfon
,
A.
,
Ein-dor
,
L.
, &
Slonim
,
N.
(
2022
).
Zero-shot text classification with self-training
.
1107
–
1119
.
Goffi
,
G.
,
Osti
,
L.
,
King
,
B.
,
Osti
,
L.
, &
King
,
B.
(
2025
).
From plate to place : How authentic dining experiences in ethnic restaurants enhance national image and motivate travel ABSTRACT
.
Tourism Recreation Research
,
0
(
0
),
1
–
14
. doi: .
Graham
,
D.
,
Ali
,
A.
, &
Tajeddini
,
K.
(
2020
).
Open kitchens: Customers’ influence on chefs’ working practices
.
Journal of Hospitality and Tourism Management
,
45
,
27
–
36
. doi: .
Ha
,
J.
, &
Jang
,
S. C. S.
(
2010
).
Effects of service quality and food quality: The moderating role of atmospherics in an ethnic restaurant segment
.
International Journal of Hospitality Management
,
29
(
3
),
520
–
529
. doi: .
Halder
,
K.
,
Akbik
,
A.
,
Krapac
,
J.
, &
Vollgraf
,
R.
(
2020
).
Task-aware representation of sentences for generic text classification
. In
COLING 2020 - 28th International Conference on Computational Linguistics, Proceedings of the Conference
(pp. 
3202
–
3213
). doi: .
Hung
,
K.
,
Guillet
,
B. D.
, &
Zhang
,
H. Q.
(
2018
).
Understanding luxury shopping destination preference using conjoint analysis and traditional item-based measurement
,
58
(
3
),
411
–
426
. doi: .
Kar
,
M. V. D.
,
Xia
,
M.
,
Chen
,
D.
, &
Artetxe
,
M.
(
2022
).
Don’t prompt, search! Mining-Based zero-shot learning with language models
. In
Proceedings of the 2022 Conference on Empirical Methods in Natural Language Processing, EMNLP 2022
(pp. 
7508
–
7520
). doi: .
Karadağ
,
H.
,
Tosun
,
P.
, &
Ayan
,
B.
(
2024
).
User-generated and brand-generated content as indicators of university brand personality and business strategy
.
Journal of Marketing for Higher Education
,
34
(
2
),
646
–
668
. doi: .
Karnreungsiri
,
I.
(
2022
).
Applying importance-performance analysis for developing a model of quick service restaurant innovation strategies in downtown bangkok
.
ABAC Journal
,
42
(
2
),
27
–
51
.
Kau
,
A. K.
, &
Lim
,
P. S.
(
2005
).
Clustering of Chinese tourists to Singapore: an analysis of their motivations, values and satisfaction
.
International Journal of Tourism Research
,
7
(
4-5
),
231
–
248
. doi: .
Kim
,
J.-H.
,
Song
,
H.
,
Youn
,
H.
(
2019
).
The chain of effects from authenticity cues to purchase intention: The role of emotions and restaurant image
.
International Journal of Hospitality Management
,
8
(
5
),
55
.
Lee
,
T. H.
, &
Jan
,
F. H.
(
2019
).
Can community-based tourism contribute to sustainable development? Evidence from residents’ perceptions of the sustainability
.
Tourism Management
,
70
(
September 2017
),
368
–
380
. doi: .
Lee
,
R. S.
, &
Lee
,
S. Y.
(
2023
).
Analysis of relationship between service quality of food and beverage and customer behaviors for sustainable golf course management
.
Sustainability (Switzerland)
,
15
(
14
),
11207
. doi: .
Line
,
N. D.
,
Hanks
,
L.
, &
Kim
,
W. G.
(
2018
).
An expanded servicescape framework as the driver of place attachment and word of mouth
.
Journal of Hospitality & Tourism Research
,
42
(
3
),
476
–
499
. doi: .
Liu
,
H.
,
Li
,
H.
,
Dipietro
,
R. B.
, &
Levitt
,
J. A.
(
2018
).
The role of authenticity in mainstream ethnic restaurants Evidence from an independent full-service Italian restaurant
,
30
(
2
),
1035
–
1053
. doi: .
Mari
,
M.
, &
Poggesi
,
S.
(
2013
).
Servicescape cues and customer behavior: A systematic literature review and research agenda
.
Service Industries Journal
,
33
(
2
),
171
–
199
. doi: .
Mariani
,
M.
, &
Baggio
,
R.
(
2022
).
Big data and analytics in hospitality and tourism: A systematic literature review
.
International Journal of Contemporary Hospitality Management
,
34
(
1
),
231
–
278
. doi: .
Martilla
,
J. A.
, &
dan
,
J. C. J.
(
1977
).
Importance-per analysis
.
Journal of Marketing
,
41
(
1
),
77
–
79
.
Martín
,
D.
,
Gremler
,
D. D.
,
Washburn
,
J. H.
, &
Cepeda
,
G.
(
2008
).
Service value revisited: Specifying a higher-order, formative measure
.
Journal of Business Research
,
61
(
12
),
1278
–
1291
. doi: .
Nam
,
S.
, &
Lee
,
H. C.
(
2019
).
A text analytics-based importance performance analysis and its application to airline service
.
Sustainability
,
11
(
21
),
6153
. doi: .
Nam
,
D.
,
Lee
,
J.
, &
Lee
,
H.
(
2019
).
Business analytics adoption process: An innovation diffusion perspective
.
International Journal of Information Management
,
49
(
October 2018
),
411
–
423
. doi: .
Namkung
,
Y.
, &
Jang
,
S. C.
(
2008
).
Are highly satisfied restaurant customers really different? A quality perception perspective
.
International Journal of Contemporary Hospitality Management
,
20
(
2
),
142
–
155
. doi: .
Nawawi
,
I.
,
Ilmawan
,
K. F.
,
Maarif
,
M. R.
, &
Syafrudin
,
M.
(
2024
).
Exploring tourist experience through online reviews using aspect-based sentiment analysis with zero-shot learning for hospitality service enhancement
.
Information
,
15
(
8
),
499
. doi: .
Nguyen
,
T. T. T.
, &
Tong
,
S.
(
2023
).
The impact of user-generated content on intention to select a travel destination
.
Journal of Marketing Analytics
,
11
(
3
),
443
–
457
. doi: .
Oh
,
H.
(
2001
).
Revisiting importance – performance analysis
.
Tourism Management
,
22
(
September 2000
),
617
–
627
. doi: .
Ozcelik
,
A.
, &
Akova
,
O.
(
2021
).
The impact of street food experience on behavioural intention
.
British Food Journal
,
123
(
12
),
4175
–
4193
. doi: .
Parasuraman
,
A.
, &
Zeithaml
,
V.
(
1988
).
SERVQUAL: A multiple-item scale for measuring consumer perceptions of service quality
.
Journal of Retailing
,
64
(
1
),
12
–
40
.
Parasuraman
,
A. P.
,
Berry
,
L. L.
, &
Zeithaml
,
V. A.
(
1991
).
Understanding customer expectations of service understanding customer expectations of service
.
Sloan Management Review
,
32
(
3
),
39
–
48
.
Paunić
,
M.
,
Kalenjuk Pivarski
,
B.
,
Tešanović
,
D.
,
Novaković
,
D.
,
Šmugović
,
S.
,
Šarenac
,
N.
, …
Marjanović
,
J.
(
2024
).
Gastronomic identity factors in the function of sustainable gastronomy: A case study of tourist destinations in the republic of Serbia and Bosnia and Herzegovina
.
Sustainability
,
16
(
19
),
8493
. doi: .
Pop
,
R. A.
,
Săplăcan
,
Z.
,
Dabija
,
D. C.
, &
Alt
,
M. A.
(
2022
).
The impact of social media influencers on travel decisions: The role of trust in consumer decision journey
.
Current Issues in Tourism
,
25
(
5
),
823
–
843
. doi: .
Rasoolimanesh
,
S. M.
,
Seyfi
,
S.
,
Hall
,
C. M.
, &
Hatamifar
,
P.
(
2021
).
Understanding memorable tourism experiences and behavioural intentions of heritage tourists
.
Journal of Destination Marketing & Management
,
21
(
September
), 100621. doi: .
Reimers
,
N.
, &
Gurevych
,
I.
(
2019
).
Sentence-BERT: Sentence embeddings using siamese BERT-networks
. In
EMNLP-IJCNLP 2019 - 2019 Conference on Empirical Methods in Natural Language Processing and 9th International Joint Conference on Natural Language Processing, Proceedings of the Conference
(pp. 
3982
–
3992
). doi: .
Restrowork
(
2025
).
Global restaurant industry statistics 2025: Market size, growth trends & key data
.
Available from:
 Link to the website
Seo
,
K. H.
, &
Lee
,
J. H.
(
2025
).
The impact of service quality on perceived value, image, satisfaction, and revisit intention in robotic restaurants for sustainability
.
Sustainability
,
17
(
16
),
1
–
16
. doi: .
Sithole
,
M. V.
,
Roux
,
T.
, &
Retief
,
M.
(
2025
).
Experiential marketing through service quality antecedents: Customer experience as a driver of satisfaction and revisit intentions in South African restaurants
.
Tourism and Hospitality
,
6
(
5
),
227
. doi: .
Slack
,
N. J.
,
Singh
,
G.
,
Ali
,
J.
,
Lata
,
R.
,
Mudaliar
,
K.
, &
Swamy
,
Y.
(
2021
).
Influence of fast-food restaurant service quality and its dimensions on customer perceived value, satisfaction and behavioural intentions
.
British Food Journal
,
123
(
4
),
1324
–
1344
. doi: .
Smith
,
A. K.
, &
Bolton
,
R. N.
(
2002
).
The effect of customers’ emotional responses to service failures on their recovery effort evaluations and satisfaction judgments
.
Journal of the Academy of Marketing Science
,
30
(
1
),
5
–
23
. doi: .
Song
,
H.
,
Yang
,
H.
, &
Sthapit
,
E.
(
2025
).
Robotic service quality, authenticity, and revisit intention to restaurants in China: Extending cognitive appraisal theory
.
International Journal of Contemporary Hospitality Management
,
37
(
5
),
1497
–
1515
. doi: .
Stevens
,
P.
,
Knutson
,
B.
, &
Patton
,
M.
(
1995
).
Dineserv: A tool for measuring service quality in restaurants
.
Cornell Hotel and Restaurant Administration Quarterly
,
36
(
2
),
56
–
60
. doi: .
Zeithaml
,
V. A.
,
Berry
,
L. L.
, &
Parasuraman
,
A.
(
1996
).
The behavioral consequences of service quality
.
Journal OfMarketing
,
60
(
2
),
31
–
46
. doi: .
Zhong
,
Y.
, &
Moon
,
H. C.
(
2020
).
What drives customer satisfaction, loyalty, and happiness in fast-food restaurants in China? Perceived price, service quality, food quality, physical environment quality, and the moderating role of gender
.
Foods
,
9
(
4
),
1
–
16
. doi: .
Keller
,
K. L.
(
2013
).
Conceptualizing, measuring, and managing customer-based brand equity
.
Journal of Marketing
,
57
(
1
),
1
–
22
.
Keyt
,
J. C.
,
Yavas
,
U.
, &
Riecken
,
G.
(
1994
).
Importance-performance analysis: A case study in restaurant positioning
.
International Journal of Retail & Distribution Management
,
22
(
5
),
35
–
40
. doi: .
Lane
,
C.
(
2013
).
Taste makers in the ‘fine-dining’ restaurant industry: The attribution of aesthetic and economic value by gastronomic guides
.
Poetics
,
41
(
4
),
342
–
365
. doi: .
Marković
,
S.
,
Raspor
,
S.
, &
Šegarić
,
K.
(
2010
).
Does restaurant performance meet customers’ expectations? An assessment of restaurant service quality using a modified DINESERV approach
.
Tourism and Hospitality Management
,
16
(
2
),
181
–
195
. doi: .
Ryu
,
K.
, &
Shawn Jang
,
S.
(
2008
).
DINESCAPE: A scale for customers’ perception of dining environments
.
Journal of Foodservice Business Research
,
11
(
1
),
2
–
22
. doi: .

Languages

or Create an Account

Close subscription notice
Close access options