This study proposes a deep learning-based decision support system for stress induction management in tangerine cultivation. While current techniques depend heavily on subjective visual information, we offer an objective, data-driven mechanism to determine whether a branch is likely to respond favorably to stress induction.
Leaf images were used as input, as color reflects photosynthetic pigment composition linked to readiness for stress-induced flowering. A dataset of 516 images, acquired under controlled conditions, was used to train the model. The system predicts flowering success into three categories: low, moderate and high. Four convolutional neural networks architectures (VGG16, ResNet50, MobileNet and Inception) were evaluated using Adam and Adamax with 10-fold cross-validation. Beyond standard transfer learning, the modeling pipeline integrates task-specific fine-tuning and red-, green- and blue-based colorimetric interpretation. Performance analysis includes receiver operating characteristic and gradient-weighted class activation mapping, with metrics summarized using accuracy, precision, recall and F1-score. Model selection was based on class-wise robustness and model size.
We found that architectural choice strongly affects predictive performance. The inception provides the highest accuracy-efficiency ratio (accuracy = 0.90, F1-Score = 0.89, precision = 0.92, recall = 0.88 and model size = 57 Megabytes), beating larger models and being lightweight enough for mobile application. The trained models were implemented into a mobile application prototype for real-time inference. The low flowering-success category remains difficult to detect due to its high intra-class variability.
This decision support system provides a practical approach to use an artificial intelligence-driven flowering analysis straight in stress induction workflows for more accurate and efficient cultivation management.
1. Introduction
The Citrus reticulata (tangerine) industry is one of the fastest growing industries globally in various respects. Tangerines were among the category of “major fruit crops” grown in more than 140 countries. Tangerine production has experienced rapid growth, with an average annual increase of approximately 4.4% and a production increase of 374.77% from 1982 to 2022. The planted area increased by 377.63% during the same period [1]. In terms of added value from its derivative products, the global tangerine essential oil market is estimated to reach USD 420m in 2025, with a compound annual growth rate of 5.1% for the period 2025–2035 [2]. This shows that tangerines are not only important as a tropical fruit commodity with high economic value, but also as a basic ingredient in various industries such as cosmetics, medicine and aromatherapy. In the other hand, small-scale tangerine farmers face multiple production constraints, including nutrient deficiencies, pests, diseases, climatic variability and limited technological support, which reduce their capacity to meet market demand [3]. Therefore, stress induction has been introduced to accelerate flowering and improve efficiency [4]. Indonesia's “Pikung”, a local term referring to the citrus stress-induction technique, applies controlled branch massage and bending to stimulate flowering within one month. However, its success depends on internal factors (physiological status, nutrient balance and cultivar responsiveness) [5] and external conditions (light, temperature, environmental stress, pests and diseases) [6]. Therefore, evaluating plant physiological condition before stress induction is recommended to minimize risk and optimize outcomes [7]. Yet, current assessments remain largely subjective, highlighting the need for objective, image-based support for pre-induction decision-making.
Leaf coloration serves as an effective proxy for assessing plant physiological status, as it reflects variations in photosynthetic pigments that indicate nutrient balance and stress responses [8]. Along with the advances in information technology, plant monitoring has evolved into a scalable data-driven system, supporting precision horticulture and decision-making [9]. Existing agricultural decision support systems (DSS), including citrus production, have demonstrated improvements in resource efficiency and management through real-time monitoring [10, 11]. However, these systems remain largely reactive, focusing on diagnosing current conditions rather than predicting treatment outcomes. In response to this gap, we extend existing approaches from reactive diagnosis toward proactive and predictive decision support.
Recent studies in agricultural engineering imaging highlight the effectiveness of deep learning for plant analysis. Systematic reviews emphasize the importance of image acquisition, pre-processing and classification pipelines [12], while transfer learning approaches have achieved strong performance in plant disease classification across crops such as sunflower and papaya [13, 14]. Advanced architectures, including PapNet, further improve detection accuracy [15]. Those prior works primarily address classification tasks and often overlooks challenges related to dataset quality, feature scale sensitivity and generalization [16, 17] as well as the need for multi-scale feature representation [18]. In contrast, this study adopts a task-specific, architecture-aware fine-tuning strategy within a mobile DSS framework. This approach enables predictive modeling of treatment outcomes rather than conventional classification while systematically addressing generalization and model adaptation challenges.
The use of deep learning algorithms for the non-destructive estimation of photosynthetic pigment composition from leaf images has been made possible by an Android-based application [19]. This application measures the concentrations of three main photosynthetic pigments: chlorophyll, carotenoids and anthocyanins, based on real-time red, green and blue (RGB) leaf images. Building on this concept, we expanded our application to include a decision support system for assessing the physiological readiness of individual tangerine branches for stress induction. The proposed framework formulates flowering readiness assessment as a multi-class classification task (low, medium and high) and employs convolutional neural networks (CNN) trained on labeled images acquired under controlled conditions. Multiple CNN architectures and optimization strategies are systematically evaluated using predictive performance metrics and computational efficiency indicators. The selected lightweight model is subsequently integrated into a mobile application prototype, enabling real-time inference and practical field deployment.
The main contributions of this study are summarized as follows:
Conceptual contribution: Formulation of pre-induction flowering success prediction as a multi-class image classification task in tangerine cultivation;
Methodological contribution: Development of a CNN-based modeling pipeline that integrates task-specific fine-tuning, class-wise performance analysis and RGB-based physiological interpretation and
Translational contribution: Systematic comparison of multiple CNN architectures using both predictive accuracy and computational efficiency as joint selection criteria, providing insight into model suitability for mobile, field-level decision support.
2. Methods
2.1 Design of the system
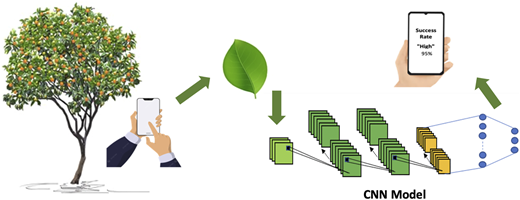
The system captures branch-leaf images directly in the field using a smartphone and analyzes them with a CNN model to non-destructively infer key photosynthetic pigment characteristics. These features are incorporated into a predictive model that estimates flowering success, categorized into low, moderate or high classes. Predictions, along with their confidence levels, are displayed in real time on the smartphone, providing immediate decision support. This structured, data-driven framework enables farmers to assess branch readiness and determine the appropriate timing for stress induction. Figure 1 illustrates the conceptual architecture and interaction of the system components.
2.2 Dataset
The CNN training dataset was developed from experimental observations conducted in a commercial tangerine plantation in Pandanrejo Village, East Java, Indonesia. Branches from selected trees were identified and categorized by a horticultural expert from the Indonesian National Research and Innovation Agency into high and low-likelihood stress-response groups. Each branch was uniquely labeled with its sample ID, experiment date and preliminary success prediction. For every branch, three representative leaves still attached to the branch were photographed using a smartphone camera (Samsung Galaxy A53 5G, Exynos1280, RAM 8 GB memory 256 GB) to capture the visual characteristics associated with the anticipated treatment outcome. Leaf images were captured with a fixed resolution of 1,269×1,586 pixels. Image acquisition was conducted under typical tropical daylight levels conditions between 08:00–11:00 AM to minimize extreme shadowing and illumination variability. During image capture, leaves were positioned against a uniform background to reduce visual noise and background interference. Care was taken to avoid occlusions, excessive shadow and overexposure. All images were collected at a consistent distance of approximately 10–15 cm from the leaf surface to maintain scale consistency across samples. After image acquisition, bending stress induction was applied to all selected branches. The experiment lasted for a month, after which the actual number of flowers formed on each treated branch was recorded. This post-treatment flowering count served as the ground-truth indicator of treatment success and was used to validate expert predictions and label the dataset for supervised learning. In addition to image acquisition, the color of each selected leaf was measured in situ using a portable colorimeter (ZL WR10, 8 mm). In total, 516 leaf images were collected from 172 tangerine branches. The dataset was divided into training and testing subsets using a stratified 80–20 split. The validation metrics reported during training were computed using a validation subset derived from the training data. The independent test set was reserved exclusively for final performance evaluation (Table 1).
2.3 Convolutional neural network modeling
Four CNN architectures, i.e. VGG16, ResNet50V2, MobileNetV2 and InceptionV3, pretrained on the ImageNet dataset, were evaluated to predict stress-induction success. The architectures were selected to balance feature extraction capability, model complexity and computational efficiency. The VGG16 served as a baseline, ResNet50V2 leveraged residual learning for stable biological image classification, MobileNetV2 targeted resource-constrained mobile deployment and InceptionV3 enabled multi-scale feature extraction to capture subtle leaf differences [20, 21]. To ensure both predictive robustness and smartphone applicability, Adam and Adamax optimizers were compared, given their proven effectiveness in plant-image tasks [22]. Model performance was assessed using confusion matrix–based metrics (accuracy, precision, recall and F1-score) under a 10-fold cross-validation scheme, with categorical cross-entropy loss function and a SoftMax output layer to provide class probabilities and prediction confidence. To enhance model generalization and mitigate overfitting due to the limited dataset size, online data augmentation was applied exclusively to the training set using geometric transformations. The augmentation configuration included random rotations within ±20°, shear transformations up to 0.2, zoom variations within the range of 0.8–1.2, horizontal flipping and spatial translations of up to 20% along both width and height dimensions. These transformations were implemented in real-time during training to increase sample diversity while preserving the biological characteristics of leaf structures.
A task-specific fine-tuning strategy is proposed to adapt pre-trained CNN models to the characteristics of leaf images used for stress induction assessment, leveraging the hierarchical nature of CNN representations in which early layers capture general features and deeper layers encode task-specific patterns. To assess its effectiveness, three layer-freezing configurations are evaluated: (1) baseline, full fine-tuning without freezing (2) freezing early layers and (3) freezing higher layers. All configurations are trained under identical settings to ensure fair comparison. The selection of trainable layers is tailored to each architecture as follows:
VGG16: block 1–4 frozen, block 5 trainable;
ResNet50V2: conv 1–4 frozen, conv 5 trainable;
MobileNetV2: approximately the first 70% of layers frozen and
InceptionV3: lower modules frozen, upper modules trainable
3. Result and discussion
3.1 Leaf color profiling and its association with stress induction outcomes
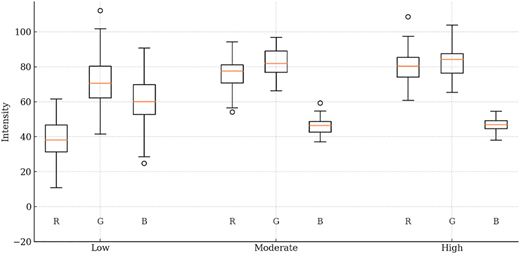
We profiled each leaf category (see Figure 2) using colorimeter data collected concurrently with leaf image acquisition. The objective of this profiling process was to identify and quantify the color differences among the three classes of possible outcomes. The colorimeter measurements were first converted from the CIELAB color space into RGB format, after which the mean and standard deviation were computed to characterize the distinguishing color properties of each class. This profiling establishes a basis for evaluating color differences linked to various levels of stress induction outcomes.
Leaves in the low-class showed lower red and moderate blue intensities with dominant green, indicating chlorophyll-rich but physiologically neutral foliage. This profile reflects vigorous vegetative growth with minimal stress-related pigment signals, explaining the limited responsiveness to stress induction and reduced flower initiation [23]. The moderate-class exhibited increased red intensity and decreased blue while maintaining high green. This shift suggests early pigment rebalancing, possibly reduced chlorophyll and increased carotenoid or anthocyanin precursors, indicating partial physiological readiness and moderate flowering response [24]. In the high-class, leaves displayed the highest green intensity alongside sustained high red and slightly elevated blue. This balanced pigment composition suggests strong chlorophyll content with stable stress adaptation, reflecting branches physiologically primed for reproductive transition and higher flower formation after stress induction.
The fact that leaves attached to branches with moderate and high flowering potentials cannot be differentiated solely based on their RGB color profiles, further reinforces the suitability of a CNN-based approach. Leaf traits indicating it has left the vigorous vegetative phase and has moderate–high flowering potential include reduced growth, osmolyte build-up, lower photosynthetic activity and activation of senescence-related genes. Although these traits are biochemical, they manifest visually in digital images through distinct spatial, textural and structural characteristics, including variations in venation patterns, micro-surface irregularities and other subtle physiological cues [24, 25]. CNNs are well-equipped to capture these complex, non-color features, enabling a more reliable assessment of the branch's readiness for stress induction.
3.2 The assessment of CNN classification performance
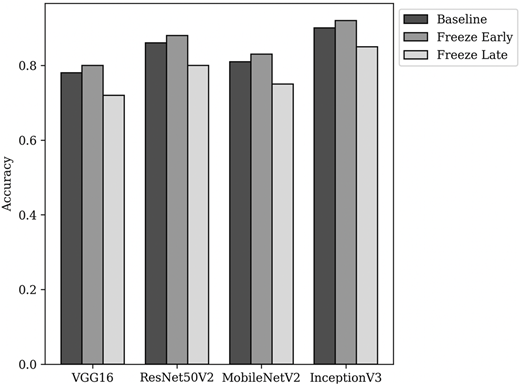
Figure 3 compares training accuracy of the baseline (no freezing) and fine-tuning strategies across all evaluated CNN models. It shows a consistent pattern in which freezing early layers, while fine-tuning higher layers achieves the best performance. Freezing early layers strategy yields systematic improvements across VGG16, ResNet50V2, MobileNetV2 and InceptionV3. This fact indicates that preserving transferable low-level features while adapting higher level representations enhances model generalization. In contrast, freezing higher layers leads to a substantial performance decline, highlighting the critical role of these layers in capturing domain specific patterns for stress induction prediction. Although full fine-tuning remains competitive, its marginal gains suggest that a controlled, architecture aware strategy provides a more stable and consistently superior outcome. Based on these findings, the model employing the freeze early strategy is adopted for subsequent implementation and analysis.
Table 2 compares two optimization methods (Adam and Adamax) across four CNN architectures training phase using the freeze early strategy. Accuracy, precision, recall and F1-score are reported as mean ± standard deviations based on 10-fold cross validation. The italic cells represent the best performing configuration for each architecture, indicating the potential selected model for downstream evaluation and deployment.
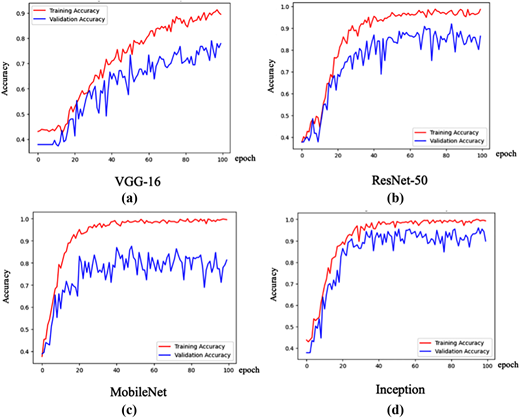
The results show clear optimizer–architecture interactions. For VGG-16, Adamax significantly outperforms Adam (F1-score 0.77 vs. 0.18), indicating more stable convergence, while Adam exhibits underfitting. In ResNet-50V2, Adam achieves the best overall performance, slightly surpassing Adamax, reflecting its compatibility with residual learning and adaptive momentum updates. For MobileNetV2, Adam performs poorly (F1-score 0.18), whereas Adamax delivers strong results (F1-score 0.81), suggesting that ∞-norm scaling better stabilizes its depth-wise separable layers. The highest overall performance is obtained by inception with Adamax (F1-score 0.89), confirming that its multi-branch architecture benefits from smoother gradient adaptation. Therefore, inception trained with Adamax is selected as the final model. The consistently low standard deviation values across all models (≤0.05) further confirm that the freeze early fine-tuning strategy leads to stable performance. Figure 4 further illustrates the training dynamics of the best configuration for each architecture.
The training and validation curves reveal distinct learning behaviors across models. VGG-16 achieved high training accuracy but exhibited fluctuating and consistently lower validation accuracy. This behavior indicates its limited generalization and is early sign of overfitting, likely due to its shallow architecture. In contrast, ResNet-50V2 demonstrated stable convergence with a minimal gap between training and validation performance. This behavior reflects effective feature learning enabled by residual connections. MobileNetV2 reached near perfect training accuracy but showed unstable and lower validation performance, thus requiring stronger regularization strategies to overcome its high sensitivity to dataset variability. Among all models, inception exhibited the most balanced and stable learning behavior. Its training and validation curves were closely aligned with high accuracy, indicating strong generalization capability through effective multi-scale feature extraction.
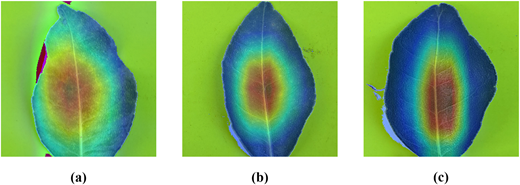
In general, the experimental data indicated that architecture choice had a significant impact on model performance in predicting stress-induced flowering success. These findings demonstrate the need to select architectures with sufficient representational depth and multi-scale processing capability with respect to heterogeneous leaf characteristics. The Grad-CAM visualizations (Figure 5) further support these findings by revealing how the inception model focuses on biologically relevant leaf regions when predicting stress-induced flowering success. Across the low, moderate and high-classes, the activation maps consistently concentrate on the central leaf area, particularly along the midrib and surrounding tissue, rather than on background regions. This indicates that the model extracts meaningful color and texture cues directly associated with physiological leaf conditions. Notably, the attention pattern for the low-class appears more diffuse and less concentrated compared to the moderate and high classes.
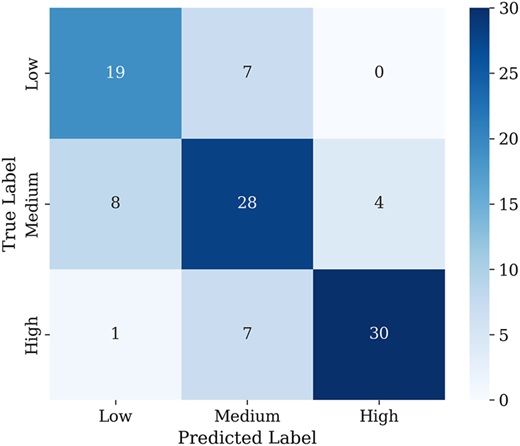
The class-wise assessment of the inception model indicates specific characteristics with significant operational consequences (see Table 3 and Figure 6). The model achieved a very high precision for the low-class (0.97). Therefore, it performs very well in predicting the low-class, with only a few false positives. However, its recall of 0.77 shows that approximately 23% of the true low-class samples are misclassified as moderate or high-class. This under-detection can lead to unnecessary interventions in branches that have low flowering capacity. The moderate class showed the most optimal performance, with high precision (0.97) and recall (0.88), indicating that most samples were correctly predicted with minimal errors, making it the most stable and reliable class. The high class achieved perfect recall (1.00) but lower precision (0.82), indicating that some moderate or low branches were misclassified as high, resulting in false positives. In the context of stress induction, this may lead to unnecessary prioritization of branches that do not require treatment, reducing efficiency and resource allocation effectiveness.
Those findings are strongly substantiated by the colorimetric boxplots in Figure 1. The low-class exhibits the widest spread across RGB channels. This behavior indicates substantial intra-class variability during the vegetative phase. Such variability increases overlap with moderate and high distributions, making it difficult for the model to learn a stable and distinct decision boundary for low-class. In contrast, the moderate and high-classes display more compact and homogeneous feature distributions, which supports their higher recall values. The moderate-class shows the most balanced performance, suggesting that stress induction decisions for this group are relatively reliable and consistent. The high class achieves perfect recall, ensuring that all high-success branches are detected.
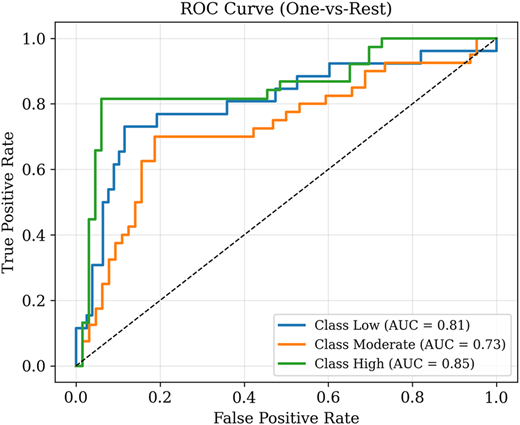
As shown in Figure 7, ROC analysis was conducted to further examine the detection difficulty observed in the low-class, which is consistent with its heterogeneous RGB characteristics. While standard metrics in Table 3 reflect performance under the SoftMax decision rule, ROC analysis evaluates class separability across varying probability thresholds. The low-class shows a reasonably strong area under the receiver operating characteristic curve (AUC) (0.81), indicating that it can generally be distinguished from other classes. However, this does not translate into high recall at the operational threshold. This discrepancy suggests greater intra-class variability and feature overlap, leading to inconsistent detection. In contrast, although the moderate-class has a lower AUC (0.73) and the high class achieves perfect recall, both exhibit more consistent feature distributions. Overall, these findings confirm that the low-class remains intrinsically more difficult to detect due to biologically heterogeneity rather than model instability.
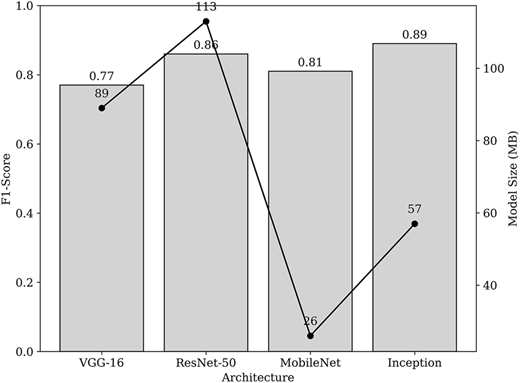
Finally, to justify the decision to make InceptionV3 the best-performing model practically, it is important to compare its predictive performance with the computational footprint. Figure 8 shows the trade-off between predictive performance (F1-score bars) and computational load (model-size line) across the four architectures. ResNet-50V2 achieves a high F1-score (0.86) but is the largest model (113 MB). VGG16 offers the weakest balance of performance and size (F1 = 0.77; 89 MB). MobileNetV2 is the smallest (26 MB) but delivers a lower F1-score (0.81) and suffers from overfitting, limiting its usability. InceptionV3 provides the best overall trade-off, with the highest F1-score (0.89) and a moderate model size (57 MB). The complexity of the inception backbone in terms of floating-point operations was calculated to quantitatively describe its computational demand as well. With a 299 × 299 × 3 input resolution, we find that Inception takes roughly 5.7 GFLOPs per forward inference with 23.9 million parameters, which is still a manageable computational load compared to deeper architectures. It is substantially smaller than ResNet-50V2 and performs better than all other models. This profile justifies the choice of Inception as a practical architecture, striking a balance between high predictive accuracy and computational efficiency. Thus, ensures its applicability to mobile deployments.
3.3 Mobile application prototype for in-situ prediction
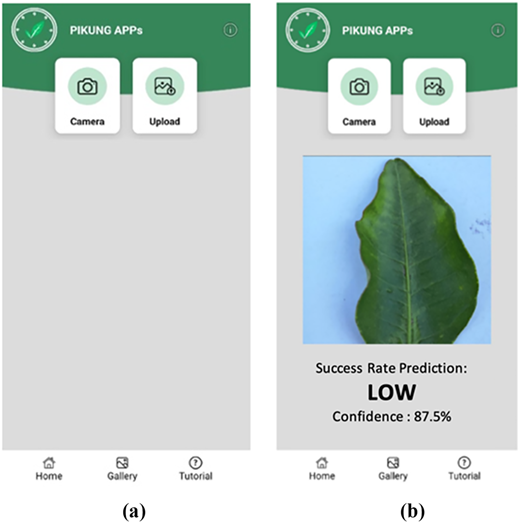
Figure 9 shows the user interface of PIKUNG APPs. It is a mobile application prototype developed to facilitate field-based assessment of flowering success. The home screen provides users with two options for the input image: capturing a new leaf image using the device camera or uploading an existing image from storage. These features ensure flexibility during field operations. The prediction screen displays the uploaded or captured leaf along with the model's inference result. In this example, the system identified the leaf as belonging to the low-class with a confidence level of 87.5%. This interface demonstrates how the deployed model (inception-based classifier) is integrated into a practical, user-friendly workflow that enables farmers and field technicians to perform real-time, in-situ evaluations of branch readiness for stress induction treatment.
3.4 Limitations and future work
While this study indicates promising results, there are a few drawbacks which need to be addressed in future studies. The relatively small dataset size may limit overall model performance in modeling the biological variability in leaf responses to stress induction, prompting the need to scale the dataset with broader spatial coverage and more diverse samples. Data were recorded under specific environmental and management conditions, which may restrict generalizability. Thus, further research should focus on multi-season and multi-location validation to guarantee robustness in different climatic and agronomic settings. The emphasis on expert-based labeling implies that subjectivity may follow, further demonstrating the need for standard annotation protocols and the verification of inter-rater agreement in future works. Lastly, practical deployment concerns (e.g. field lighting fluctuations, hardware limitations and inference efficiency) also need to be considered in a real world scenario to guarantee the system would be applied to operational stress induction management.
4. Conclusions
In this study, we introduce a deep learning–based DSS that transforms stress induction management in tangerine cultivation from subjective visual judgment into an objective, image-driven pre-treatment evaluation. By leveraging branch-leaf imagery as a proxy for physiological readiness, the system demonstrates that flowering response can be assessed prior to stress induction, shifting decision from reactive monitoring to proactive treatment planning. The findings confirm that architectural design critically influences both predictive reliability and deployment feasibility for mobile-based field applications. Class-wise analysis further reveals that the low flowering-success class prediction is more complex due to high intra-class variability. This finding highlights the physiological ambiguity of marginal branches, thereby underscoring the need for data-driven support in borderline cases. This insight strengthens the agronomic relevance of the model beyond pure classification performance. By integrating physiological interpretation with deployable deep learning, this work contributes a new DSS framework focused specifically on predicting treatment success before stress induction. This area largely overlooked in existing horticultural artificial intelligence applications. The mobile prototype demonstrates practical feasibility for real-time use, offering a scalable pathway toward more consistent branch selection, reduced intervention risk and improved cultivation efficiency. Further multi-season and multi-site validation will be essential to confirm robustness and generalizability.
Ethical compliance
This research involved no human participants or animals. All field activities were conducted with the permission of local farmers and followed standard agronomic practices. The study complies with institutional and national ethical guidelines.